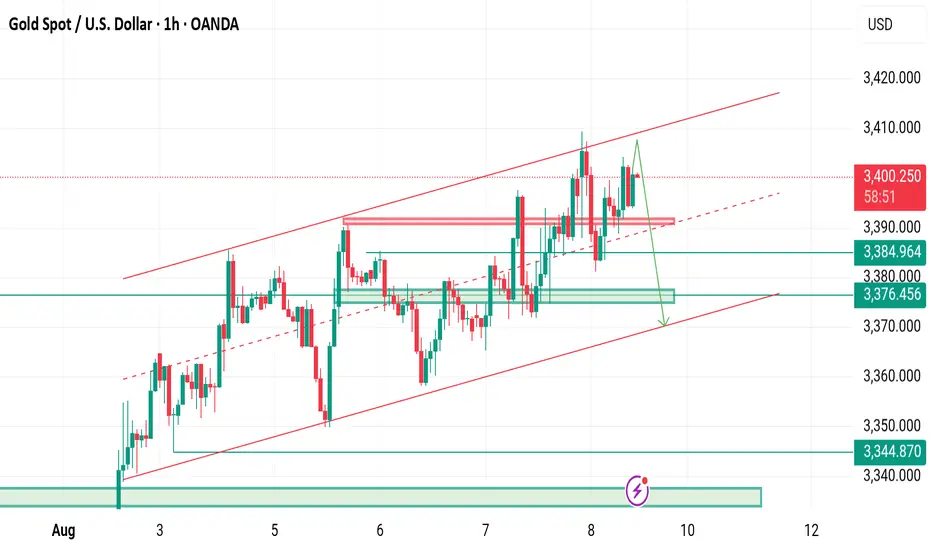
Gold (XAU/USD) Technical Analysis | August 8, 2025📊 Gold (XAU/USD) Technical Analysis | August 8, 2025
Gold price has reached the midline of the channel in the 4H timeframe and reacted to it, forming a descending trendline afterward.
🔻 Bearish Scenario:
If the price rejects from this area, the next downside targets will be:
3382.71
3375
3370
🔺 Bullish Scenario:
If the descending trendline and the channel’s midline are broken decisively with confirmation, the next upside targets will be:
3413
3423
📌 Conclusion:
The reaction to the channel midline and whether this zone holds or breaks will determine gold’s next move. Traders should closely watch these key levels for potential opportunities.
XAUUSD trade ideas

No Trade in Aug Is it true [XAUUSD]After few days gold is stuck in selling zone as PW is bearish gold should take PDL and move ahead it soon will it happen.
buy gold saw liquidity sweep and unmitigated zones. comment for my explanation because I want to teach serious people only
thank you

XAUUSD is on rising channel H1-H4 TIMEFRAME SETUP
Currently XAUUSD is following the rising channel along with flag pattern although I expecting market will fall from 3406-3410 zone.
What possible scenarios we have ?
• Market has to gives closing of H4 below 3390 for the implusive drop ,also I'm on holding sell trade above 3400 and my Targets are 3380 then 3365.
• secondly If gold drops to 3342-3335 thats my Buying area where I will buy XAUUSD in dips and my optimal target will be 3365 then 3380.
Additional Tip:
Above 3410 no sell Trade our rising channel will be invalid as Per SMC (BOS & CHOCH)
XAUUSD Wave iv Pullback Buy Plan – Targeting Wave v BreakoutBias
Primary Trend: Bullish – likely in Wave iii of a larger Wave (III).
Current pullback appears to be a minor Wave iv correction inside Wave iii, offering potential re-entry zones before pushing to Wave v and then larger Wave (III) completion.
Buy Limit / Long Entry: Around 3,380 – 3,384
Just above LR / MD zone and trendline support.
Aligns with Elliott Wave structure for a Wave v continuation.

XAUUSD LONG PositionGold has been ranging for a while now, looking at Mr. America tariff race. We look gold to push Further up with no Compromising area of reversal.

Liquidity Sweep to Drop – XAUUSD Sell Plan🟠 Context Summary
Chart Type: XAUUSD 15M
Pattern Observed: Liquidity sweep and sharp rejection from premium zone.
Label: “Gold Start Melting”
Distribution Zone Targeted
🔽 Sell Plan
✅ Bias: Bearish
📍 Entry Zone (Sell Entry Area):
Entry after price tapped into premium zone (highlighted red box).
Strong bearish engulfing candle confirms rejection.
🎯 Target Zones:
Target 1: 3,368 (top of distribution zone)
Target 2: 3,317 (bottom of distribution zone)
Target 3 (Final): 3,293 (full FVG fill / value area)
⛔ Stop Loss:
Above the swing high that caused the drop.
Suggested: 3,400.50 – 3,403.00
⚙️ Entry Confirmation:
Confirm entry after:
Price closes below small support or consolidation (green zone).
Breakdown retest (if price pulls back).
🧱 Trade Logic
Sweep of Liquidity: Price took out highs and immediately reversed.
FVG Created: Implied institutional selling interest.
Distribution Zone: Forecasting larger move down.
📌 Notes:
Watch for lower timeframe consolidation before continuation.
If price retraces to fill imbalance partially and stalls, consider re-entry.

Gold Market Update – Tuesday Capitalist InsightGold market tapped into the 3380's supply zone, triggering a retracement toward the 3350's demand zone. This mitigation aims to set the tone for the next hedge formation, which will likely determine the next directional momentum.
🟡 Key Levels:
Supply: 3390's
Demand: 3350's
Next Bias Confirmation: Reaction from 3350 zone
🔁 Watch for:
A strong bounce from 3350's could confirm continuation of the bullish trajectory, while failure to hold may reopen bearish correction zones. Follow for more insights , comment and boost idea

Gold Trend Analysis August 7, 2025Market Overview
- Gold prices rose slightly in the first trading session of the week due to geopolitical concerns in the Middle East and weak US employment data
- However, selling pressure returned in the early morning today as the USD recovered and US bond yields rose slightly again
- The market is waiting for the speech of the Fed officials later today, which is expected to be hawkish
Factors that pressured gold down
- DXY index rose again, putting pressure on gold prices, which are priced in USD
- US 10-year bond yields increased
- FED said it was not in a hurry to cut interest rates
- Money flows shifted to stocks
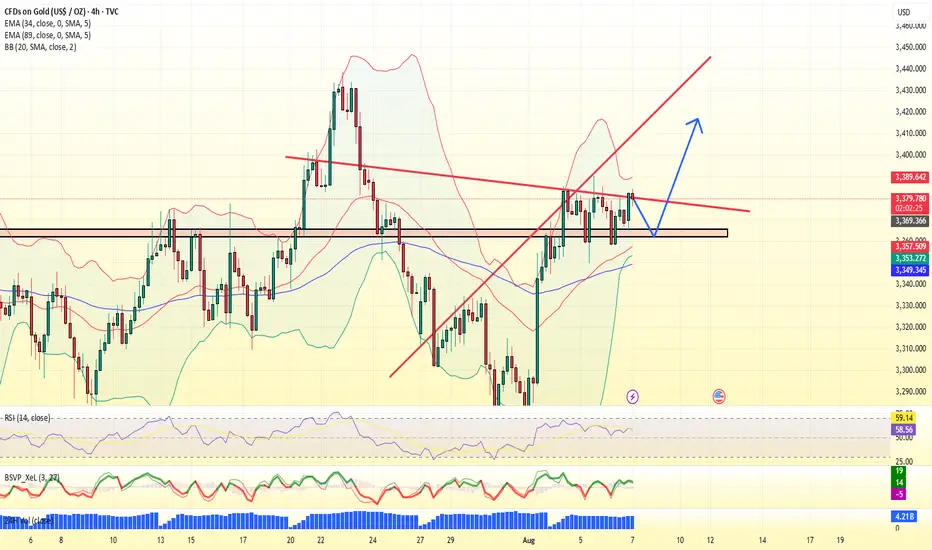

Gold Price Trend Analysis and Trading Guidance (Exclusive)📣📣📣A technical analysis of gold's recent performance reveals that it has formed a four-day winning streak, demonstrating the strength of the upward trend and indicating that short-term upside potential has not yet been exhausted. Of note, the upper Bollinger Band at 3430 on the daily chart is acting as a key resistance level, and this level is likely to be tested this week. However, when it comes to a sharp rise in the market, there is no clear signal at present. We need to wait for the opening pattern of the daily Bollinger band to be confirmed before we can open up a new round of upward space.🧐🧐🧐🤔🤔🤔
Switching to the H4 cycle for observation, the unilateral upward trend continues to consolidate, the moving average system shows a perfect upward divergent arrangement, the Bollinger Bands simultaneously maintain an open state, and a short-term high pressure is formed near the upper rail of 3415. Based on this, the bullish logic for gold remains unchanged on Wednesday, with the intraday high range likely to be between 3415 and 3430. There's no need to overestimate whether the price will break through previous highs at this point, and trading strategies should be adjusted dynamically based on real-time market performance. From a short-term perspective, intraday support should focus on two key levels: 3360 and 3350.
👊👊👊On the operational level, it is recommended to adopt a strategy of placing long orders in batches when the price falls back to the 3365-3360 range, relying on the support level to seize the opportunity of trend continuation.⭐️⭐️⭐️
⚠️⚠️⚠️The market is risky, so participate rationally. If you need real-time trading references and trading advice, please leave a message to Charlie.🛫🛫🛫 FOREXCOM:XAUUSD VELOCITY:GOLD PEPPERSTONE:XAUUSD CMCMARKETS:GOLD ICMARKETS:XAUUSD CMCMARKETS:GOLD FXOPEN:XAUUSD
Gold (XAU/USD) 4H Institutional Analysis — August 6, 2025As of August 6, 2025 (12:23 UTC), Gold (XAU/USD) is trading around 3,367.60, according to Kitco’s live spot price feed. After a sustained bullish recovery from the 3,320–3,330 demand zone, gold finds itself at a structural inflection point. Institutional footprints across the board — from order blocks to liquidity maps — are signaling one dominant message: the bulls are setting the stage.
In today’s breakdown, we deliver a high-conviction execution plan using a fusion of Smart Money Concepts (SMC), ICT methodology, and 4H structural dynamics — isolating only the strongest Primary Buy and Sell zones, along with their fallback counterparts. At the center of this framework is our Golden Zone, the most institutionally-aligned, high-probability area of the day.
🔍 Market Structure & Directional Bias
The 4-hour chart has shown a clear Change of Character (CHoCH) to the upside after a bullish Break of Structure (BOS) above the 3,355 level. This signals a phase shift from consolidation into accumulation and potential expansion, likely aiming toward the 3,400 psychological magnet and beyond.
The presence of volume imbalances, fair value gaps, and unmitigated order blocks across multiple structural layers further supports a bullish directional bias. Liquidity has been swept below previous equal lows (EQL), creating an environment ripe for institutional accumulation.
Directional Bias: Transitional → Bullish
🎯 Primary Execution Zones
✅ Primary Buy Zone (Golden Zone) — 3,355 to 3,360
This zone represents the highest-quality long opportunity on the chart today. Sitting in the discount array (below 50% of recent swing), the zone is built on a fresh Rally-Base-Rally (RBR) demand structure formed after a decisive CHoCH.
The 3,355–3,360 range aligns with a valid unmitigated Order Block, an embedded Fair Value Gap, and an OTE retracement between 0.705–0.79 Fib levels. Beneath this zone lies a sweepable liquidity pocket just under 3,350, further increasing the magnetism of the area.
Entry: 3,355–3,360
Stop Loss: Below 3,350 (liquidity invalidation)
Take Profits:
TP1: 3,395–3,400 (1.272 extension)
TP2: 3,420 (1.618 extension)
Confluences: RBR Demand, OB, FVG, OTE, Volume Imbalance, EQL Sweep, Discount Array, Structural Support
Kill Zone Timing: London-NY Overlap
✅ Golden Zone of the Day
✅ Primary Sell Zone — 3,395 to 3,400
While the broader bias is bullish, gold remains capped by a strong Drop-Base-Drop (DBD) supply zone around 3,400 — also the 1.272 fib extension from prior bullish legs. A pocket of equal highs (EQH) just above 3,405 serves as a liquidity magnet and stop-loss hunting zone — making this supply level extremely attractive for short-term reversion plays.
Entry: 3,395–3,400
Stop Loss: Above 3,405
Take Profits:
TP1: 3,360
TP2: 3,350
Confluences: DBD Supply, OB, FVG, OTE Retrace, EQH Sweep, Premium Array, Structural Resistance
⚠️ Secondary Execution Zones (If Primary Fails)
🟢 Fallback Buy Zone — 3,325 to 3,330
If the market manipulates lower and invalidates the primary buy zone with a deep liquidity sweep, this deeper zone offers a second chance. It contains a secondary demand block, a valid FVG, and lies cleanly within a deep discount retracement.
SL: Below 3,320
TPs: 3,360 and 3,380
🔴 Fallback Sell Zone — 3,445 to 3,450
If gold breaks cleanly above 3,405, likely invalidating the primary sell idea, the next institutional level of interest is 3,445–3,450 — sitting on a higher timeframe premium OB and major liquidity shelf.
SL: Above 3,455
TPs: 3,395 and 3,370
🌐 Institutional Consensus: Bullish Convergence
Institutional analysts across major platforms confirm a bullish bias, with targets hovering around the 3,400–3,420 area:
Reuters reports that gold is near a one-week high, supported by weaker U.S. data and increased rate-cut bets.
MarketPulse highlights the “return of the bulls” amid sustained momentum and light CPI expectations.
Citi has raised its medium-term gold target to $3,500, citing negative U.S. macro headwinds.
TradersUnion confirms support at 3,320 and resistance at 3,400 — mirroring our execution levels.
There is no significant divergence in sentiment or structure, validating today's trade zones with confidence.
📌 Final Thoughts
In a liquidity-driven market, price is engineered — not discovered. Today, that engineering points to one thing: 3,355–3,360 is the Golden Zone — the strongest execution area, supported by eight institutional confluences, favorable structure, and widespread sentiment confirmation.
Gold has re-entered its institutional kill-box. The next move? Likely engineered to deliver smart money profits while trapping the uninformed. Don’t chase price. Let it come to your zone. Execute with discipline.

Gold (XAU/USD) Technical Analysis:Gold is currently trading around $3,365, after a failed attempt to hold above resistance, suggesting further consolidation or potential downside.
🔹 Bearish Scenario:
If price breaks below $3,350 and holds, the decline may extend toward the $3,310 support area.
🔹 Bullish Scenario:
If price pushes back above $3,370 and holds, we may see an upside continuation toward $3,390, and possibly $3,430 if bullish momentum sustains.
⚠️ Disclaimer:
This analysis is not financial advice. It is recommended to monitor the markets and carefully analyze the data before making any investment decisions.

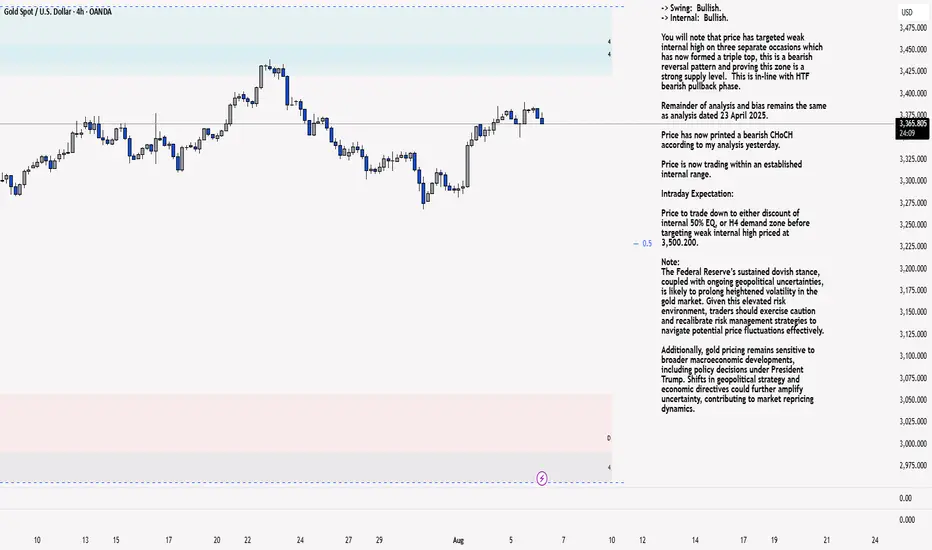
XAU/USD 06 August 2025 Intraday AnalysisH4 Analysis:
-> Swing: Bullish.
-> Internal: Bullish.
You will note that price has targeted weak internal high on three separate occasions which has now formed a triple top, this is a bearish reversal pattern and proving this zone is a strong supply level. This is in-line with HTF bearish pullback phase.
Remainder of analysis and bias remains the same as analysis dated 23 April 2025.
Price has now printed a bearish CHoCH according to my analysis yesterday.
Price is now trading within an established internal range.
Intraday Expectation:
Price to trade down to either discount of internal 50% EQ, or H4 demand zone before targeting weak internal high priced at 3,500.200.
Note:
The Federal Reserve’s sustained dovish stance, coupled with ongoing geopolitical uncertainties, is likely to prolong heightened volatility in the gold market. Given this elevated risk environment, traders should exercise caution and recalibrate risk management strategies to navigate potential price fluctuations effectively.
Additionally, gold pricing remains sensitive to broader macroeconomic developments, including policy decisions under President Trump. Shifts in geopolitical strategy and economic directives could further amplify uncertainty, contributing to market repricing dynamics.
H4 Chart:
M15 Analysis:
-> Swing: Bullish.
-> Internal: Bullish.
H4 Timeframe - Price has failed to target weak internal high, therefore, it would not be unrealistic if price printed a bearish iBOS.
The remainder of my analysis shall remain the same as analysis dated 13 June 2025, apart from target price.
As per my analysis dated 22 May 2025 whereby I mentioned price can be seen to be reacting at discount of 50% EQ on H4 timeframe, therefore, it is a viable alternative that price could potentially print a bullish iBOS on M15 timeframe despite internal structure being bearish.
Price has printed a bullish iBOS followed by a bearish CHoCH, which indicates, but does not confirm, bearish pullback phase initiation. I will however continue to monitor, with respect to depth of pullback.
Intraday Expectation:
Price to continue bearish, react at either M15 supply zone, or discount of 50% internal EQ before targeting weak internal high priced at 3,451.375.
Note:
Gold remains highly volatile amid the Federal Reserve's continued dovish stance, persistent and escalating geopolitical uncertainties. Traders should implement robust risk management strategies and remain vigilant, as price swings may become more pronounced in this elevated volatility environment.
Additionally, President Trump’s recent tariff announcements are expected to further amplify market turbulence, potentially triggering sharp price fluctuations and whipsaws.
M15 Chart:
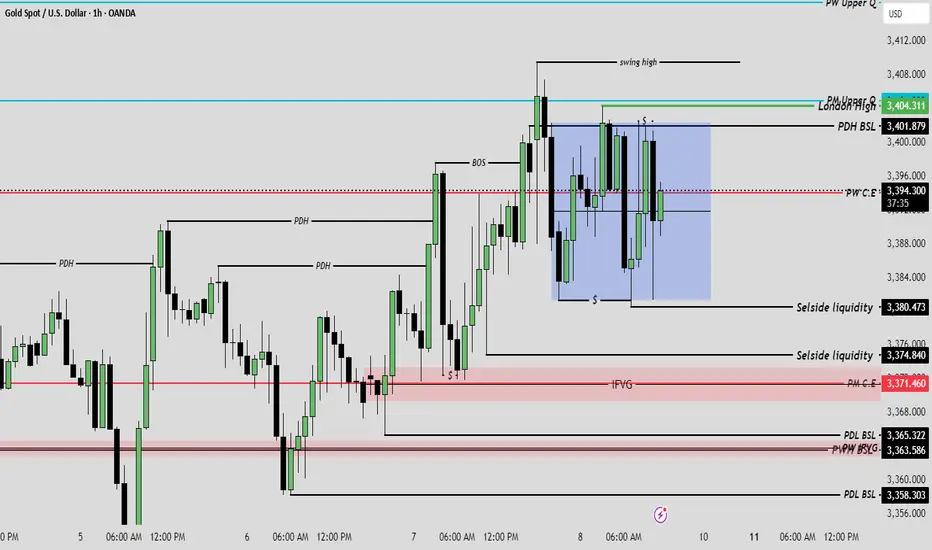
Gold h4 Based Setups Short Gold and Long analysis Market tapped above previous high (BSL + PDH Liquidity), then rejected → classic liquidity sweep
• Formed FVG + BPR zone (red box) and price consolidated below it
• You’re in a short trade targeting ~3365 (blue/green zone) where a new BPR + FVG block is formed (possible demand zone)
If price holds below 3383–3387 zone (FVG + BPR) and breaks 3375 support zone clearly
• We might see a drop toward:
• 3365 (1st TP – already marked)
• 3356–3352 (next demand & SSL area)
🟡 Bullish Rejection Possibility:
• If price reclaims 3387 with a strong candle close
• Then:
• Stops above 3388–3390 may get swept
• Upside potential = 3396–3402 (but less likely unless fundamentals support)
Golden Buying zone for Swing trade 3335-3330 zone
Second buy Golden Zone 3315-3318
Sl Below 3295 For Swing trader
Mange your Risk Alwayse use strick Stoploss
Happy Trading Best Of Luck
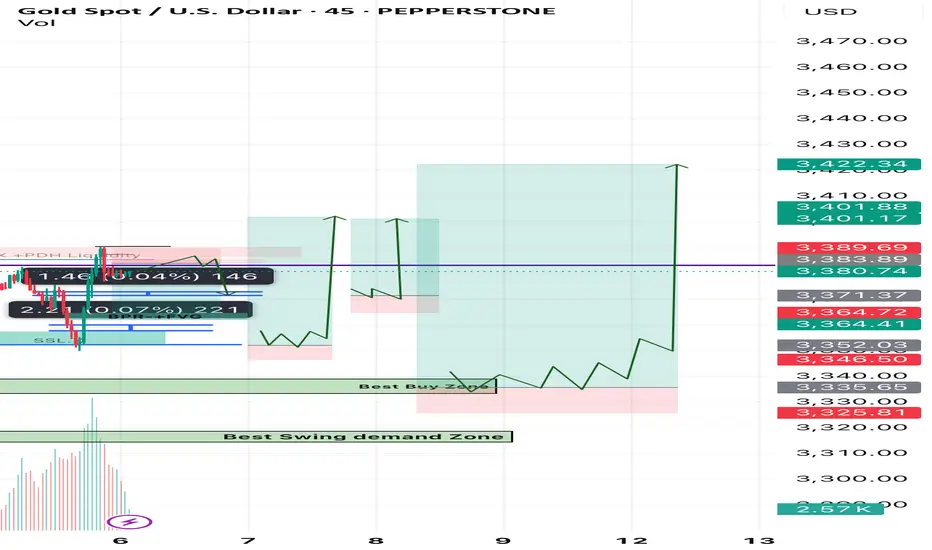
Gold- key technical analysis **key technical analysis**
### 📊 **1. Current Price & Trend**
* **Current Price:** **\$3,380.50**
* Price is **above the 50% Fibonacci level** (\$3,347.11) and **approaching 61.8% Fib** (\$3,371.15), a **key resistance level**.
* **Short-term uptrend** confirmed by price moving inside a rising **parallel channel** (light green zone).
* Candles show **bullish momentum** from late July.
---
### 📐 **2. Fibonacci Retracement Levels**
* **Key Support & Resistance Levels:**
* 🔼 **Resistance:**
* **61.8% Fib:** \$3,371.15 (currently being tested)
* **78.6% Fib:** \$3,405.38
* **100% Fib/Top:** \$3,448.98
* 🔽 **Support:**
* **50% Fib:** \$3,347.11
* **38.2% Fib:** \$3,323.07
* **23.6% Fib:** \$3,293.33
* **Bottom/0% Fib:** \$3,245.25
---
### 🔁 **3. Candlestick Pattern Observations**
* Series of **higher lows and higher highs**, classic uptrend formation.
* Recent candles show **strong bullish rejection from the lower channel**, suggesting buyers are in control.
---
### 🟩 **4. Channel Trend**
* Price is **respecting the ascending channel** boundaries well.
* Possible target near **upper channel line** (\~\$3,420–\$3,440) if breakout above 61.8% Fib sustains.
---
### 🌩️ **5. News/Event Marker**
* **Purple lightning bolt & US flag** indicate a **major U.S. economic event** (e.g., NFP, CPI, Fed announcement).
* Could cause **high volatility**, especially if price is near resistance.
---
### 🔍 **6. Summary / Strategic Levels**
| Level | Type | Action |
| ---------- | --------- | ---------------------------------- |
| \$3,448.98 | 100% Fib | **Major Resistance / Target** |
| \$3,405.38 | 78.6% Fib | Resistance |
| \$3,371.15 | 61.8% Fib | **Immediate Resistance** |
| \$3,347.11 | 50% Fib | **Key Support** (watch for retest) |
| \$3,323.07 | 38.2% Fib | Support |
| \$3,293.33 | 23.6% Fib | Lower Support |
| \$3,245.25 | 0% Fib | Strong Base / Last Support |
---
### 💡 **Trading Outlook**
* ✅ **Bullish Bias** above \$3,347, especially if price holds above 61.8%.
* ⚠️ Watch for breakout confirmation above \$3,405–\$3,448 for continuation.
* ❌ **Bearish reversal** if price breaks below \$3,347 and exits the rising channel.

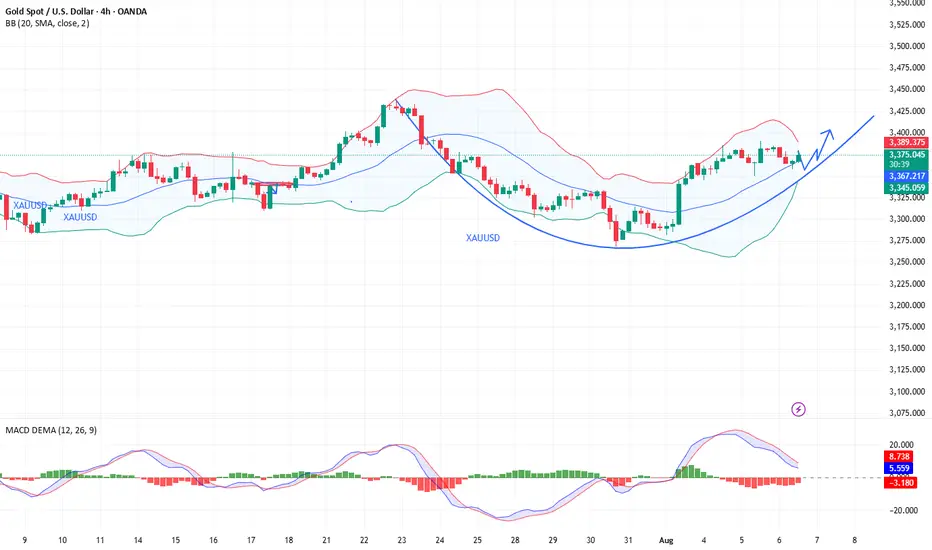
Gold rebounded near the key support level of $3,350.Spot gold edged higher during the US trading session after finding strong support near $3,350, reversing an earlier pullback. During the European trading session, gold prices briefly dipped due to improved risk appetite and a slight rise in US Treasury yields, failing to extend Monday's rebound. However, buyers stepped in near the 50-day simple moving average (SMA), pushing prices back from the day's low. The continued weakness of the US dollar, fueled by market confidence in a September Federal Reserve rate cut, supported gold's rebound.
Spot gold struggled to extend last week's rebound and is currently hovering around $3,350.
Last week, gold broke below an ascending triangle pattern, briefly hitting a one-month low, before finding support above the 100-day simple moving average (SMA), suggesting continued bearishness.
Currently, gold is trading slightly above the 50-day SMA, providing immediate support, followed by the 100-day SMA. Further declines could lead to targets near $3,275 and $3,200.
The Relative Strength Index (RSI) on the daily chart is in neutral territory around 55, indicating a lack of clear momentum. Meanwhile, the MACD indicator shows a golden cross with the DIFF crossing the DEA, and the MACD-histogram is positive, indicating accumulating bullish momentum. However, the overall reading is low, and further upward momentum is needed. A sustained golden cross and a larger candlestick pattern would be bullish.
On the upside, if bulls can reclaim the bottom of the broken triangle and decisively push above $3,380, the market could potentially move towards $3,450, or even revisit the all-time high. PEPPERSTONE:XAUUSD VELOCITY:GOLD FXOPEN:XAUUSD CMCMARKETS:GOLD VANTAGE:XAUUSD ACTIVTRADES:GOLD ACTIVTRADES:GOLD ICMARKETS:XAUUSD

BULLISH XAUUSD SETUPClean breakout setup with multiple confluences:
✅ Trendline Breakout (blue)
✅ 50 SMA Reclaim (yellow)
✅ Successful Retest (green circle)
✅ Momentum Push Through TP1, TP2
🔜 Approaching TP3, heading towards FINAL TP @ 3433.06
📌 This move was anticipated after structure shifted bullish with strong volume. As long as price holds above 3373.69, I'm maintaining a bullish bias.
🔔 Key Levels:
TP1: 3332.34 ✅
TP2: 3373.69 ✅
TP3: 3401.96
Final TP: 3433.06
Let’s see if the bulls have the strength to push all the way!

GOLD (XAUUSD) Wave analysis -Update 5/8/2025 GOLD (XAUUSD) Wave analysis -Update 5/8/2025
See the chart

Gold Consolidates at the Top, Bearish Reversal Ahead?On the 15-minute chart, XAUUSD is showing signs of exhaustion after a strong bullish impulse. Price is currently consolidating around the 3,370–3,375 resistance area, failing to make a clean breakout. Volume is fading, suggesting buyer momentum is weakening.
Technical Breakdown:
1. Market Structure:
Since late July, the market has formed a clear uptrend with higher highs and higher lows.
However, recent price action is showing indecision at the top, with multiple rejection wicks – indicating a potential short-term distribution phase.
2. Price Action & Supply-Demand Zones:
Demand Zone 1: Around 3,310–3,320 acted as the launchpad for the strong bullish breakout on August 2.
Demand Zone 2: Around 3,345–3,350 provided support for the next leg up.
Current Supply Zone: Between 3,375–3,380 – multiple rejections have been observed here.
3. Indicators Overview:
EMA20 & EMA50 (not shown but inferred): Upward sloping, but starting to flatten – signaling potential consolidation or bearish divergence.
RSI (likely above 70 earlier): Now showing signs of bearish divergence, supporting a possible short-term correction.
4. Fibonacci Retracement Analysis:
From the recent bullish swing (3,310 → 3,375), key retracement levels are:
0.382 → ~3,350
0.5 → ~3,342
0.618 → ~3,334
This confluence around the 3,334–3,342 range makes it a critical zone for a potential bullish bounce.
Suggested Trading Strategies
Scenario 1 – Scalping the Rejection (Counter-trend short):
Entry: SELL limit at 3,375–3,380
Stop Loss: 3,386
Take Profits:
TP1: 3,350 (Fibonacci 0.382)
TP2: 3,335 (Fibonacci 0.618 + previous support)
Scenario 2 – Trend Confirmation (Breakdown Play):
Setup: Sell if price breaks below 3,350 with volume confirmation.
Target Zones:
Initial target: 3,310 (prior demand zone)
Extended target: 3,280–3,265 (possible Wyckoff distribution breakdown)
Key Levels to Watch:
Significance: 3,380 - Resistance - Short-term supply zone
3,350: Support - Key Fibonacci 0.382 level
3,334: Support - Strong confluence zone (Fibo + demand)
3,310: Support - Bullish breakout base
Conclusion:
Gold is currently in a vulnerable position with signs of bullish exhaustion. Traders should stay patient and wait for confirmation before entering. Watch the 3,350–3,334 zone for reaction – it will likely decide the next directional move.
If you found this analysis helpful, make sure to follow for more updated strategies and save this post for future reference.

XAUUSD Intraday Signal Analysis – Gold Price Momentum & RSI SetuIn today’s 1-hour chart of XAUUSD (Gold vs USD), we observe a strong upward momentum supported by technical indicators, suggesting a well-defined bullish trend in the short term. Traders looking to capture short-term profits may find this chart setup especially favorable. Here's a breakdown of the price action and what it could mean for intraday traders.
Price Action Overview
The price of gold has surged past the $3,320 mark, showing a clear bullish breakout with a series of higher highs and higher lows. Currently, the market is trading near the $3,378 level, consolidating slightly after a strong upward movement.
The SMA 9 (Simple Moving Average) is providing dynamic support, curving upward and closely hugging the candlesticks. This is typically a sign that buyers are actively pushing the price higher and dips are being bought up quickly.
Additionally, the spread between the Buy ($3,378.78) and Sell ($3,378.51) prices is extremely narrow, suggesting tight liquidity and fast execution potential — ideal conditions for scalpers and short-term traders.
RSI Analysis
The RSI (Relative Strength Index) 14 is hovering around the 68–70 level, which traditionally indicates the asset is approaching overbought territory. However, it hasn’t crossed into the 70+ danger zone yet, which implies there could still be room for further upside.
One key observation is the RSI divergence forming on the right-hand side. While price has been climbing steadily, RSI has started to curve down slightly — this could hint at a minor pullback or consolidation phase before the next big move. Smart traders may consider watching for bullish RSI bounces or hidden divergences before re-entering long trades.
Trade Idea
Trend: Bullish
Support: $3,360 / $3,340
Resistance: $3,400 / $3,420
Signal: Wait for a minor pullback toward the SMA, and look for bullish candlestick confirmation near $3,360 before entering long.
Conclusion
This XAUUSD 1H chart presents a strong case for continued bullish momentum with cautious optimism due to RSI nearing overbought levels. A pullback could offer fresh entry opportunities before a push toward the next resistance zone. Intraday traders and swing traders alike can benefit from closely monitoring price action around the SMA 9 line.

XAU/USD(20250805) Today's AnalysisMarket News:
Goldman Sachs: We expect the Federal Reserve to cut interest rates by 25 basis points three times starting in September; if the unemployment rate rises further, a 50 basis point cut is possible.
Technical Analysis:
Today's Buy/Sell Levels:
3367
Support and Resistance Levels:
3407
3392
3383
3352
3342
3328
Trading Strategy:
If the stock breaks above 3383, consider buying, with the first target price at 3392. If the stock breaks below 3367, consider selling, with the first target price at 3352.

XAUUSD (Gold) Intraday Trading Plan – Tuesday, 5th August 2025Timeframe: M15 (15-Minute)
Strategy Type: Intraday Buy-the-Dip (Scalp-to-Swing)
Market Bias: Bullish
Risk Profile: Short-Term Scalping with Staggered Exits
Execution Style: Multi-phase, Wait-and-Trigger Confirmation Strategy
🧠 Technical Market Overview
Gold remains firmly in a short-term uptrend structure with consistent higher lows and strong buyer momentum since the start of the month. The Asian session on Tuesday is expected to be quieter, creating room for controlled retracements before London and New York bring in volume.
Price is currently trading above key moving averages on the M15 chart (50 EMA and 200 EMA), showing bullish continuation. With market structure respecting rising channel patterns and Fibonacci retracement levels holding well, the day presents a clear opportunity to execute a ladder-style buying plan.
🔍 M15 Intraday Execution Plan
✅ Phase 1: Buy on Retracement to 3366 (Entry Zone)
Entry Zone: Around 3366
Reasoning:
3366 aligns with the 38.2% Fibonacci retracement of the prior M15 leg
A well-established support zone from previous breakout base
Strong volume and wick rejection in this zone from prior session
Confirmation:
Bullish engulfing, pin bar, or strong momentum candle on M15
RSI (14) bouncing above 40
Price rejection from 3365–3367 zone
Stop Loss:
Below 3359 (well below intraday structure)
🎯 Target 1: 3377
Why:
Local resistance from earlier M15 swing highs
Also represents a round number + intraday liquidity zone
High probability zone for first exit or reaction
Action:
Take partial profits (~40%)
Move SL to breakeven or trail below 3369
Wait for market to pull back for re-entry
✅ Phase 2: Wait for Pullback (After 3377 is Hit)
Retracement Zone: 3371–3373 (new higher low formation)
Entry Trigger:
Price consolidates or forms a small flag pattern
Clear bullish momentum on candle breakout
🎯 Target 2: 3387
Why:
Next resistance level based on Monday’s NY session high
Also coincides with extended fib target (1.272 level of 3366–3377 move)
Action:
Secure additional 30% profit
Move SL to 3376
Wait for next consolidation for final trade setup
✅ Phase 3: Final Entry After Consolidation Near 3380–3383
Reasoning:
Micro-pullback to a newly established support before last wave
Continuation pattern or breakout flag expected to form
🎯 Target 3: 3397
Why:
Psychological zone near 3400, commonly tested by algo-driven spikes
Key intraday liquidity magnet where large exits usually occur
Also aligns with the upper edge of projected intraday trend channel
Action:
Close all remaining positions
Watch for reversal signal or potential breakout to plan next session
⚠️ Risk Management Plan
Max exposure: 1–1.5% of capital, split across multiple entries
Each entry must have independent SL and TP
Never average down; add only after successful TP1
Close full position if price breaks below 3359 and closes below 50 EMA on M15
🔁 Summary Table
Phase Buy Level Target SL Action
Phase 1 3366 3377 3359 Take 40%, trail SL
Phase 2 3371–3373 3387 3366 Take 30%, trail SL
Phase 3 3380–3383 3397 3376 Take 30%, full close
📊 Technical Indicators to Support Plan
EMA 50 & EMA 200: Trend direction and pullback support
RSI (14): Momentum confirmation (ideal entry RSI: 40–50 bounce)
Volume Profile: Entry zones should align with HVN (High Volume Nodes)
🧭 Intraday Session Awareness
Asian Session: Look for slow grind or pullback toward 3366
London Open (3pm SG time): Likely volatility spike toward 3377
New York Open (8:30pm SG time): Possible momentum to 3387 or 3397
Avoid Entry During News Spikes: Especially US economic data
