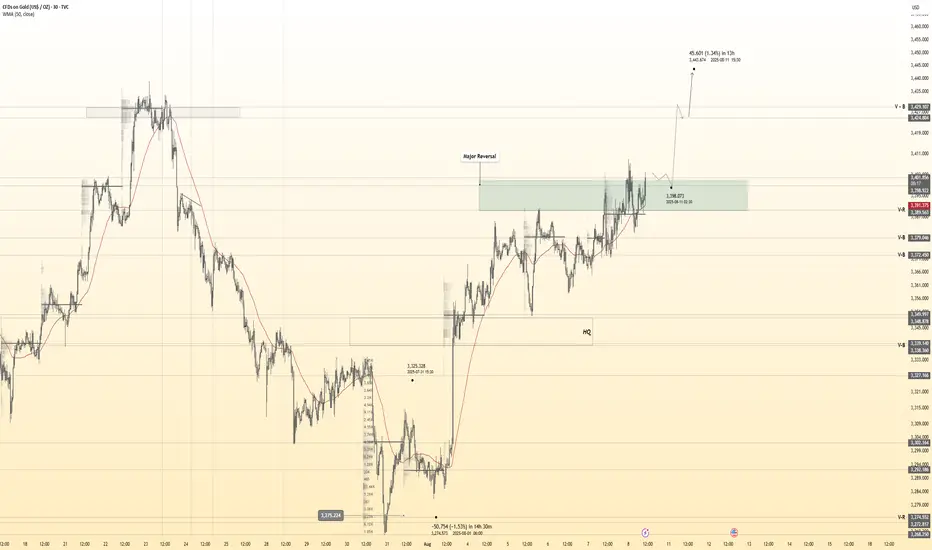
XAU/USD | Gold at Make-or-Break $3400! BUY or SHORT ? (READ)By analyzing the gold chart on the 4-hour timeframe, we can see that, as expected from the previous analysis, the price began to rise and gained over 250 pips, reaching the $3409 supply zone. Upon hitting this key level, gold faced selling pressure and dropped more than 290 pips down to $3380. When it returned to this important level, strong buying stepped in again, and it is now trading around $3391.
The total return from this analysis so far has been over 540 pips. If gold manages to hold above $3400, the next upside targets will be $3409, $3416, and $3419. Keep an eye on the $3419–$3434 zone for potential reactions. Show some strong support for this analysis, friends, and stay tuned for direct trade setups based on it!
THE Previous Analysis :
Best Regards , Arman Shaban
XAUUSD trade ideas

XAUUSD – Is This a Short-Term Top?1. What happened yesterday
After dipping to 3340 in early trading—just shy of the key 3335 support where I was looking to buy—Gold resumed its bullish momentum that began on Friday. During the New York session, price spiked to a new intraday high near 3385. However, the final hour brought a pullback, and since then, Gold has entered a tight consolidation range.
2. Key question: Is Gold forming a short-term top?
The 1H chart shows a new failed breakout attempt above 3380 during the Asian session. This left behind a minor double top, with the neckline sitting around 3370. That level is especially important—it aligns with a short-term rising trendline.
3. Why a correction might follow
• Price rejected above 3380 twice
• Small double top visible on LTF
• 3370 is a make-or-break level (neckline + trendline)
• A break below could trigger a correction of the +1000 pips rally from Friday’s lows
4. Trade plan
While there is some evidence of a potential top, this remains a high-risk and aggressive short.
Any attempt to trade against the trend should be done with tight stops and small size .
5. Final thoughts
A short-term top could indeed be in place, but Gold must break below 3370 to unlock deeper downside. Until then, the bulls are still in control—just taking a breather. ⚖️
Disclosure: I am part of TradeNation's Influencer program and receive a monthly fee for using their TradingView charts in my analyses and educational articles.

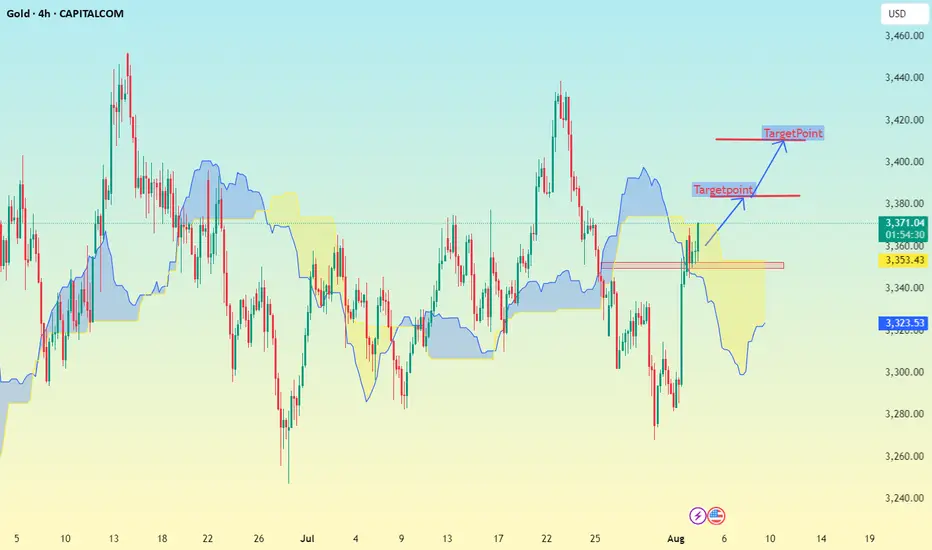
Gold 4H timeframe Based on the chart my shared (Gold 4H timeframe with Ichimoku cloud), here are the identified target points:
📈 Upside Targets:
1. First Target: 3380
This is marked just above the Ichimoku cloud breakout.
It is a short-term resistance zone.
2. Second Target: 3420
This is the higher target zone indicated in the chart.
It aligns with a previous high and potential resistance area.
---
🟡 Key Support:
Support Zone: Around 3322 – 3353
Price needs to hold above this zone to maintain the bullish momentum.
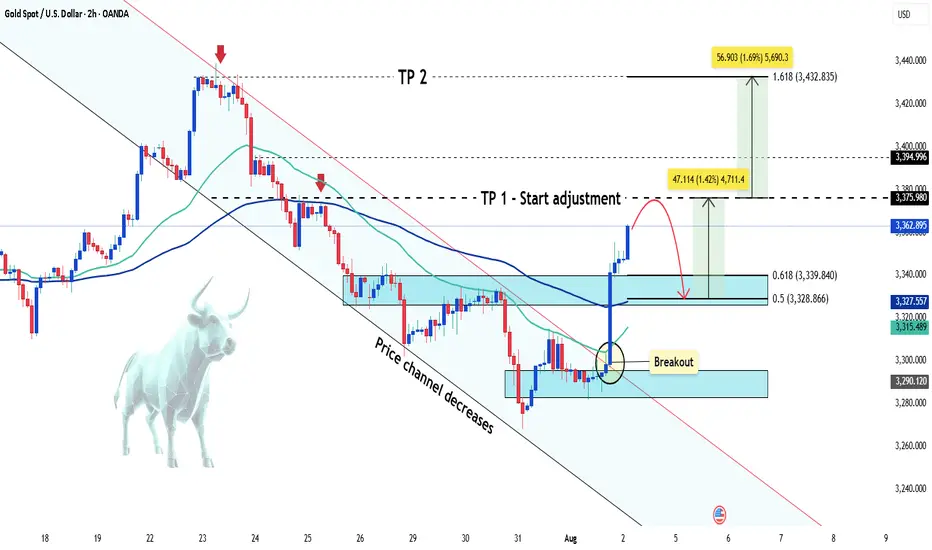
Gold suddenly increased sharply Hey everyone, let’s dive into what’s happening with XAUUSD!
Gold is experiencing a remarkable rally this weekend, skyrocketing from the $3,285 zone to around $3,362 — gaining over 700 pips. This sharp move comes amid weakening U.S. labor market data, which has fueled speculation that the Federal Reserve may begin cutting interest rates as early as September.
According to the U.S. Bureau of Labor Statistics (August 1st), non-farm payrolls rose by just 73,000 jobs in July — well below economists’ expectations of 106,000. The disappointing figures have shaken confidence in the U.S. economy and placed pressure on the U.S. dollar, as markets increasingly anticipate a dovish shift from the Fed.
For gold, this weak jobs report reinforces its role as a safe-haven asset, driving strong demand as investors seek protection from economic uncertainty. At the same time, lingering fears around global trade tensions and new tariffs imposed by President Donald Trump continue to support the flight to safety.
From a technical perspective, gold has broken out of its descending price channel and is moving fast. According to Dow Theory, a short-term correction may occur soon, but if price holds above key support levels, the rally could extend toward the $3,432 region — the 1.618 Fibonacci extension zone.
This move might mark the beginning of a new bullish phase after weeks of consolidation.
What do you think — is gold just getting started?
THE KOG REPORT - UpdateEnd of day update from us here at KOG:
Nice trade upside today from support which was shared yesterday. We managed to identify another set up on the indicators which performed well again on the long side but is not yet complete.
The bias levels given this morning have worked well at playing the range but we haven't managed to break above or below so unless scalping, we'll say wait for the break. End of the week tomorrow so lets hope we can breakout and make the move this wants to make.
Meanwhile, support 3370 and resistance 3395.
As always, trade safe.
KOG

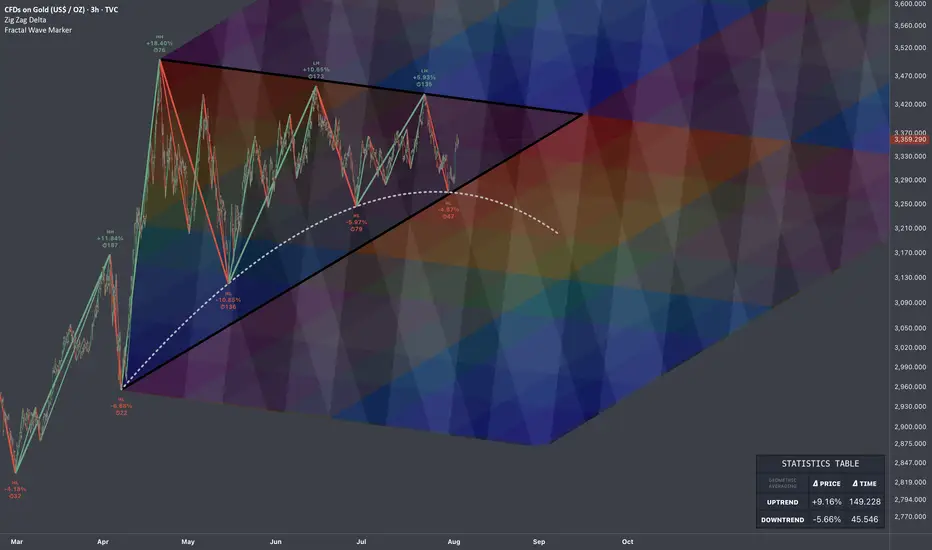
$GOLD: Projections of Compression & Release 🏛️ Research Notes
Price is at fib boundary derived from its structure that covers growth patterns. Several attempts were taken place to push higher and ended up as lower highs.
Contraction of fractal cycles and amplitude.
Topologically, the compression to a point of proportional release in fibonacci proportions and scaling law 1:1 to original triangle would look like a cube. And let's limit for now with that horizon.
Probabilistic Filter - Another layer of fibonacci channels to inherit roughness of observed temporal pattern which then rhymes with extended series.
The longer the price fluctuates in these geometric boundaries, the more accurate the colors tend to reflect the outcome.
For measuring percentages of swings I used this modification of Zig Zag.
Ready to BUY Gold to target 3445✏️ OANDA:XAUUSD confirms a continued uptrend as it breaks out of the triangle. The price is heading towards 3430 today and even higher at 3445. Today is Friday, the weekly candle close, and according to the range of the candle, it is possible to reach those highs. The BUY strategy can be activated at the moment and hold the position until the US session with the continuous US session buying pressure in recent days.
📉 Key Levels
Support: 3385-3365-3333
Resistance: 3419-3431-3445
Buy trigger: Confirmation of the h4 candle buying pressure above 3385
Buy trigger: Rejection of the support zone at 3365
Target 3445
Leave your comments on the idea. I am happy to read your views.

Gold Set to Reach Historic HighsHello everyone, great to see you again!
Gold has been on a strong upward trajectory, breaking previous bearish structures and showing solid growth momentum. Market sentiment is heavily supported by the weakening of global currencies, particularly the US dollar, and expectations surrounding the potential interest rate cuts by the Federal Reserve.
Looking at the technical picture, we are approaching the historic peak of $3,433. The gold market is showing significant strength, confirmed by EMA 34 and EMA 89, as well as new support zones, signaling a trend reversal and confirming the bullish outlook.
The next few trading sessions could play a critical role in confirming whether the precious metal can break the all-time highs.
What do you think? Is gold about to make history? Let me know in the comments below!

GOLD Struggles Near 3400 ResistanceGOLD Struggles Near 3400 Resistance
Gold is facing strong resistance around 3400, and the price is hesitating to take clear direction.
Although it looks like gold wants to move higher, selling pressure is holding it back. The price action is forming a wedge pattern, which typically signals a potential drop.
If this pattern plays out, gold could fall.
In my view, this bearish setup will only be invalidated by major market manipulation, because from a broader perspective, there’s no fresh technical or fundamental reason for gold to push higher despite that the bigger trend is bullish.
The real risk isn’t just technical or macro—it’s that gold remains one of the most manipulated assets in the market.
If the price breaks below the resistance zone shown on the chart, the chances of a deeper drop will increase.
Targets: 3350, 3330, and 3294
I'm still more focused on a bearish movement.
You may find more details in the chart!
Thank you and Good Luck!
PS: Please support with a like or comment if you find this analysis useful for your trading day

Gold 30Min Engaged ( Bullish Entry Detected )Time Frame: 30-Minute Warfare
Entry Protocol: Only after volume-verified breakout
🩸Bullish Movement From now price - 3401
➗ Hanzo Protocol: Volume-Tiered Entry Authority
➕ Zone Activated: Dynamic market pressure detected.
The level isn’t just price — it’s a memory of where they moved size.
Volume is rising beneath the surface — not noise, but preparation.
🔥 Tactical Note:
We wait for the energy signature — when volume betrays intention.
The trap gets set. The weak follow. We execute.
XAU/USD Buy Setup 1H Analysis Trendline breakout.Instrument: Gold Spot / USD
Timeframe: 1H (1 Hour)
Chart Tools Used:
Ichimoku Cloud
Trendline breakout
Target projection (highlighted in blue arrow and price levels)
Volume not shown directly but momentum is clear from breakout
---
💹 Buy Setup Analysis
✳ Current Price: $3,362.895
🔼 Entry (Buy): Around $3,363.590 (as marked on the chart)
🎯 Targets:
Target Number Price Level Approx Gain % Move
1st Target $3,393.481 ~$30 ~0.89%
2nd Target $3,433.864 ~$70 ~2.06%
🔻 Stop-Loss (Suggested): Below Ichimoku Cloud, ideally near $3,315.860 or $3,322.672
---
🧠 Strategy Logic
The chart shows a clean bullish breakout of the trendline and Ichimoku cloud.
Strong upward momentum candle confirms the breakout.
Targets are based on measured move and previous resistance zones.
Volume and sentiment look bullish, aligning with the breakout.
A pullback to the breakout zone (~$3,340–$3,350) would be healthy for re-entry.
---
📝 Summary of Buy Setup
Parameter Value
Entry $3,363.590
Target 1 $3,393.481
Target 2 $3,433.864
Stop-Loss $3,322.672–$3,315.860 (zone below cloud)
Risk-Reward ~2:1 to 3:1 based on SL/TP choice

GOLD: Be careful, It's More Complex Than it SeemsGOLD: Be careful, It's More Complex Than it Seems
After the NFP data came in at 73k vs. the expected 110k, the market reacted aggressively to the US dollar. Today, the US dollar was affected on two fronts.
One was the NFP data and the other was the mess that President Trump is creating with his tariffs against many countries. Uncertainty regarding the future impact of the tariffs remains high and unknown.
After the NFP data GOLD reacted aggressively against the US dollar by breaking easily two small structural areas towards 3315 and 3334. A possible correction is expected before gold moves further to 3370; 3400 and 3400, as shown in the chart.
You may find more details in the chart!
Thank you and Good Luck!
PS: Please support with a like or comment if you find this analysis useful for your trading day

Gold Continues Strong Bullish Move Hello everyone, wishing you a great trading day!
After a sharp decline from the recent highs, OANDA:XAUUSD quickly regained its strength and established a clear upward trend. The H4 chart shows the potential formation of a new upward trendline, with support positioned around the 3,350 USD zone.
This recent recovery is not just a technical bounce – it's supported by strong fundamental factors: weakening US bond yields, rising expectations that the Fed will cut interest rates in September, and a market sentiment that’s leaning towards safe-haven assets.
Currently, gold is trading around 3,380 USD and seems to be consolidating the momentum to approach the next resistance level at 3,433 USD. If the price holds above the new trendline and doesn’t break the marked support, the continuation of the upward trend is highly likely.
Personal view: The bullish trend remains intact – just a breakout confirmation and the 3,433 USD target will be within reach.
What do you think? Will gold continue its breakout this week? Leave your thoughts in the comments below!

Gold price maintains upward trend to 3400⭐️GOLDEN INFORMATION:
Gold (XAU/USD) edged lower during the North American session, pressured by rising U.S. Treasury yields, profit-taking, and reports that President Donald Trump may announce a replacement for Fed Governor Adriana Kugler later this year. The precious metal is trading around $3,372, down 0.23%.
After a three-day rally, bullion struggled to gain further traction as investors locked in profits. This came despite Trump signing an executive order imposing a 25% tariff on India in response to its continued imports of Russian oil. The new duties—set to take effect 21 days after August 7—will raise tariffs on select Indian exports to as much as 50%.
⭐️Personal comments NOVA:
Gold prices continue to increase, heading towards 3400. The context of trade tensions heats up again, along with increasing expectations of interest rate cuts.
⭐️SET UP GOLD PRICE:
🔥SELL GOLD zone: 3429- 3431 SL 3436
TP1: $3418
TP2: $3408
TP3: $3392
🔥BUY GOLD zone: $3332-$3330 SL $3325
TP1: $3342
TP2: $3355
TP3: $3368
⭐️Technical analysis:
Based on technical indicators EMA 34, EMA89 and support resistance areas to set up a reasonable BUY order.
⭐️NOTE:
Note: Nova wishes traders to manage their capital well
- take the number of lots that match your capital
- Takeprofit equal to 4-6% of capital account
- Stoplose equal to 2-3% of capital account

Gold Potential UpsidesHey Traders, in today's trading session we are monitoring XAUUSD for a buying opportunity around 3,360 zone, Gold is trading in an uptrend and currently is in a correction phase in which it is approaching the trend at 3,360 support and resistance area.
Trade safe, Joe.

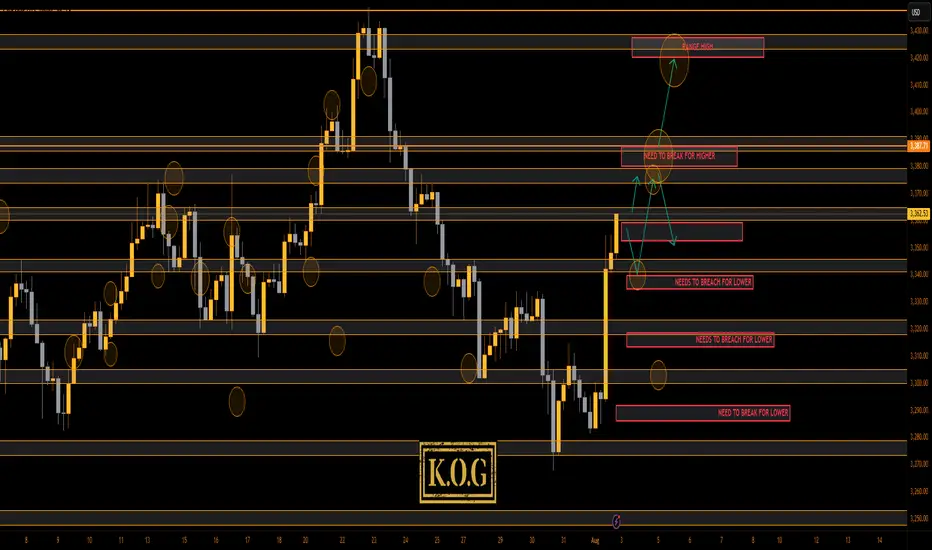
THE KOG REPORT THE KOG REPORT:
Due to there being no KOG Report last week so we won’t reference it, however, we did post the FOMC and NFP reports for the wider community to help them navigate the moves, which as you can see from the pinned ideas worked well.
So, what can we expect in the week ahead?
After the move we observed for NFP on Friday we would like to see some retracement in the sessions ahead. Looking at the 4H chart we have a reversal in play, but we still have no break out of this range! We’re simply playing the highs and the lows while price chops and whipsaws within it, which could be causing some new traders confusion and frustration.
We have a support level below 3350 and below that 3340 which will be the bias level for this week as bullish above. We then have the intra-day resistance level 3365-70 while there is an extension of the move into the 3385 level. Ideally, what we want to see here is support levels hold or a quick continuation on the open into the higher red box levels and the a potential for a RIP. That RIP however is most likely going to be a scalp unless we come down and break below that 3345-50 level.
We want to see how this reacts at these higher levels and if we do get a break of the boxes, otherwise, there is a chance we see another curveball like we suggested a couple of weeks ago, and we correct this whole move back downside with the first hurdle being 3340-35 on the flip.
We’re going to keep it simple here for now and usual we’ll update during the week once we have a clearer understanding of whether this wants to attempt a new all time high or not.
Please note, our liquidity indicator is suggesting a little higher but a pullback is on the way.
We’ll keep you updated.
KOG’s bias for the week:
Bullish above 3340 with targets above 3370, 3373, 3379 and above that 3384
Bearish on break of 3340 with targets below 3330, 3320 and below that 3310
RED BOXES:
Break above 3365 for 3372, 3375, 3379, 3384 and 3390 in extension of the move
Break below 3350 for 3346, 3340, 3335 and 3330 in extension of the move
Please do support us by hitting the like button, leaving a comment, and giving us a follow. We’ve been doing this for a long time now providing traders with in-depth free analysis on Gold, so your likes and comments are very much appreciated.
As always, trade safe.
KOG
Gold – Bulls Hold the Line, Pressure Builds for Upside BreakoutIn yesterday’s analysis, I argued that following Tuesday’s reversal — which printed a strong continuation bullish Pin Bar — buyers had regained control despite the intraday pullback.
For this reason, I suggested looking to buy dips, as the structure remained constructive.
And once again, during yesterday’s session, the scenario repeated itself.
The drop toward the 3360 zone was met with renewed buying interest, keeping the bullish structure intact.
________________________________________
🔍 Technical Context – Higher Lows Building Pressure
At the time of writing, Gold is trading around 3380, a short-term resistance area that has capped gains so far.
However, the technical picture remains bullish:
Starting with Monday’s low at 3340, which came after a strong impulsive leg up, price has printed a clear succession of higher lows.
This behavior strongly suggests increasing buying pressure and builds the case for a potential breakout to the upside.
________________________________________
🎯 Trading Bias – Holding My Long Position
My bias remains bullish.
In fact, I’m currently holding a long position, entered yesterday, which is now running with a 150 pips unrealized profit.
I’m sticking with the trade, anticipating that a confirmed break above 3380–3390 could trigger upside acceleration toward my final target — a 750 pips profit objective.
________________________________________
🔄 What to Watch Next
• Daily close: A close above 3380=3385 zone would add confirmation to the bullish thesis.
• Key support: The zone around 3360 is now support.
• Breakout trigger: A move above 3380–3385 could unleash momentum buying and open the path to higher levels.
________________________________________
Let’s stay patient and let the market confirm the breakout.
Until then, the structure favors the bulls. 🚀
Disclosure: I am part of TradeNation's Influencer program and receive a monthly fee for using their TradingView charts in my analyses and educational articles.

#XAUUSD: Gold is likely to create a record highGold will be bullish since the US and Russia tension rises, creating uncertainty within the global investors. As of now gold rejected nicely due to negative NFP data affected the US Dollar. We have now two strong fundamentals views that is supporting our view. Please use accurate risk management while trading gold.
Good luck and trade safe. Please like and share for more
Team Setupsfx

Only look for BUY signal points in the current trend of Gold✏️The D1 candle closed with strong bullish force at the end of the day. The gold trend is still increasing wave 3 and there is no sign of correction. The reaction around 3385 in the Asian session this morning is being awaited to see if it is a recovery of Gold or not. The BUY strategy at important support zones is still maintained and pay attention to the price reaction of the candle.
📉 Key Levels
Support 3363-3346-3332
Resistance 3385 - 3407
Buy trigger: Confirmation of buying candle at support zones 3363-3346-3333
Target: 3400.00

GOLD Breakout Done , Long Setup Valid To Get 150 Pips !Here is My 15 Mins Gold Chart , and here is my opinion , we finally above 3384.00 and we have a 30 Mins Candle closure above it And Perfect Breakout , so we have a good confirmation now to can buy it and we can targeting 100 to 150 pips .
Reasons To Enter :
1- New Support Created .
2- Bullish Price Action .
3- Bigger T.F Giving Good Bullish P.A .
4- Clean Breakout .

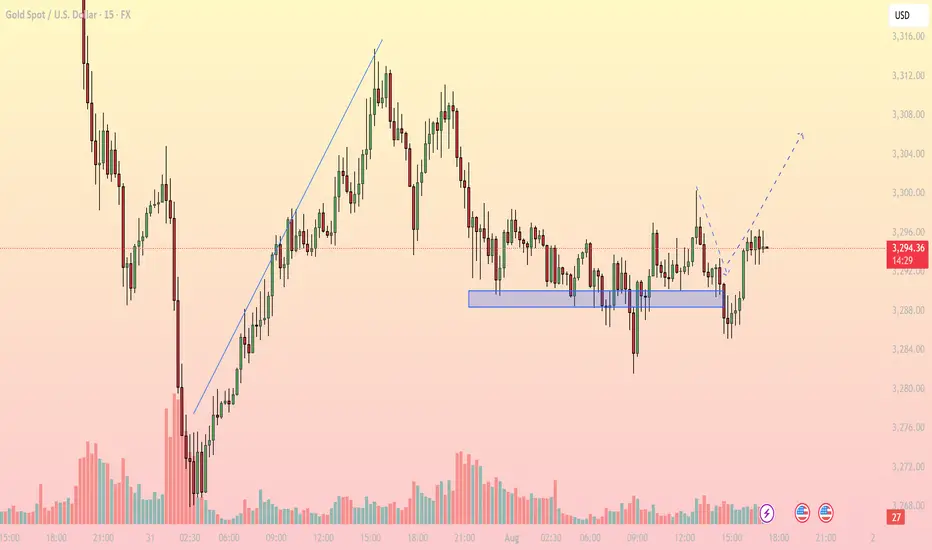
Bullish Rejection from Support, Upside in FocusMarket Overview: On the M15 timeframe, XAUUSD shows signs of a short-term bullish reversal after a prolonged sideways range around the key support zone of 3,286 – 3,289 USD. Price faked out below this support but quickly recovered, forming a V-shape reversal, suggesting strong buying interest has returned.
Key Levels to Watch:
Support Zones:
- 3,286 – 3,289: Strong intraday support, tested multiple times with sharp rejections
- 3,274: Next significant support if the above zone fails
Resistance Zones:
- 3,300 – 3,304: First resistance target aligned with the recent high
- 3,308 – 3,312: Higher resistance area where supply may emerge
Technical Indicators:
EMA: Price has reclaimed the short-term EMAs, indicating bullish momentum on lower timeframes
RSI: Rising above 50 but not yet overbought – there’s room for further upside
Volume: Increasing volume during the bounce confirms buying strength
Trading Strategy:
- Bullish Scenario (Preferred): Entry Zone: Watch for pullback toward 3,290 – 3,292
Stop Loss: Below 3,285
Take Profit 1: 3,300
Take Profit 2: 3,304
Extended Target: 3,308 – 3,312 (if bullish momentum continues beyond breakout zone)
- Bearish Scenario (Alternate): Only valid if price breaks and closes strongly below 3,286
Short Target: 3,274 – 3,270
Note: Counter-trend strategy – higher risk, requires strong confirmation
Conclusion: Gold is showing a bullish price structure on the 15-minute chart. As long as price holds above the 3,286 – 3,289 support zone, the path of least resistance appears to be upward, with 3,300 and 3,304 as the next logical targets. Monitor price action closely during the U.S. session for a potential long setup.
- Follow for more real-time gold trading strategies and save this idea if you find it helpful!
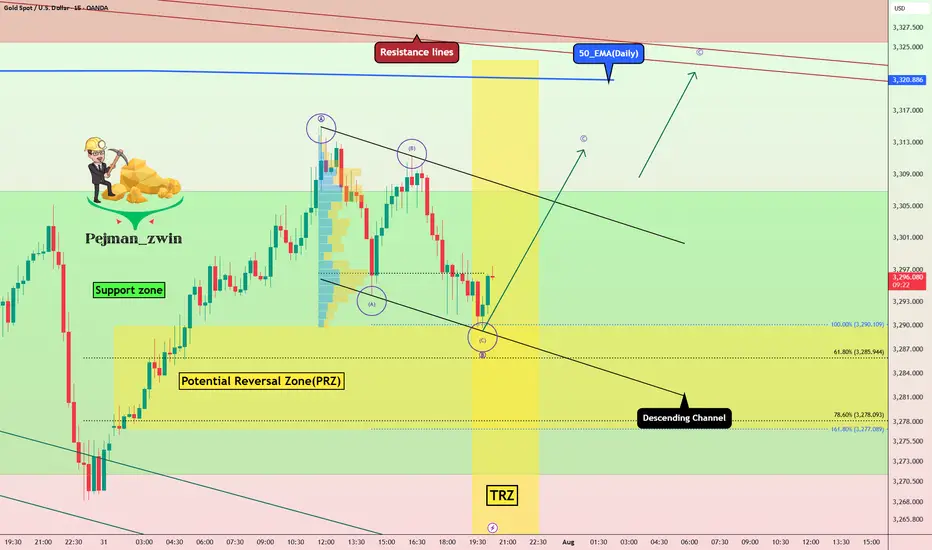
Gold in PRZ + TRZ: Is a Bullish Reversal Brewing(Short-term)?Gold , as I expected in yesterday's idea , fell to the Potential Reversal Zone(PRZ) and started to rise again .
Today's Gold analysis is on the 15-minute time frame and is considered short-term , so please pay attention .
Gold is currently trading in the Support zone($3,307-$3,275) and near the Potential Reversal Zone(PRZ) and Time Reversal Zone(TRZ) .
In terms of Elliott Wave theory , it seems that Gold can complete the microwave C of wave B at the lower line of the descending channel.
I expect Gold to trend higher in the coming hours and rise to at least $3,311 .
Note: Stop Loss (SL) = $3,267
Gold Analyze (XAUUSD), 15-minute time frame.
Be sure to follow the updated ideas.
Do not forget to put a Stop loss for your positions (For every position you want to open).
Please follow your strategy; this is just my idea, and I will gladly see your ideas in this post.
Please do not forget the ✅ ' like ' ✅ button 🙏😊 & Share it with your friends; thanks, and Trade safe.
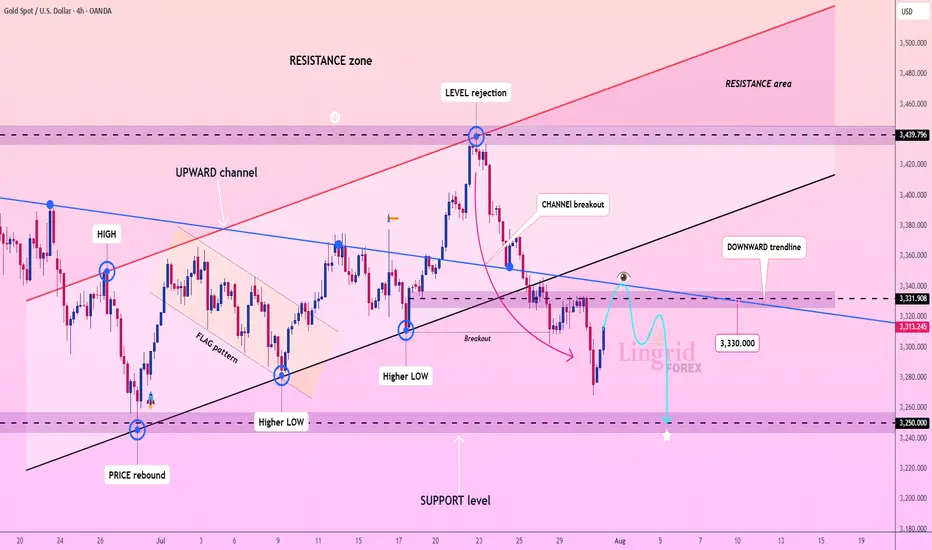
Lingrid | GOLD Possible Retest of the Major Support ZoneThe price perfectly fulfilled my previous idea . OANDA:XAUUSD is bouncing from recent lows but remains under pressure below the key resistance at 3,331.90 and the downward trendline. The prior rejection near 3,440 led to a steep selloff with a clean break below the upward channel. Current action shows a potential lower high forming near the broken trendline. A rejection there could send gold tumbling toward the 3,250.00 support zone.
📌 Key Levels
Sell trigger: Failure to reclaim 3,331.90
Sell zone: 3,330 – 3,340
Target: 3,250.00
Invalidation: Strong bullish breakout above 3,340 and descending trendline
💡 Risks
Bullish reversal breaking above downward trendline
Dovish Fed news boosting gold
Unexpected macroeconomic shocks increasing safe-haven demand
If this idea resonates with you or you have your own opinion, traders, hit the comments. I’m excited to read your thoughts!