XAUUSD:BUYThere is no need to worry about holding long orders mentioned last Friday. Gold prices continued to rise this week after a pullback. The price has risen to 3372. According to the research team of our swing trading analysis team, the bullish trend will continue.
Earlier I informed members that some buy orders were closed at high levels. At that time, the short-term high was around 3370. After closing the long orders, the price subsequently fell. This is the advantage of swing trading. You can use accurate trading signals to trade in batches in the short term, thereby creating opportunities for quick profits.
After the pullback, there is still good room for buying and opportunities.
XAUUSD trade ideas

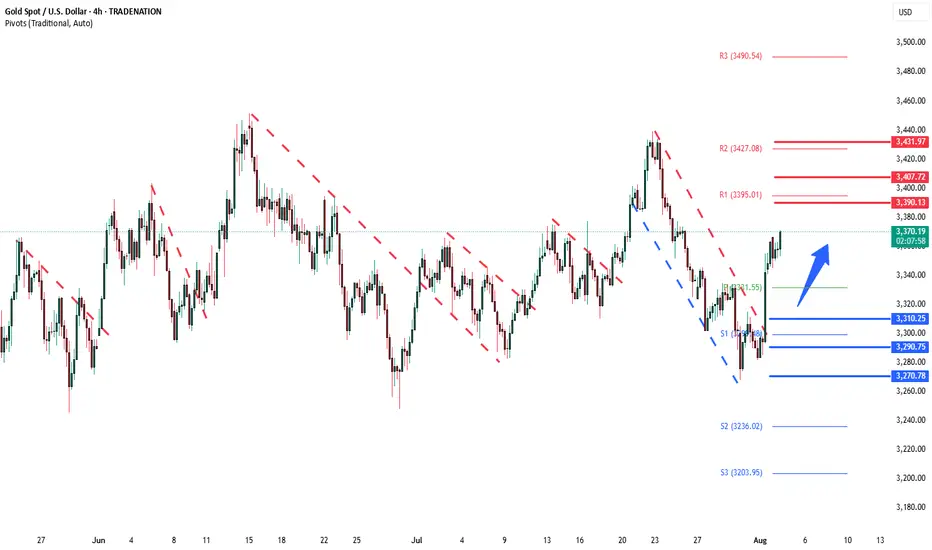
Gold bullish breakout supported at 3308The Gold remains in a bullish trend, with recent price action showing signs of a continuation breakout within the broader uptrend.
Support Zone: 3308 – a key level from previous consolidation. Price is currently testing or approaching this level.
A bullish rebound from 3308 would confirm ongoing upside momentum, with potential targets at:
3387 – initial resistance
3400 – psychological and structural level
3435 – extended resistance on the longer-term chart
Bearish Scenario:
A confirmed break and daily close below 3308 would weaken the bullish outlook and suggest deeper downside risk toward:
3290 – minor support
3268 – stronger support and potential demand zone
Outlook:
Bullish bias remains intact while the Gold holds above 3308. A sustained break below this level could shift momentum to the downside in the short term.
This communication is for informational purposes only and should not be viewed as any form of recommendation as to a particular course of action or as investment advice. It is not intended as an offer or solicitation for the purchase or sale of any financial instrument or as an official confirmation of any transaction. Opinions, estimates and assumptions expressed herein are made as of the date of this communication and are subject to change without notice. This communication has been prepared based upon information, including market prices, data and other information, believed to be reliable; however, Trade Nation does not warrant its completeness or accuracy. All market prices and market data contained in or attached to this communication are indicative and subject to change without notice.
xau longnews on the tariff on swiss last friday, should still have a up ward movement.
wait for retest to enter this.
expecting bull flag strat, if triple top, exit the trade. or sl be
been very busy lately, also doing well with our copy trading, we also launched a smart plan copytrading service.
we have partnered with Blackbull markets to give the best spreads of roundtrip 5.5 usd.
see profile to get updated.

Gold: market is concerned, againThe previous week brought a bunch of important US macroeconomic data as well as the FOMC meeting, which all brought back some higher volatility on markets. The price of gold benefited from the uncertainties related to future economic developments under implemented trade tariffs, which have started to modestly reflect on the US economic data. The surprise came in jobs data on Friday, where non-farm payrolls added only 73K new jobs in July, which was significantly below expected 110K.
During the first half of the week, the price of gold was traded in a corrective way, reaching its lowest weekly level at $3.267. Still, Friday's surprising NFP data pushed the gold 2% higher, back to the level of $3.362, where the gold is closing the week. The RSI was pushed below the level of 50 during the first half of the week, however, the indicator ended the week at the level of 53. The MA50 slowed down its divergence from MA200, but the distance between the two lines is still high, in which sense, there is no indication of a potential cross.
In a week ahead there are no important US economic data scheduled for a release, in which sense, it could be expected that the market will use this time to fully reflect data from the previous week. Also, some short corrections in the price of gold are possible, which is usually after a strong shift toward one side. Some profit-takings could push the price of gold back toward the $3.320. The support line at $3,3K might also be shortly tested, but with lower probability. On the other hand, there is also probability for further push toward the upside, depending on investors’ perceptions of the future risks. It should not be overseen that currently the highest risks are coming from trade-tariff negotiations and settled deals. Any negative news regarding trade tariffs might easily push the price of gold higher from current levels.


Gold Holds the Trendline - Eyes on the Range HighGold remains range-bound but is climbing off the range low with strong bullish momentum. Price is respecting the trendline and could stage a move toward the top of the range. A minor pullback may offer the best entry opportunity before momentum takes it higher. This setup favors buying the dip as long as the trendline holds.

Gold analysis and trading strategy for Monday✅ Fundamental Analysis
Friday’s Non-Farm Payrolls (NFP) data came in significantly below expectations, with new job additions falling far short of market forecasts. This sparked a sharp rise in expectations for a Fed rate cut later this year. As a result, the U.S. dollar index declined and gold prices surged violently, rallying from the 3281 level to a high of 3362 — a single-day gain of over $85, completely erasing the week's prior losses and reestablishing a strong bullish structure.
✅ Technical Analysis
📊 Weekly Chart
Gold posted a strong bullish weekly candlestick, reversing the previous consolidation trend and signaling a structural shift in market sentiment. Bulls have regained full control. The key resistance zone lies between 3380–3400; if price breaks and holds above this level, the next upside target will be around 3430.
📊 Daily Chart
Gold stabilized at the 3281 low and surged on Friday evening following the NFP surprise, closing near the day’s high — a sign of aggressive buying. The short-term trend has clearly reversed to the upside, and any pullback is now considered a buying opportunity. The key support has moved up to around 3335, serving as a critical pivot zone. Further support is seen near 3316, a previous swing low.
📊 Hourly Chart
Price is currently trading above short-term moving averages, indicating a strong bullish bias. The key level for a potential bullish continuation is around 3355, which represents a recent support-turned-resistance area. If price pulls back to this level and holds, or breaks above it directly, it will confirm bullish strength. If gold opens with a gap higher toward 3385, beware of potential short-term volatility due to a liquidity gap. Chasing highs in such scenarios requires caution.
🔴 Resistance Levels: 3375–3380 / 3400–3430
🟢 Support Levels: 3355–3340 / 3330–3335 / 3316
✅ Trading Strategy Reference
🔺 Primary Strategy – Buy on Dips:
🔰Consider long entries around 3340–3335, with a stop-loss below 3328.
🔰If the market remains strong, a direct long near 3355 is viable, targeting 3375 and above.
🔰A deeper pullback to 3330–3335 is a favorable entry zone for mid-term longs.
🔻 Secondary Strategy – Sell on Rebounds (Short-Term Only):
🔰If gold opens Monday with a sharp spike to around 3385 but fails to break higher, a light short position may be considered, targeting a quick $10–$15 pullback.
🔰If 3385 is broken and held, abandon short setups and revert to a bullish view.
✅ Overall Outlook
Gold has completed a technical reversal following the bullish fundamental catalyst from the NFP data. The trend has shifted from bearish to bullish, and the market has clearly moved into a higher price range. The core trading logic should remain “buy on dips”, and countertrend trades should be approached with caution. Look for long opportunities near key support levels, and consider short positions only at major resistance levels and for quick intraday trades. A confirmed breakout above 3375 will likely open the door to 3400–3430 in the near term

Gold looks like still having Bullish Momentum Based on current situation, XAUUSD looks like still having bullish momentum. looks at momentum candle, it like give early signal of next pole movement.
I just labelled two significant zone that I think, it is possible to create an edge. Even though, just wait for price action.

Gold Trade Plan 31/07/2025Dear Traders,
3304-3307 is very important area for Gold,
Pay close attention to the 3303-3307 zone. If you see a rejection in this area, you can enter a sell position.
if Fix above 3305------> 3351
IF Fix below 3305----->3267 (again)
Regards,
Alireza

Gold in the strong bullish momentum.WE will be expecting gold to con tinue its climb as NFP.
A sudden rejection is seen on 1st of Aug a good strong sign of bull coming in.
point is where to trade.
i personally expect for a pullback and point of interest for me for now nearest will be 3345 next 3330 lastly 3310-14.
where can we expect gold to climb up to.
first pitstop will be 3391-3403 and next 3465-87.
all the best traders.

Gold (XAU/USD) in Symmetrical Triangle – Short‑Term Squeeze,Price Structure & Technical Setup
Gold is consolidating within a symmetrical triangle, showing lower highs and higher lows—a classic precursor to breakout in either direction
Fxglory Ltd
+5
TradingView
+5
Babypips.com
+5
TradingView
+2
Babypips.com
+2
TradingView
+2
.
Trendlines converge tightly around $3,326–$3,334, hinting at imminent directional acceleration
Investopedia
+4
TradingView
+4
TradingView
+4
.
🎯 Key Levels & Targets
Scenario Trigger Confirm Area Targets Stop Loss
Bullish Breakout above $3,344–$3,350 $3,369 → $3,396 → $3,422–$3,550 ~$3,340
Bearish Breakdown below ~$3,326–$3,320 $3,320 → $3,300 → $3,297 → $3,255 ~$3,335–$3,340
A breakout above $3,344–$3,350 validated with volume may drive prices toward $3,400+, with extended targets up to $3,550 or higher in bullish conditions
Traders Union
Time Price Research
.
A drop below $3,326–$3,320 risks further decline, targeting $3,300, $3,297, and eventually $3,255 if breakdown momentum builds .
📉 Market Context & Drivers
U.S. dollar strength, easing safe-haven demand, and optimistic trade sentiment are constraining gold’s upside unless breakout forces emerge .
Key upcoming catalysts: FOMC guidance, U.S. macro data (GDP, inflation), and geopolitical developments—their tone could tip the bias direction .
⚙️ Trade Rules & Risk Management
Wait for a confirmed breakout or breakdown—do not trade mid-range.
Confirm break with at least one close outside the triangle and rising volume .
Position sizing: Risk 1–2% per trade, adjust stop-loss to price structure ($8–$15 depending on volatility).
Take profits in stages: scale out at minor milestones (first targets), trail stop for extended targets.
Avoid chasing price within the middle of the triangle—risk/reward is unfavorable.
🧠 Why This Plan?
Follows textbook symmetrical triangle trading methodology: entry on breakout, stop beyond pattern opposite side, projection based on triangle height .
Aligns with broader outlook: bearish unless convincing upside breakout appears, consistent with analyst consensus hedging current bull exhaustion and wait‑and‑see on policy signals .
✅ Summary
Gold is coiling inside a tight triangle range near $3,326–$3,334, with breakout potential identified to either side:
Bullish breakout over $3,344–$3,350 targets up to $3,550 or beyond.
Bearish breakdown under $3,326–$3,320 risks slide towards $3,300–$3,255.
Wait for confirmation, apply disciplined risk controls, and let volume validate the move.

short sharinghow and what to expect and where to trade
gold is ranging between 3400-3380.
break either would be a good ride to trade.

Gold Spot (XAU/USD) Analysis – 30-Minute TimeframeGold Spot (XAU/USD) Analysis – 30-Minute Timeframe
At present, the price is fluctuating within a range between a key support zone and a key resistance zone. The overall market structure has taken on a ranging pattern, and traders are waiting for a breakout from either side.
🔹 Bullish Scenario: A breakout and consolidation above the current resistance could lead to a move toward higher resistance levels and eventually the main supply zone.
🔹 Bearish Scenario: A breakout and consolidation below the mid-range support could trigger a decline toward lower support levels and even a retest of recent lows.
Given the current situation, the price reaction to these zones will likely determine the next market direction.

GOLD: Move Down Expected! Short!
My dear friends,
Today we will analyse GOLD together☺️
The price is near a wide key level
and the pair is approaching a significant decision level of 3,392.87 Therefore, a strong bearish reaction here could determine the next move down.We will watch for a confirmation candle, and then target the next key level of 3,383.49.Recommend Stop-loss is beyond the current level.
❤️Sending you lots of Love and Hugs❤️

XAUUSD POSSIBLE DROP IN PRICEGold is reacting at the 3400 psychological level. I anticipate a drop in price from that level coupled with the recent tariff that trump imposed on gold bar. A sell opportunity is envisaged from the current market price

XAUUSD Gold Trading Strategy August 8, 2025XAUUSD Gold Trading Strategy August 8, 2025:
Gold prices have approached the 340x area and have fallen sharply to the 338x support area at the beginning of today's trading session.
Basic news: President Trump announced to double tariffs on Indian goods to 50% in response to continued oil imports from Russia. Reports show that Trump may meet with Russian President Vladimir Putin as early as next week.
Technical analysis: Gold prices are currently in an uptrend channel, but the trading range is showing signs of narrowing. The possibility that the price will correct at this 340x area is very high; if the gold price creates a double peak pattern in the H1 frame, the price range of 3375 - 3380 will confirm the pattern and create a strong downward force for the gold price. If gold forms a double top pattern here, this correction could take gold to the 3350 or even 3330 area.
Important price zones today: 3375 - 3380, 3405 - 3410 and 3420 - 3425.
Today's trading trend: SELL.
Recommended orders:
Plan 1: SELL XAUUSD zone 3407 - 3409
SL 3412
TP 3404 - 3394 - 3374 - 3354.
Plan 2: SELL XAUUSD zone 3423 - 3425
SL 3428
TP 3420 - 3410 - 3390 - 3370.
Plan 3: BUY XAUUSD zone 3375 - 3377
SL 3372
TP 3380 - 3390 - 3400.
Wish you a safe, successful and profitable trading weekend.🌟🌟🌟🌟🌟

XAU/USD 08 August 2025 Intraday AnalysisH4 analysis:
-> Swing: Bullish.
-> Internal: Bullish.
You will note that price has targeted weak internal high on three separate occasions which has now formed a triple top, this is a bearish reversal pattern and proving this zone is a strong supply level. This is in-line with HTF bearish pullback phase.
Remainder of analysis and bias remains the same as analysis dated 23 April 2025.
Price has now printed a bearish CHoCH according to my analysis yesterday.
Price is now trading within an established internal range.
Intraday Expectation:
Price to trade down to either discount of internal 50% EQ, or H4 demand zone before targeting weak internal high priced at 3,500.200.
Note:
The Federal Reserve’s sustained dovish stance, coupled with ongoing geopolitical uncertainties, is likely to prolong heightened volatility in the gold market. Given this elevated risk environment, traders should exercise caution and recalibrate risk management strategies to navigate potential price fluctuations effectively.
Additionally, gold pricing remains sensitive to broader macroeconomic developments, including policy decisions under President Trump. Shifts in geopolitical strategy and economic directives could further amplify uncertainty, contributing to market repricing dynamics.
H4 Chart:
M15 Analysis:
-> Swing: Bullish.
-> Internal: Bullish.
H4 Timeframe - Price has failed to target weak internal high, therefore, it would not be unrealistic if price printed a bearish iBOS.
The remainder of my analysis shall remain the same as analysis dated 13 June 2025, apart from target price.
As per my analysis dated 22 May 2025 whereby I mentioned price can be seen to be reacting at discount of 50% EQ on H4 timeframe, therefore, it is a viable alternative that price could potentially print a bullish iBOS on M15 timeframe despite internal structure being bearish.
Price has printed a bullish iBOS followed by a bearish CHoCH, which indicates, but does not confirm, bearish pullback phase initiation. I will however continue to monitor, with respect to depth of pullback.
Intraday Expectation:
Price to continue bearish, react at either M15 supply zone, or discount of 50% internal EQ before targeting weak internal high priced at 3,451.375.
Note:
Gold remains highly volatile amid the Federal Reserve's continued dovish stance, persistent and escalating geopolitical uncertainties. Traders should implement robust risk management strategies and remain vigilant, as price swings may become more pronounced in this elevated volatility environment.
Additionally, President Trump’s recent tariff announcements are expected to further amplify market turbulence, potentially triggering sharp price fluctuations and whipsaws.
M15 Chart:

Gold is aiming at 3,440.00.Gold is aiming at 3,440.00.
Gold’s upward trend is poised to continue, driven by potential Federal Reserve rate cuts, ongoing central bank purchases, and increased ETF investments. Markets are betting on a 93% chance of a rate cut at the Fed’s next meeting. Central banks added 166 tons to global gold reserves in Q2, according to the World Gold Council, while gold-backed ETFs experienced robust inflows during the same period.
XAUUSD has been trading bullish during August 7 trading session. Уven the geopolitical relief did not prevent gold from continuing its upward path. On August 7 the price has successfully retested the 3,380.00 support and is currently heading towards the level of 3,440.00.

XAUUSD GOLD BUYS Gold hit all take profits and now will be taking more trades into the correct direction for the rest of the trend , keep the trading simple and straightforward

GOLD | Consolidation Gold is moving between a range and most probably will give a upside breakout.Once a breakout is given the then the next target is its last top.

"Gold Rejected at Resistance – Eyes Set on $3,350 Support"This 45-minute chart of Gold Spot (XAU/USD) highlights a possible bearish reversal pattern. After testing and rejecting resistance around the $3,400 level twice, price action shows signs of weakening bullish momentum. The chart suggests a corrective move is likely, targeting the support zone around $3,350, which aligns with the previous breakout level and horizontal support. Traders should watch for confirmation signals near the resistance before entering short positions. Keep an eye on volume and candlestick patterns to validate the move.🔍 Overview
Current Price: $3,380.32
Timeframe: 45-minute chart
Instrument: Gold Spot (XAU/USD)
Trend: Sideways to bearish bias near resistance
Key Zones:
Resistance: ~$3,400
Support (Target): ~$3,350
Major Support: ~$3,295–$3,300 (prior consolidation low)
---
🧱 Chart Structure & Key Observations
1. Double Top Formation
Price has tested the $3,400 zone twice and failed to break higher.
This creates a potential double top – a bearish reversal pattern.
2. Price Rejection
Long upper wicks near the top suggest strong selling pressure.
The recent move downward signals a shift in sentiment.
3. Bearish Impulse & Projection
The forecasted arrow shows a corrective move toward $3,350.
This level coincides with previous breakout structure and acts as a logical support retest.

Gold (XAU/USD) Technical Analysis:Gold is currently consolidating after a temporary bullish move and is testing a key support zone near $3,370.
🔻 Bearish Scenario:
If the price breaks below $3,370 and holds, this could lead to further downside towards $3,358, followed by a potential retest of the major support area at $3,310.
🔺 Bullish Scenario:
If the price bounces and breaks above the $3,385 resistance with strong momentum, we may see a continuation toward $3,397, and possibly $3,410.
⚠️ Disclaimer:
This analysis is not financial advice. It is recommended to monitor the markets and carefully analyze the data before making any investment decisions.

The powerful perspective that can change your attitude to losseWant to know a secret? You can actually change how you react to losing trades—just by thinking differently. Cool, huh?
🫣 Here’s a hard truth that every trader needs to accept: every trade is a potential loss.
Losses are an inevitable part of the game.
No matter how good your setup is, no matter how much you’ve prepared—there will always be trades that don’t work out.
Trading is already emotionally challenging as it is. But if you get stuck obsessing over one single trade, it becomes so much more emotionally exhausting. You start evaluate yourself after every outcome. And that’s not a sustainable way to trade.
Let’s be honest: the result of one trade doesn’t say much about your actual trading performance.
It’s only over time—after a series of trades—that you can honestly evaluate how you’re doing.
If we want to reduce some of the emotional storms that come with trading, we need a different strategy. A more compassionate one. One that gives us the space to breathe, recover and grow.
So how do we do that? By practicing a shift in perspective.
A shift that’s actually rooted in neuroscience. It’s about broadening your perspective.
👉 Broadening your perspective means reminding yourself:
"This is just one of many trades I’ll take in my trading journey."
That’s it. Simple. No complicated strategy. Just a small shift in thinking that helps you regulate your emotions.
Whether you’ve just taken a loss or feel doubt creeping in before entering a trade—say it to yourself (out loud if you want!): “This is only one of many trades I will experience.”
And here comes the science part:
🧠 When you broaden your perspective like this, the brain responds. It decreases arousal in the amygdala—your brain’s “panic button.”
At the same time, it activates the prefrontal cortex—the part of your brain responsible for rational thinking, impulse control and analysis.
Put simply: you become more emotionally balanced—and more able to view the market objectively.
🤔 Why is that important?
Because when your amygdala calms down, the risk of emotionally driven mistakes decreases.
The fear becomes less intense.
And in trading terms: you’ll be better at cutting losers faster and holding on to winners longer.
🪄 Will this shift magically erase all tough emotions? No. The emotions will still be there—just not as loud.
And isn’t it more motivating to remind yourself that you are not defined by a single trade?
You’re defined by your overall journey. Your effort. Your long-term consistency.
💡Pro Tip:
Next time you feel hesitation—even with a solid setup, or after closing a losing trade
👉 Try this reminder:
“This is only one of many trades I will execute during my career.”
Let it soften the inner storm.
Happy, compassionate trading! 💙
/ Tina the Trading Psychologist
