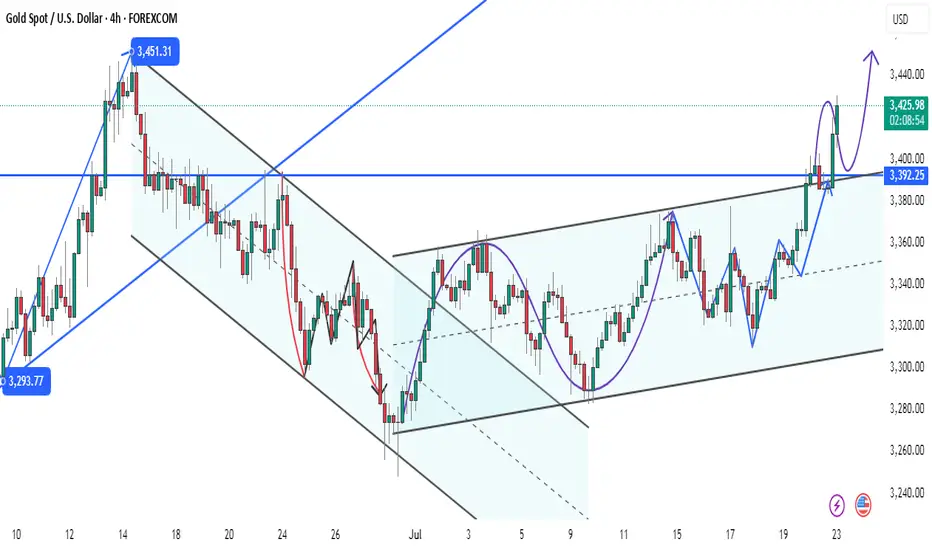
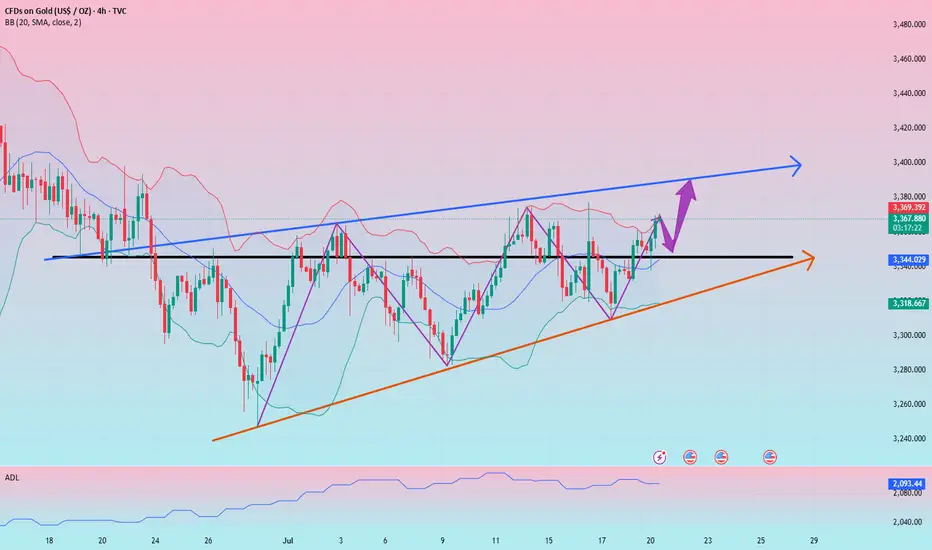
Hybrid Gartley-Elliott Wave Trade Setup on Gold – Bearish Dip In📊 Detailed Analysis & Prediction:**
This trade setup merges two powerful frameworks: a **bearish Gartley pattern** indicating a short-term pullback, and an **Elliott Wave interpretation** suggesting bullish continuation via wave five.
### 🧠 Thought Process:
1. **Gartley Pattern Completion:**
- The chart shows a completed bearish Gartley pattern with point D aligning around the **3,372 level**.
- As per harmonic rules, point D typically signals a reversal zone, suggesting a short-term drop.
2. **Projected Pullback:**
- A drop is expected toward the **3,323 support zone**, which coincides with previous swing lows and Fibonacci retracement confluence.
- This area likely marks the start of **wave five** in the Elliott Wave count — indicating that the bearish move is simply the final corrective wave before continuation.
3. **Wave 5 Bullish Opportunity:**
- Once price reaches the 3,323 zone and shows reversal confirmation, a strong bullish push is expected to begin.
- This aligns with historical wave structures and momentum indicators showing possible trend exhaustion.
Profit Targets:
| Target | Type | Price (USD) |
|--------|-----------------------|---------------|
| TP1 | Fibonacci 1.0 | 3,447.875 |
| TP2 | Fibonacci 1.27 | 3,536.025 |
| TP3 | Fibonacci 1.618 | 3,649.640 |
---
### 🛑 Stop Loss Strategy:
| Level | Type | Price (USD) |
|-----------|---------------------|---------------|
| SL1 | Conservative | 3,246.111 |
| SL2 | Aggressive | 3,198.444 |
XAUUSD trade ideas

XAUUSD BuySimple set up, trend continuation. Gold is buying, so we will be looking at an entry on smaller time frames as they get more bullish.

Xausd techinical analysis.Xausd techinical analysis next move posibale at 30mint time frame.not finchinal advice.

Gold technical analysis and trading strategyGold technical analysis and trading strategy
From the daily level, the gold price has confirmed that it has broken through the lower track support of the large convergence triangle, forming a typical three-day continuous pull-up pattern. Yesterday's big positive line was full of entities, not only breaking through the 3365-3377 area of the previous few weeks of shock highs, but also standing on the 3380 mark of the small convergence triangle trend pressure level, which opened up technical space for subsequent rises.
The 4-hour chart shows that the price continued to strengthen after breaking through the middle track, and the MACD indicator golden cross ran well, indicating that the bullish momentum is increasing. It is worth noting that the previous resistance area of 3365-3377 has now been transformed into an important support belt, and together with the 5-day moving average of 3360, it constitutes a callback defense line.
【Key price analysis】
Support:
The primary support is in the 3380-3383 range, which is the resonance area of the trend line conversion support and the middle track of the hourly chart
The secondary support is at 3360-3365, including the 5-day moving average and the previous breakthrough position
Resistance:
The short-term primary target is the 3408-3420 area, which is the upper track of the large convergence triangle
After the breakthrough, it will challenge the space above 3450, and then a unilateral upward trend may be launched
【Disk details observation】
In the morning, the gold price experienced a technical correction after testing the overnight high of 3401, but it remained above the 3380 support. From the hourly chart:
There is obvious buying in the 3382-3383 area
Although the price briefly fell below the middle track of 3386, it quickly recovered the lost ground
If the US market can regain the 3400 mark, it will confirm the start of a new round of upward attack
It is particularly worth noting that the current market presents a typical time-for-space feature. If the 3380 support fails to be effectively broken before 22:00, it is likely to complete the adjustment through sideways consolidation and then directly start the upward attack.
"In the context of a clear positive trend, it is recommended to adopt a trading strategy of mainly doing more on pullbacks:
Ideal entry point for long orders: 3400-3405 range
Strict stop loss setting: below 3395
Initial target: 3415-3420 area
After breaking through 3420, you can continue to hold and look at 3450
For aggressive traders, you can try to go long with a light position in the 3400-3410 support area, but you need to strictly control your position. Conservative investors can wait for the price to stabilize at 3400 before intervening."
Professional reminder: "The essence of trend trading is to follow the trend. The current gold price has formed a complete upward channel, and each pullback is a good opportunity to arrange long orders. But you need to pay attention to controlling your position and guard against the short-term volatility risks that may occur in the US market."
(Probably) short again!Hello all. after last idea that hit the TP, it may go down again. it may be a risky. be happy(wink)

Gold is under pressure. There is hope for another rise.Today's important news:
At 8:30, Fed Chairman Powell delivered a welcome speech at a regulatory meeting; at 13:00, Fed Governor Bowman hosted a fireside chat session at the large bank capital framework meeting hosted by the Fed.
Market conditions:
The current daily trend is mainly "strong rise" (Monday closed positive and broke through the shock, and the moving average turned upward). The core logic is that short-term bullish momentum is dominant, and it is necessary to focus on the effectiveness of support and the rhythm of breaking through resistance.
Today, we need to focus on the support belt 3365-3360 area (this position is the 5-day moving average position and the low point of yesterday's European session). As a short-term moving average support, this area is the first line of defense for bulls today. If it can stabilize here, it can be regarded as a signal of short-term strong continuation.
The key pressure level is still around 3420. As a trend line resistance that has been under pressure many times in the early stage, if it can break through, it means that the bulls will break the shock suppression and open up more room for growth.
In terms of operation, it is still mainly low-long. The current gold is still strong. Operation strategy:
Short around 3420, stop loss 3430, profit range 3400-3380
Long around 3360, stop loss 3350, profit range 3380-3400

Daily gold analysisDaily gold analysis
A long position with the target and stop loss as shown in the chart
The trend is up, we may see more upside
All the best, I hope for your participation in the analysis, and for any inquiries, please send in the comments.
He gave a signal from the strongest areas of entry, special recommendations, with a success rate of 95%, for any inquiry or request for analysis, contact me
Gold Possible Buy EntryIm already on this trade and I am looking at another possible trade entry for a possible ABC pattern. Let me know what you think.
XAUUSDXAUUSD in a longterm its going to 5K like i already said in 2022
On a short/ midterm we going to 3500.
The price must close above and reject the consolidation like a support to allow us to buy.
Otherwise the best thing to do is wait.

GOLD Wait For Breakout!
HI,Traders !
#GOLD has formed a Bullish Flag pattern
While trading in an uptrend As
we mentioned in a previous analysis
So we are bullish biased and
IF we see a bullish breakout
We will be expecting a
Further bullish move up !
Comment and subscribe to help us grow !

SELL XAUUSDFirst scenario hit stop loss, I a still expecting price to dump very hard soon towards 3440. Patience is key here

Elliott Wave Analysis – XAUUSD July 17, 2025
🔍 Momentum Analysis
D1 timeframe: Momentum is still trending downward, but we’re starting to see signs of convergence between the indicator lines. Normally, we would expect another two daily candles to reach the oversold zone and trigger a potential reversal. However, with the current narrowing pattern, we cannot rule out the possibility of an earlier reversal. Today’s daily close will be crucial for confirmation.
H4 timeframe: Momentum is clearly declining, suggesting that the market may either continue downwards or consolidate sideways throughout the day.
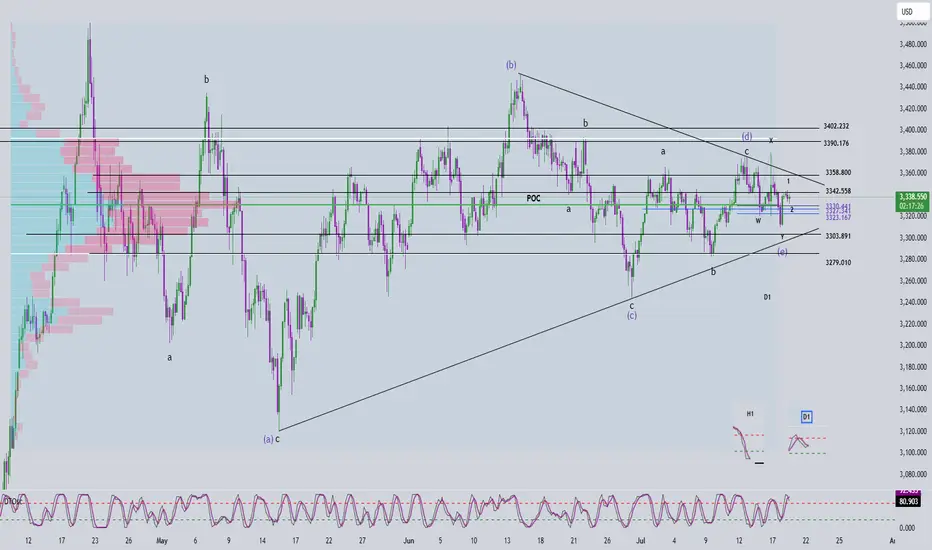
🌀 Elliott Wave Structure
On the H4 chart, price action is compressing tightly at the end of a symmetrical triangle pattern – a classic setup in Elliott Wave theory. Notably, this final point of compression coincides with the POC (Point of Control), indicating a key price level where high volume has accumulated.
Wave W (in black) follows a 3-wave structure. Yesterday, price surged to the beginning of wave W and then sharply reversed, forming the basis for two potential scenarios:
Scenario 1 – WXY structure with current price completing wave Y within wave e (green):
+ Target 1: 3327
+ Target 2: 3303
Scenario 2 – Wave e (green) evolves into a triangle:
+ In this case, price may consolidate sideways above the 3327 zone.
🔗 Combining Wave and Momentum Analysis
Both D1 and H4 momentum indicators are still pointing downward. However, the price candles appear overlapping and lack clear directional strength – a common trait of compression near the triangle’s apex. With price sitting right on the POC, there’s a high chance of continued tightening before a breakout. At this stage, the recommended strategy is to wait for a strong bullish candle at one of the target zones before entering a BUY position.
📈 Trade Setup
✅ Scenario 1 – BUY at 3327 – 3326
+ Stop Loss: 3317
+ Take Profit 1: 3342
+ Take Profit 2: 3358
+ Take Profit 3: 3402
✅ Scenario 2 – BUY at 3305 – 3302
+ Stop Loss: 3295
+ Take Profit 1: 3327
+ Take Profit 2: 3358
+ Take Profit 3: 3402
Gold is rising steadily, finding the right buying point is the k
There are no eternal friends, only eternal interests. Value exchange is the "code" of interpersonal relationships. From the president to individuals, the game of interests is everywhere.
Half a year ago, Musk strongly supported Trump to take office. The two joined forces to win the swing states. One gained power and the other gained fame. After Musk became the head of the efficiency department, he made drastic reforms and fought corruption from the outside to the inside.
Now, the two have parted ways. According to US media reports on July 20, Trump began to review the order contract between Musk's Space X and the federal government. In just 6 months, the two went from close friends to opponents. The "big and beautiful" bill was also strongly resisted by Musk.
If the big guys are like this, let alone ordinary people, their butts determine their heads, sitting in different positions to think about different interests, emotions and friendship are just outer garments, Musk spent $270 million and got fame, and Trump also got the power he pursued, there is no right or wrong.
This struggle is far from over. It is estimated that the game will continue during Trump's four years in office. Musk stands on the high-dimensional pursuit of interests for the exploration of human progress, while Trump's slogan is to make America great again. The two people have taken different routes.
What we care about is not the right and wrong of the two, but whether this right and wrong will bring turmoil to the financial market. Will Tesla be the "prince in distress"? Is there a possibility of bargain hunting after the stock price plummets in the short term? Will the gold market trigger risk aversion because of Trump's unpredictable approach? This is what we need to ponder and study.
Okay, let's talk about the gold market today:
During this period, the volatility of the gold market has become smaller and smaller, and the range of fluctuations has also been compressed. The sentiment of investors in the market is relatively low. When the fluctuations just started in April, some people who were trapped were concerned about when to get out of the trap every day. After 3 months, everyone is tired, and the fight between bulls and bears has cooled down.
However, as the shock is coming to an end, the gold price may explode into a new round of unilateral market at any time due to fundamentals, especially on August 1, Trump will implement equal tariffs on global trading partners. This king bomb has been delayed. Once it starts to land, it will inevitably cause turmoil in the financial market.
Since last week, affected by Trump's threat to fire Fed Chairman Powell, the gold price quickly hit the high of $3,370 and then fell back to $3,310. After that, the price lows continued to rise and rebounded. The top and bottom conversion of $3,345 in the morning and the support of the low point in the early morning of last Friday were the starting points for the rise. Today, the focus is on the long-short dividing point of $3,345, that is, the price is temporarily not empty above $3,345. Today is not a sharp rise at the opening. The prerequisite for a sharp rise must be that $3,345 breaks.
Today, I think that 3345 USD should be used as the dividing point between long and short positions, that is, your stop loss should be placed below 3345, and then find a position to go long, such as within the range of 3360-55, first look at 3370-75 above, and then look at 3392-95 USD after breaking through. Some people say that they dare not do such a large stop loss? In fact, just reduce the position. The stop loss space is dynamically adjusted according to the support level. Fixed stop loss space is a false proposition.
Gold Approaches New Resistance – Potential Short-Term Pullback📊 Market Update
Gold is currently trading around $3,368–$3,370/oz, up approximately 0.5% today, supported by a weaker USD and slightly declining US Treasury yields. This comes amid global trade concerns and expectations that the Fed may adjust policy in upcoming meetings.
📉 Technical Analysis
•Key Resistance: $3,375–$3,380 (pivot R2: $3,374.9, R3: $3,389.6)
•Nearest Support: $3,360 (S1: $3,335.8)
•EMA: Price is trading above the EMA9 / EMA20 / EMA50 / EMA200, confirming a strong uptrend
•Candlestick / Volume / Momentum:
o MACD & ADX still confirm strong bullish momentum
o Price consolidating in a rectangle range of $3,352–$3,366 → watch for breakout or rejection at resistance
📌 Outlook
Gold may pull back slightly if it fails to break through the $3,375–$3,380 resistance area and RSI continues hovering near overbought levels.
💡 Suggested Trade Strategy
🔻 SELL XAU/USD at: $3,375–$3,380
🎯 TP: 40/80/200 pips
❌ SL: $3,385
🔺 BUY XAU/USD at: $3,345–$3,348
🎯 TP: 40/80/200 pips
❌ SL: $3,339

Buy first when gold falls back, and pay attention to the strengtGold went on a roller coaster ride last week. It rose to around 3377 at the beginning of the week and then fell back under pressure. After stabilizing near 3309 on Thursday, it strengthened again on Friday and came under pressure near 3361. It fell back slightly to around 3344 at the opening in the morning and is currently rising again. In the morning, pay attention to the opportunity to buy first after the pullback, pay attention to the strength of the European session, and pay attention to the pressure near 3378/80 on the upside.

Gold After.......Ill do a break down of this pair sometime tonight I did go ahead and close my positions due to the fact I didn't get my proper entry confirmation so I wasn't 100% comfortable even though I did trail my stops on lower time looking to reenter once I can get a clean retest on fibs or structure retest to take another buy currently sitting on my hands till a set up presents it self.

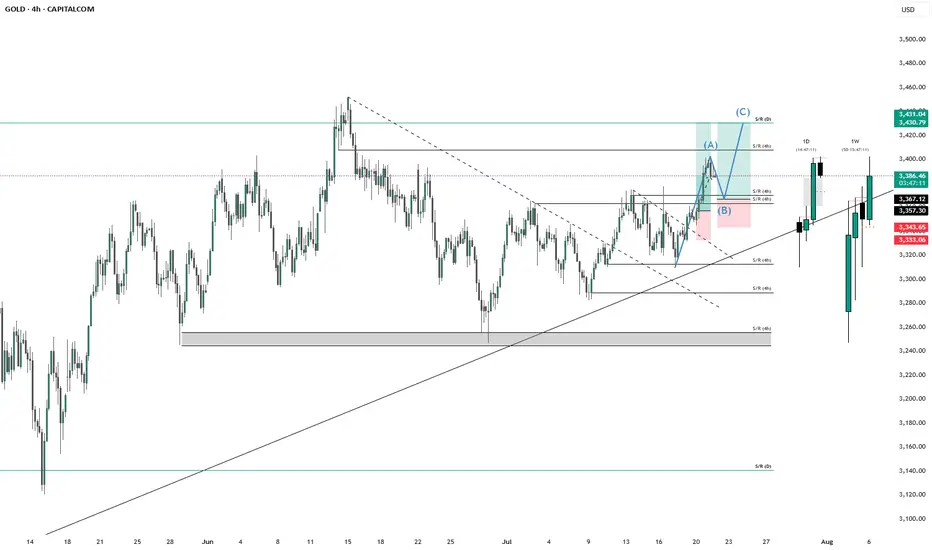
XAU/USD Analysis – Wave 2 Still in ProgressOANDA:XAUUSD
We're currently in a corrective structure following our Circle Wave 3.
✅ (A) and (B) of the correction are already complete.
🔽 Now we're in the development of Wave (C), which should unfold as a 1–2–3–4–5 structure.
📌 Current Situation
Wave 1 of (C) was very impulsive – a strong move confirming the structure
We're now in Wave 2, which is developing as a classic ABC correction
✅ Circle A and Circle B are complete
🔄 Currently transitioning from Circle B to Circle C
🧠 Market Insight
We’ve already seen the first touch of the Fib zone, but I don’t believe that marks the end of Circle C just yet – the time duration of B → C is too short compared to 1 → A and A → B.
That's why I expect a smaller degree correction playing out now:
→ (A) → (B) → (C) (lower timeframe within Circle C)
Alternatively, the whole 1 → 2 could even unfold as an A–B–C–D–E triangle, though I personally prefer ABC structures for cleaner setups and better trade entries.
📈 Trade Setup
There are two short setups currently marked in the chart:
Sell from small B → small C
🎯 Take-Profit: Aligned with Fib Extension Zone near 3400
🛑 Stop-Loss: Just above the small A
Sell from small C extension move
🛑 Stop-Loss: Below (B)
🎯 Target: Also around the major Fib confluence zone at 3400
📊 Conclusion
✅ Wave (1) done
🔄 Wave (2) still unfolding as complex ABC
⚠️ Be patient for confirmation of small B → C
🟢 Fib zones aligned – volume expected around 3400
🧩 Clean setups preferred over triangle flags

XAUUSD
XAUUSD Updated in 30M :
The gold signal is marked on the chart based on the latest price changes and the supply and demand in the market. These points include the entry point, stop loss, and take profit.

Sell Zone Resistance 3356-3358Next Week Its Will first Go to 3354,3356
its First resistance with TP 3335,3325 and if cross this resistance or breakout 3362 then will next Sell entry will at 3374 with Tp 3310
Good luck.

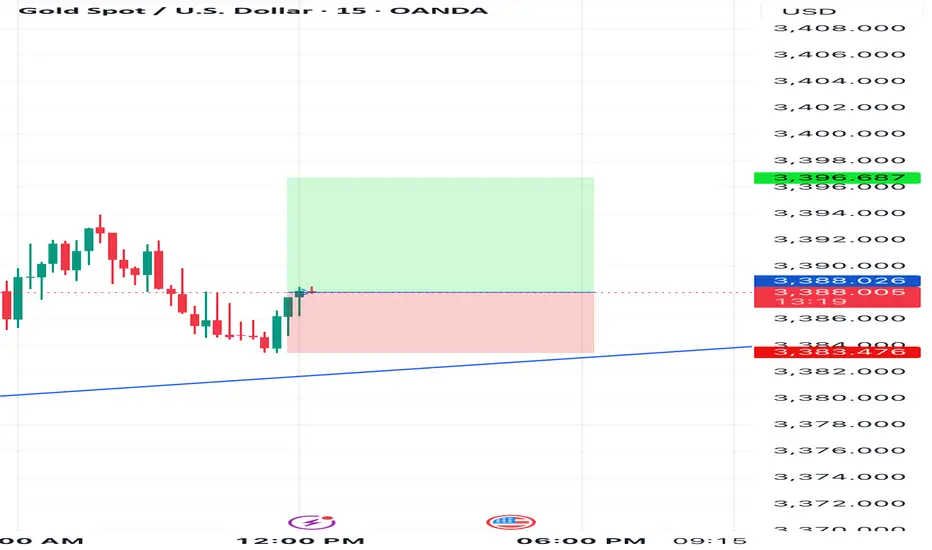
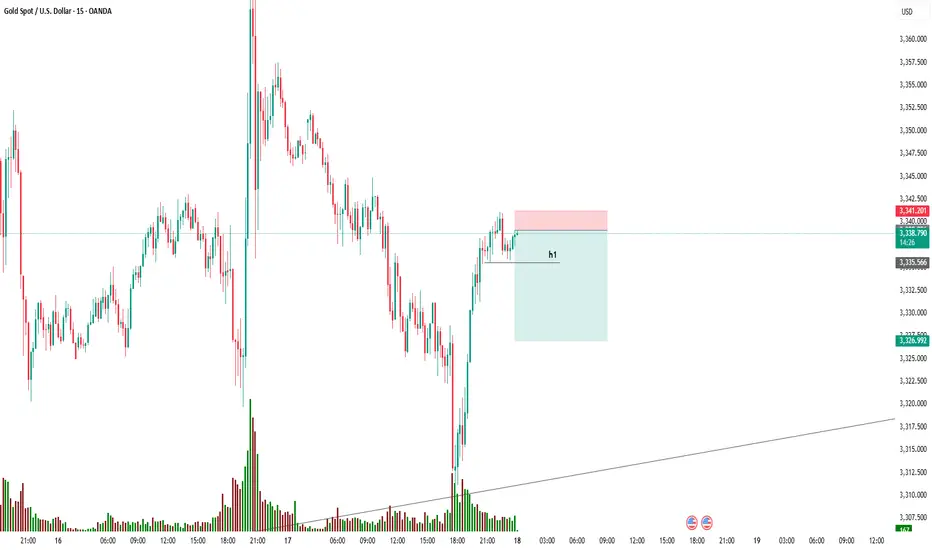
15-minute Gold Spot (XAU/USD) chart,📊 Trade Analysis:
Entry Price: Around $3,338.645
Stop Loss (Red Zone): Slightly above $3,341.201
Take Profit (Green Zone): Around $3,326.992
Risk-to-Reward Ratio: Approximately 1:2.5 (Good)
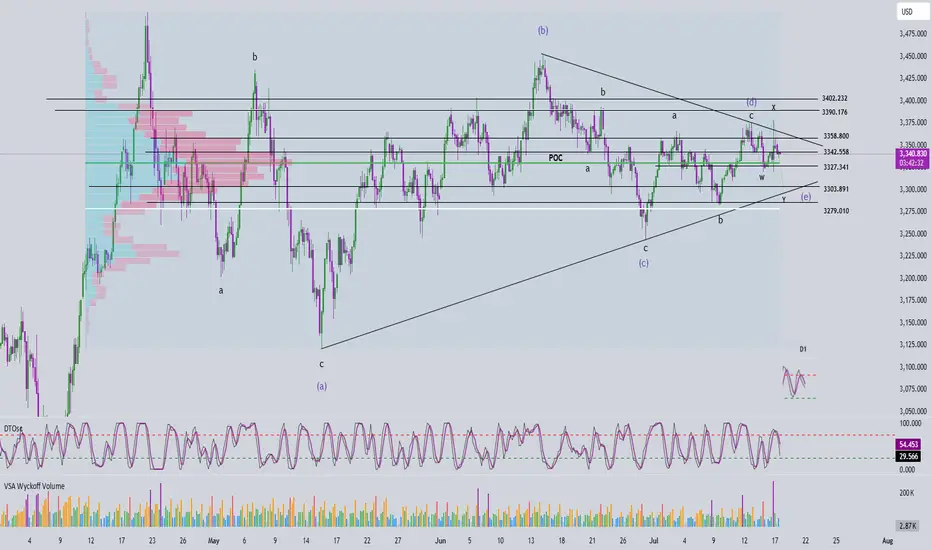
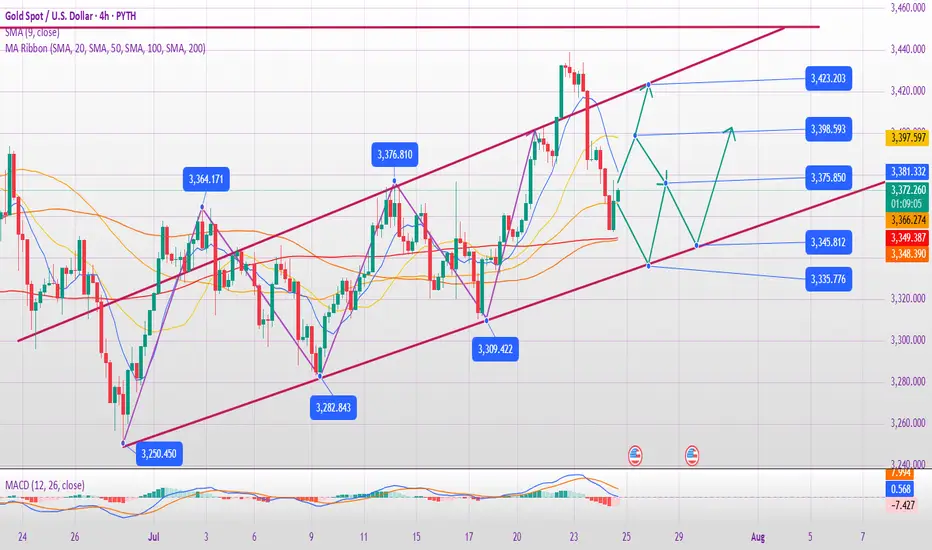
Elliott Wave Analysis – XAUUSD July 18, 2025📈 Elliott Wave Analysis – XAUUSD July 18, 2025
🔍 Momentum Analysis
D1 Timeframe: Momentum is showing signs of a bullish reversal. While we need to wait for today's D1 candle to close for confirmation, it's likely that yesterday’s upward move marks Wave 1, signaling the beginning of a new bullish trend.
H4 Timeframe: Momentum is preparing for a bearish reversal → suggesting a potential corrective pullback, likely forming Wave 2.
H1 Timeframe: Momentum is about to reverse upward → supporting the expectation of a short-term bullish move during the current session.
🌀 Elliott Wave Structure Update
On the H4 chart, the abcde triangle correction structure remains largely unchanged.
However, a strong H4 bullish candle appeared yesterday, indicating unusual market behavior that deserves attention.
There are two main scenarios:
- Wave 1 (black) has already completed, and the market is now entering Wave 2 correction.
- Alternatively, the current movement could be Wave 4 within Wave 1 (black).
🔎 Combining Momentum & Wave Structure
- With D1 momentum signaling a potential uptrend lasting the next 4–5 days, it suggests that Wave e (blue) may have completed.
- This opens the door for an impulsive 5-wave advance. Specifically:
+ If H1 continues its bullish reversal, the current move could be Wave 5 of Wave 1 (black), targeting the 3358 level.
+ Afterwards, a retracement toward the 3330–3323 zone would form Wave 2 (black).
+ Alternatively, price might drop directly to 3330–3323, implying Wave 1 has already finished and the current move is Wave 2.
🎯 => Both scenarios converge at the 3330–3323 price zone, making it a high-probability BUY ZONE.
🧭 Trade Plan
BUY ZONE: 3330 – 3327
Stop Loss: 3320
Take Profits:
TP1: 3342
TP2: 3358
TP3: 3402
📌 Note: Since this is a relatively wide entry zone, it's best to wait for price action confirmation at this level before entering.
Will gold continue to fall on July 25?
1. Brief analysis of gold fundamentals
The current gold price is fluctuating downward, and the core driving factors are:
Risk aversion has cooled down:
The United States and Japan reached an agreement on automobile tariffs and promoted an agreement with the European Union, easing previous global trade tensions;
The overall risk appetite of the market has increased, and safe-haven funds have withdrawn from gold.
The US dollar rebounded in stages:
The US dollar index rebounded after the previous decline, which partially offset the safe-haven appeal of gold;
Although there are expectations of interest rate cuts within the Federal Reserve, there are large differences, and the overall trend is still "wait-and-see", which has increased the volatility of the US dollar trend.
2. Technical analysis of gold
Trend characteristics:
Gold has fallen from the high of 3438 and has been under pressure for two consecutive days;
It is currently testing the 0.618 retracement support (about 3360) of the 3310-3438 increase;
The European session continued to fall. If there is a rebound before the US session, there may be a risk of "false breakthrough and real decline";
If the US session still does not rise in the early session, it is necessary to pay attention to the possible V-shaped reversal in the future.
Technical indicators:
The short-term MACD bottom divergence gradually emerges, and the probability of oversold rebound correction increases;
Important support: 3350-3340 range (once lost, it may test the lower track of the 3337 daily triangle);
Key pressure: 3393-3403 range (initial rebound resistance), stronger resistance is around 3416-3418.
III. Short-term operation strategy suggestions
✅ Main idea: shorting on rebound is the main, and long on callback is the auxiliary
Short order layout reference:
If the 3393-3403 area encounters resistance, you can try to short with a light position;
Stop loss is set above 3410, and the target is 3360-3350;
If the market breaks through 3403 strongly and stabilizes, the short order strategy needs to be suspended.
Long position layout reference:
If it drops to 3350-3340 and stabilizes, you can try short-term long with a light position;
Stop loss is set below 3335, and the target is 3375-3385;
If the market quickly breaks below 3337, wait for the lower support to stabilize before intervening.
IV. Trend warning points
If the price does not rebound significantly before the early US market, it is necessary to guard against a sudden V-shaped pull after the US market;
If it directly falls below 3340, the space below opens, it is recommended to stop loss in time and wait for new support points.
✅ Conclusion:
In the short term, gold is still in the downward correction stage, but as the technical oversold signs appear, short-term sharp pull rebound should be guarded against. It is recommended to respond flexibly in operation, pay attention to the response of key support and resistance levels, and avoid chasing up and selling down.
Gold to Take Support Gold at key support level, There is two chances.. where it can grab the liquidity... we will wait and watch... Cheers
