Bearish Gold is consolidating in narrow zoneBearish Gold is consolidating in narrow zone. At present is facing resistance from whee it may fall.
XAUUSD trade ideas

The idea remains unchanged, NY3360-3365 is emptyThe idea remains unchanged during the NY period. Although gold has currently reached a high of around 3348, it has not stabilized above it. If gold successfully breaks through 3350 in the short term, it may reach 3360 or 3365. In the 4H cycle, it presents a step-by-step upward pattern. The K-line is temporarily fluctuating sideways near the upper track. At the same time, 3345 has formed a double top pattern. Combined with Thursday's low of 3310, an inverted triangle oscillation range of 3345-3310 is formed in the short term. This week's trend needs to pay close attention to the breakthrough direction of this range. Short-term long positions can be taken after the trend is confirmed.
XAUUSD@3330-3320 long TP 3345-3365
OANDA:XAUUSD

XAU/USD) order block back up trand Read The captionSMC trading point update
Technical analysis of Gold (XAU/USD) on the 1-hour timeframe, focusing on a potential reversal from a key support/order block zone. Here's a full breakdown
---
Chart Analysis – XAU/USD (1H)
1. Key Zone: Support Level / Order Block (Yellow Box)
The price is currently testing a strong support zone that previously acted as a bullish order block (demand area).
This zone is also near a diagonal trendline and a prior breakout level, adding confluence to the setup.
2. Reversal Anticipation (Black Zigzag Path)
The chart suggests two possible scenarios from the support area:
A bullish bounce leading price up toward:
Target 1: 3,343.05 (near 200 EMA)
Target 2: 3,364.62 (upper resistance)
A break below the yellow support zone, triggering a deeper move toward:
Key support: 3,247.55
3. RSI Oversold Signal
RSI (14) is at 32.66, which is near oversold territory, signaling potential for a bullish reversal if buying pressure steps in.
4. EMA (200 - Blue Line)
EMA at 3,330.95 currently acts as dynamic resistance.
If price bounces from the order block, this EMA may serve as the first reaction level before further upside.
Mr SMC Trading point
---
Summary
Bias: Bullish bounce if price holds above 3,296.04 (order block support).
Entry Zone: Current price near 3,301 or confirmation bounce candle.
Targets:
TP1: 3,343.05
TP2: 3,364.62
Invalidation: Strong break and close below 3,296.04 may open the path to 3,247.55.
RSI: Favoring reversal conditions (near oversold).
---
Please support boost 🚀 this analysis)

GOLD 1H CHART ROUTE MAP UPDATE & TRADING PLAN FOR THE WEEKHey Everyone,
Please see our updated 1h chart levels and targets for the coming week.
We are seeing price play between two weighted levels with a gap above at 3358 and a gap below at 3330. We will need to see ema5 cross and lock on either weighted level to determine the next range.
We will see levels tested side by side until one of the weighted levels break and lock to confirm direction for the next range.
We will keep the above in mind when taking buys from dips. Our updated levels and weighted levels will allow us to track the movement down and then catch bounces up.
We will continue to buy dips using our support levels taking 20 to 40 pips. As stated before each of our level structures give 20 to 40 pip bounces, which is enough for a nice entry and exit. If you back test the levels we shared every week for the past 24 months, you can see how effectively they were used to trade with or against short/mid term swings and trends.
The swing range give bigger bounces then our weighted levels that's the difference between weighted levels and swing ranges.
BULLISH TARGET
3358
EMA5 CROSS AND LOCK ABOVE 3358 WILL OPEN THE FOLLOWING BULLISH TARGETS
3389
EMA5 CROSS AND LOCK ABOVE 3389 WILL OPEN THE FOLLOWING BULLISH TARGET
3416
EMA5 CROSS AND LOCK ABOVE 3416 WILL OPEN THE FOLLOWING BULLISH TARGET
3439
BEARISH TARGETS
3330
EMA5 CROSS AND LOCK BELOW 3330 WILL OPEN THE FOLLOWING BEARISH TARGET
3306
EMA5 CROSS AND LOCK BELOW 3306 WILL OPEN THE SWING RANGE
3283
3254
As always, we will keep you all updated with regular updates throughout the week and how we manage the active ideas and setups. Thank you all for your likes, comments and follows, we really appreciate it!
Mr Gold
GoldViewFX

IS XAUUSD SET FOR MASSIVE SELL THIS WEEK ?the recent decision of Trump administration to cut taxes coupled with the officially implementation of spending bill will encourage short term treasury bonds sell to make up for the trillions of the dollars in the fiscal deficit in the future, causing massive dollar boost which will eventuate in gold sell.
TARGET 1 ( 3200)
TARGET 2 ( 3250)
resistance (3370)
pivot point ( 3

GOLD Rising Support Ahead!
HI,Traders !
#GOLD made a sharp
And sudden move down
And the pair is oversold
So after it retest the rising
Support line we will be
Expecting a local bullish
Correction and a move up !
Comment and subscribe to help us grow !

GOLD Short From Resistance! Sell!
Hello,Traders!
GOLD is weaker than we
Expected and failed to break
The key horizontal level
Around 3360$ and we are
Now seeing a bearish rejection
So we are locally bearish biased
And we will be expecting a
Further bearish move down
Sell!
Comment and subscribe to help us grow!
Check out other forecasts below too!
Disclosure: I am part of Trade Nation's Influencer program and receive a monthly fee for using their TradingView charts in my analysis.

XAUUSD BUY 3260On the 4-hour chart, XAUUSD is currently fluctuating and falling, and the short-term market is expected to continue to fall. The current support below can be focused on around 3260, which is a potential buying position for the bullish bat pattern, and this position is also in the previous demand area.

Gold 1H Intra-Day Chart 07.07.2025Option 1: Gold rejects from CMP & drops towards $3,286.
Option 2: Gold keeps moving higher into another strong demand zone of $3,416.
Which scenario do you find more likely?

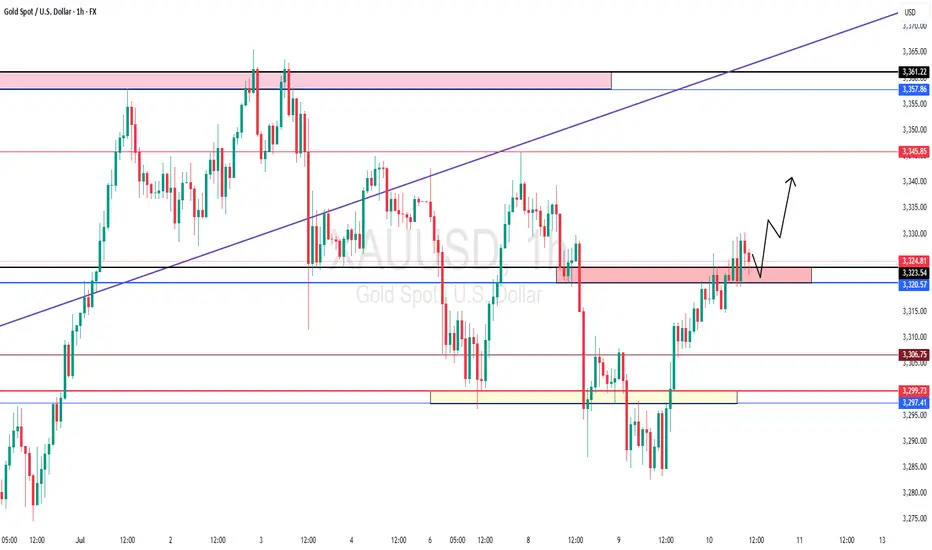
Bearish reversal off pullback resistance?XAU/USD is rising towards the resistance level which is a pullback resistance that is slightly below the 38.2% Fibonacci retracement and could drop from this level too ur take profit.
Entry: 3,324.16
Why we like it:
There is a pullback resistance level that is slightly below the38.2% Fibonacci retracement.
Stop loss: 3,344.28
Why we like it:
There is an overlap resistance level that aligns with the 61.8% Fibonacci retracement.
Takeprofit: 3,295.40
Why we like it:
There is a pullback support level that aligns with the 61.8% Fibonacci retracement.
Enjoying your TradingView experience? Review us!
Please be advised that the information presented on TradingView is provided to Vantage (‘Vantage Global Limited’, ‘we’) by a third-party provider (‘Everest Fortune Group’). Please be reminded that you are solely responsible for the trading decisions on your account. There is a very high degree of risk involved in trading. Any information and/or content is intended entirely for research, educational and informational purposes only and does not constitute investment or consultation advice or investment strategy. The information is not tailored to the investment needs of any specific person and therefore does not involve a consideration of any of the investment objectives, financial situation or needs of any viewer that may receive it. Kindly also note that past performance is not a reliable indicator of future results. Actual results may differ materially from those anticipated in forward-looking or past performance statements. We assume no liability as to the accuracy or completeness of any of the information and/or content provided herein and the Company cannot be held responsible for any omission, mistake nor for any loss or damage including without limitation to any loss of profit which may arise from reliance on any information supplied by Everest Fortune Group.

GOLD DAILY CHART ROUTE MAP Hey Everyone,
Please see update and plans for the coming week on our Daily chart idea that we have been tracking.
After wrapping up last week and actively tracking the 1h and 4h structures throughout last week within the daily chart overall structure. This brings everything together and reminds us how the broader structure has continued to evolve in our favour.
The bounce off at 3272 that we outlined has now fully played out, showing yet again how critical these Goldturn levels are in guiding our strategy.
Following the clean rejection at the channel top near 3433, price moved precisely into the 3272 support, where we were focused on structure to hold. That level held beautifully, giving us a strong technical base for upward continuation.
As we head into the new week, we’ve once again seen price find support at 3272, with a clean bounce that opens up the potential for price to fill the gap back toward 3433, as long as EMA5 remains above 3272. This dynamic will be a key technical trigger for us to monitor in the coming sessions.
There was no EMA5 cross and lock breakdown, which confirmed that buyers maintained control at this level. That absence of breakdown was our confirmation that the bounce structure was not only valid, but likely to continue unfolding into the new week.
As price grinds its way back up the channel, we’ll keep watching for reactions at key resistance zones, with special attention to 3433, the channel top. The measured structural reaction from 3272 has been perfect and supports our method of trading level to level, always with patience and discipline.
Key Levels to Watch This Week:
🔼 Resistance: 3433 (channel top, gap target)
🔽 Support: 3272 (confirmed bounce zone)
Thanks again for all the support, likes, comments, and follows are always appreciated.
Wishing you all a strong start to the week ahead!
Mr Gold
GoldViewFX

GOLD 4H CHART ROUTE MAP UPDATE & TRADING PLAN FOR THE WEEKHey Everyone,
Please see our updated 4h chart levels and targets for the coming week.
We are seeing price play between two weighted levels with a gap above at 3301 and a gap below at 3242. We will need to see ema5 cross and lock on either weighted level to determine the next range.
We will see levels tested side by side until one of the weighted levels break and lock to confirm direction for the next range.
We will keep the above in mind when taking buys from dips. Our updated levels and weighted levels will allow us to track the movement down and then catch bounces up.
We will continue to buy dips using our support levels taking 20 to 40 pips. As stated before each of our level structures give 20 to 40 pip bounces, which is enough for a nice entry and exit. If you back test the levels we shared every week for the past 24 months, you can see how effectively they were used to trade with or against short/mid term swings and trends.
The swing range give bigger bounces then our weighted levels that's the difference between weighted levels and swing ranges.
BULLISH TARGET
3364
EMA5 CROSS AND LOCK ABOVE 3364 WILL OPEN THE FOLLOWING BULLISH TARGETS
3429
EMA5 CROSS AND LOCK ABOVE 3429 WILL OPEN THE FOLLOWING BULLISH TARGET
3499
EMA5 CROSS AND LOCK ABOVE 3429 WILL OPEN THE FOLLOWING BULLISH TARGET
3499
EMA5 CROSS AND LOCK ABOVE 3499 WILL OPEN THE FOLLOWING BULLISH TARGET
3561
BEARISH TARGETS
3295
EMA5 CROSS AND LOCK BELOW 3295 WILL OPEN THE SWING RANGE
3242
3171
EMA5 CROSS AND LOCK BELOW 3171 WILL OPEN THE SECONDARY SWING RANGE
3089
3001
As always, we will keep you all updated with regular updates throughout the week and how we manage the active ideas and setups. Thank you all for your likes, comments and follows, we really appreciate it!
Mr Gold
GoldViewFX

XAUUSD Trade UpdateYesterday price failed to hold below key support.
Gold has now broken out of a descending channel after reclaiming the global trendline. It’s trading above the nearest fractal and testing the MA200, with Awesome Oscillator flashing bullish momentum.
#TradeIdea
🔼 Buy XAUUSD — only if we get a clear consolidation above $3340
🎯 Target 1: $3360
🎯 Target 2: $3385 (only after Target 1 is hit)
⚠️ Wait for confirmation — no premature entries.

Although the bulls are strong, don't chase them at high levelsGold trend analysis:
The market is fluctuating repeatedly now, and it is possible to rise or fall, but under the bullish trend, the main force is still rising. Therefore, this week's trading is to fall back and do more at a low price. Whether it is the previous 3285, 3306, or 3315, there are good profits. Although it is temporarily unable to break out of the bullish volume, at least the trend remains unchanged, and there will definitely be a large upward space in the future. Today is Friday, and we still pay attention to the possibility of bullish volume. This week, we have been emphasizing that if it rises during the week, we will see the 3370 high point. If 3370 breaks, there are still 3380 and 3400 above. On Friday, we will see whether this idea is realized.
From a technical point of view, there was a sharp pull this morning, with the big sun breaking through the upper track of the downward channel 3326 in the above figure, and then stepping back to confirm stabilization and bottoming out, which means that the breakthrough is effective, so you can directly follow the bullish trend in the morning, and during the European session, it repeatedly went up and down around the 3345-3332 range. With the experience of yesterday's trend, today we have been waiting for it to approach the 10-day moving average and then continue to be bullish on dips, and the entry point is basically good; currently it has broken through the resistance level of 3345 in the European session, so it depends on whether it can stand directly on it tonight. Once it stands, it can gradually rush to 3370, and the second is 3374, etc.; Of course, if it just pierces but does not stabilize, it will continue to spiral slowly upward around the yellow channel in the figure, so continue to wait patiently for the 10-day moving average, which is also the lower track position to grasp the low and long; Therefore, tonight gold 3345-3333 continues to rise on dips, with 3330 top and bottom positions as nodes, resistance at 3370, further resistance at 3374, etc.; If there is an unexpected big negative inducement to empty the market like yesterday, pay attention to stabilization above 3320 and still bullish;
Gold operation strategy: It is recommended to go long when it falls back to 3333-3345, and the target is 3360-3370.

The 3-Method Framework: Simplifying Technical AnalysisMost traders get caught up in complex indicator setups, thinking that more tools equal better results. We rely on moving averages to tell us if prices are trending up or down, and we depend on support and resistance levels to predict market movement. But what if I told you there's a simpler, more powerful way to read the market using pure price action?
Today, I want to share my experience and understanding of bias and expectations for the next candle formation. This approach is refreshingly simple because we don't need to understand every single price movement - we just need to focus on what matters most.
Method 1: Opening Price Comparison
The first method is beautifully straightforward. For a bullish bias, the current opening price should be above the previous opening price. That's it. Sounds almost too simple, right? But simplicity often holds the greatest power in trading.
For Gold yesterday, we simply needed to compare the latest opening price on the Daily timeframe with the previous opening price. It's that simple.
Method 2: Mid-Level Analysis
The second approach involves comparing mid-levels between candles. We compare the mid-level of the previous candle with the mid-level of the candle before that. I know it might sound a bit complicated when explained this way, but once you visualize it on your chart, the concept becomes crystal clear.
Still on Gold, we just compare the 50% or mid-level of the previous candle with the candle two periods back from the latest candle on the daily chart.
Method 3: Expansion Expectations
The third method helps us anticipate expansion in price. Traditional complex methods require analyzing numerous factors, but this simplified approach only needs two candles before the current one. Here's how it works: we use the high and low of the candle two periods back, and the open and close (body) of the previous candle. If the previous candle's body sits within the high-low range of the two-candle-back formation, we can expect price expansion.
The beauty of this method is that we don't care whether the price is bullish or bearish - we simply expect expansion to occur. Think of it like a compressed spring: when price gets squeezed within a previous range, it often seeks to break out in either direction. We're not predicting the direction, just the likelihood of significant movement.
Still on Gold, I randomly selected all inside candles on the Daily timeframe. Remember, the purpose is only to expect expansion, not direction. If you want to use this for directional bias, make sure you apply the additional analysis required.
Remember, there are no guarantees in trading, but this method provides valuable insight into potential market expansion.
Advanced Combinations for Enhanced Analysis
Combining Methods 1 and 2 creates our most accessible approach since you only need two candles. When both the opening price and mid-point from two candles ago indicate bullish conditions, we can expect the current candle to follow an OLHC bullish pattern.
You can see the 3 examples I've provided in the image, and all of these are applicable across all timeframes, both daily and 4-hour.
Combining all three methods offers a more sophisticated analysis, particularly useful for anticipating market reversals. This involves marking the current and previous opening prices, comparing mid-levels from the last two candles, and identifying the high/low range from two to three candles back.
Now I'm adding Inside Candles from 2-3 periods back (My personal rule is maximum 3 candles before the current candle, or this analysis will lead to analysis paralysis).
The Bullish and Bearish Rules
Bullish Rule 1:
Opening price above the previous opening price
Mid-level of the previous candle above the mid-level of the previous candle before that.
Inside candle formation (optional)
Bearish Rule 1:
Opening price below the previous opening price
Mid-level of the previous candle below the mid-level of the previous candle before that.
Inside candle formation (optional)
The Secret Sauce: Timeframe Harmony
Here's where the "devil is in the details" comes into play. You might find perfect bullish conditions on your chart, but the market still reverses. The secret lies in using this method on Daily and 4-hour timeframes simultaneously.
Simply understand it from the chart.
Simply understand it from the chart.
If Rule 1 conditions are met on the daily chart, they must also align on the 4-hour chart. When the 4-hour contradicts the daily, follow the 4-hour signal as it might indicate a "sell on strength" or "buy on weakness" scenario.
The formula is simple: must align with
I've never tested this on 1-hour charts because the Daily and 4-hour combination provides sufficient accuracy for my trading approach.
Enhanced Rules for Precision
Rule 2 makes the inside candle formation mandatory rather than optional. Sometimes you'll encounter mixed signals where the mid-level suggests one direction while the opening price suggests another. The solution? Drop down to a lower timeframe for additional confirmation.
I don't recommend using this method below the 4-hour timeframe, but you can certainly apply it to Monthly or Weekly charts for long-term bias determination. The key is analyzing both Daily AND 4-hour timeframes together, not just one or the other.
When timeframes conflict, often just one key level provides the confirmation you need - typically a previous Monthly or Weekly high or low.
Final Thoughts
Pure price action mastery isn't about having the most sophisticated setup or the most indicators on your chart. It's about understanding the fundamental relationship between opening prices, mid-levels, and candle formations across meaningful timeframes.
This approach has served me well because it cuts through market noise and focuses on what price is actually telling us. Start with these three methods, practice identifying the patterns, and gradually build your confidence in reading pure price action.
Remember, consistent profitability comes from mastering simple, reliable methods rather than chasing complex strategies. Keep practicing, stay disciplined, and let price action guide your trading decisions.
Good Luck! :)
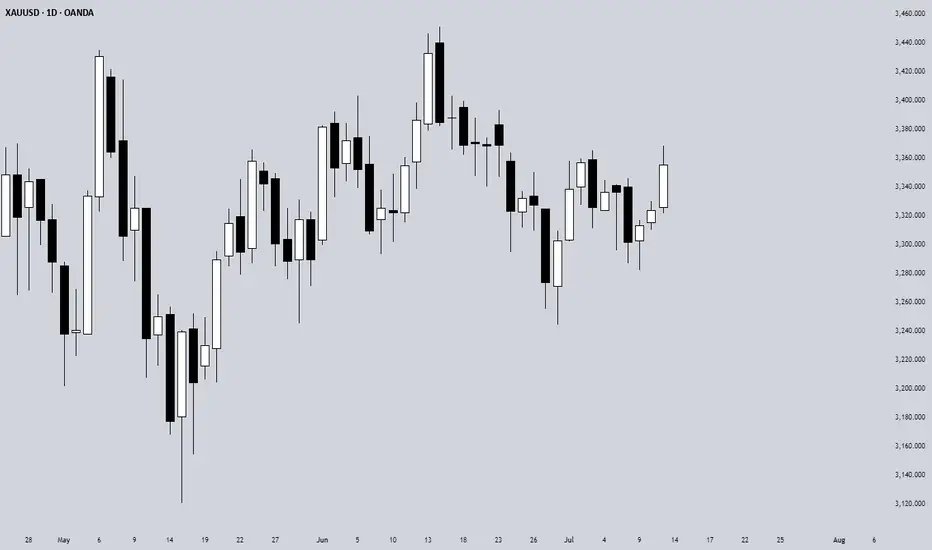
Gold is ready to go up againHi traders,
Last week gold went up again after a correction to finish (orange) Wave D just as I've said in my outlook.
Next week we could see another move down for Wave E and after that the next impulsive wave 5 up.
Or the last correction down was already wave E and gold started the next impulsive wave up.
In both cases gold will shoot up after a correction down.
Let's see what price does and react.
Trade idea: Wait for a small correction down on a lower timeframe and a change in orderflow to bullish to trade longs.
If you want to learn more about trading FVG's & liquidity sweeps with wave analysis, please make sure to follow me.
This shared post is only my point of view on what could be the next move in this pair based on my technical analysis.
Don't be emotional, just trade your plan!
Eduwave

#GOLD UPDATESIn this analysis we're focusing on 2H timeframe for finding the upcoming changes in gold price.
Here we can see clearly that gold price creates trendline resistance and also price sweep all the SSL and pre. daily LQ sweep. Now I'm waiting for retracement, If price retest my supply zone and give bearish sign or reversal confirmation than we'll execute our trades. This is a higher time frame outlook. Further analyze more deeply into smaller time frame and place our position from an perfect point.
Always use stoploss for your trade.
Always use proper money management and proper risk to reward ratio.
Keep an eye on these levels. Confirmation is key.
#XAUUSD 2H Technical Analysis Expected Move.

GOLD - at cut n reverse Region? what's next??#GOLD .. perfect ride as per our last idea regarding gold and now market just above his ultimate area/region.
that is around 3320-23
keep close and if market hold it then further bounce expected otherwise not..
NOTE: we will cut n reverse our position below 3320 on confirmation.
good luck
trade wisely
Gold Range pt.2Beautiful price action in the past 2 weeks. 3408$ is still my POI for a potential rejection to confirm that internal distribution. Im patiently waiting here for what's to come.

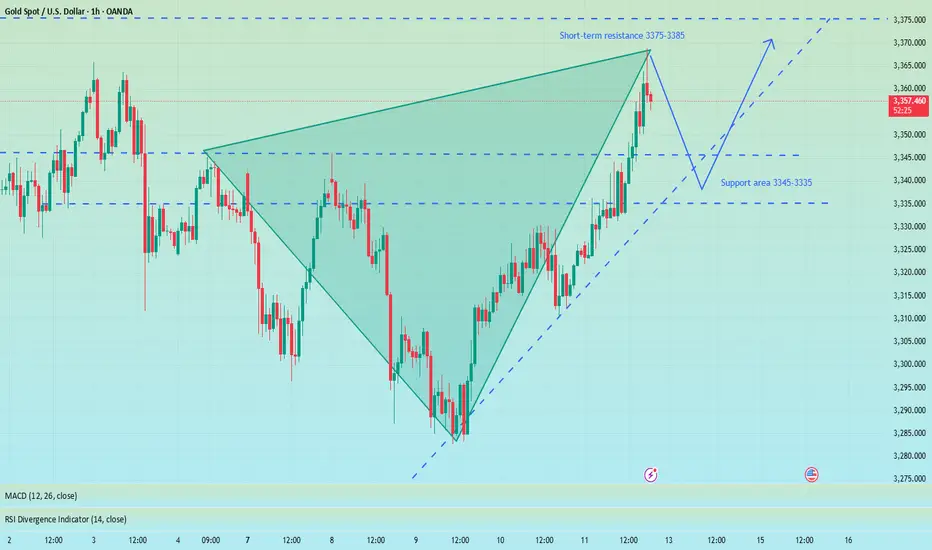
Precisely look at 3365 and pay attention to the pullback chanceAt present, gold has risen as expected and reached the highest level near 3368. The upper 3375-3385 constitutes a short-term resistance level. At present, the bullish momentum is still relatively strong, and the short-term support structure below has been formed. I still maintain the views of the previous transaction and wait for a second trading opportunity when it pulls back below. Although the 1H chart shows that the current trend remains strong and the retracement is small, it is necessary to remain cautious - even if the market is strong, it is not recommended to chase long easily, and the risk of a deep correction in the gold price must be guarded against. First, pay attention to the support area of 3345-3335 below. If it falls back to this level, you can consider going long with a light position.
OANDA:XAUUSD
GOLD CONFIRM TRADE🔍 Chart Analysis Summary:
Current Price: ~3,336
Key Resistance (Supply Zone): 3,340 – 3,353
Major Resistance Above: 3,388 – 3,395
Key Support (Demand Zone): 3,320 – 3,330
Major Support Below: 3,294 – 3,305
⚔️ Trade Setup Ideas:
📉 Sell Setup (High Probability Intraday Short)
Scenario: Price is near the lower supply zone (3,340–3,353), showing rejection.
Entry: 3,340 – 3,345 (on bearish candle confirmation or rejection wick)
Stop Loss: Above 3,353 (zone high or recent swing high)
Take Profit Targets:
TP1: 3,330 (first minor support)
TP2: 3,320 (demand zone)
TP3: 3,295 (major support)
📌 Confirmation Tips:
Look for bearish engulfing / rejection candles
RSI divergence or weakness
Break of 3,330 support confirms continuation
📈 Buy Setup (If Price Drops to Demand)
Scenario: Price drops back into demand zone 3,320–3,330 with bullish reaction.
Entry: 3,322 – 3,328 (bullish wick or engulfing candle)
Stop Loss: Below 3,320
Take Profit Targets:
TP1: 3,340
TP2: 3,353 (supply)
TP3: 3,388 (major resistance)
📌 Confirmation Tips:
Bullish price action near 3,322 zone
Momentum buildup from demand
Use M15/M30 for refined entry

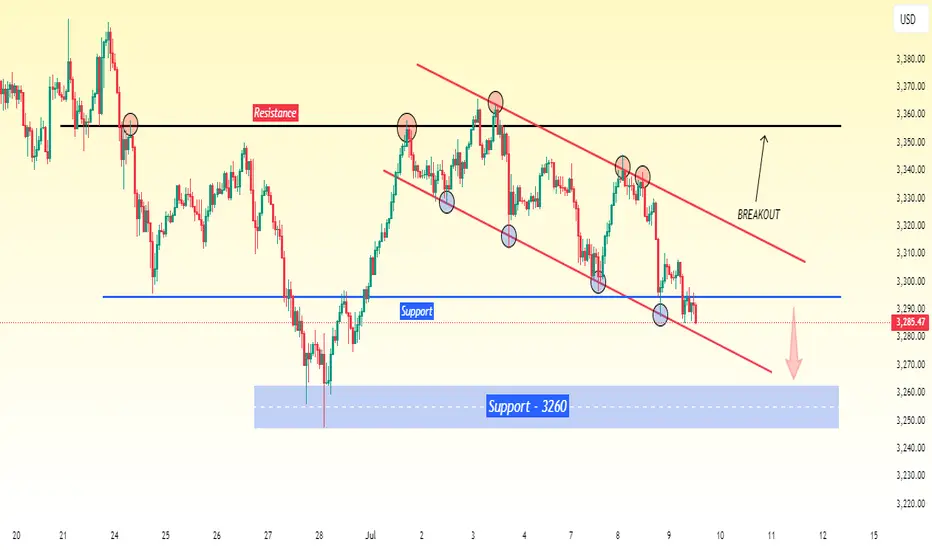
Gold Price Holds Within Channel - Watching for Channel BreakGold is currently moving within a downward sloping channel, reflecting a period of controlled price movement.
If the price continues to follow the channel, it may trend lower in the short term, with the next key support level seen around $3260.
Alternatively, a breakout above the upper boundary of the channel may signal a shift in momentum, opening the way for further upside.
Technical Levels to Watch:
Support: $3260
Resistance: Channel top (watch for breakout confirmation)
Outlook: Continuation within the channel suggests further downside, while a breakout could shift momentum in favor of buyers.
IMPORTANT BREAKOUT 〉BULLS ARE BACKAs illustrated, price has broken out of an important 4H and 1D trend line that had kept price bearish since the beginning of the month.
Yesterday, gold made its way to a ket resistance level and broke it, CLOSING above it in the 4H timeframe, which is a key sign that bulls are back.
An interesting sign is that price bounced from the 61.8 - 67% retracement of the last bullish impulse that had an extended correction.
Should price manage to stay above 3250-3300 next week, , (a very strong psychological and algorithmic price range), the path to a new ATH is well opened and the probabilities arise on its favor.
I try to visualize a potential buy area shown in green, and the invalidation of this idea would be the level from which price has bounced.
--
I have been bullish on gold since 2023, ignoring any correction to be a "bearish market" and rather accumulation phases of longer term potential for growth.
The world economy and geopolitical conflict along many other financial macroeconomic data and circumstances, are simply NOT pointing toward a better future, and gold is screaming so by continuing to rise, and central banks back this up by continuing to buy it physically.
--
GOOD LUCK
