Market ViewWatch
Trade
Manage
Smile
Rejection Level
Daily Volume
Market Structure Shift
London Session
Trend Line Break
Untapped Order Point
XAUUSD trade ideas

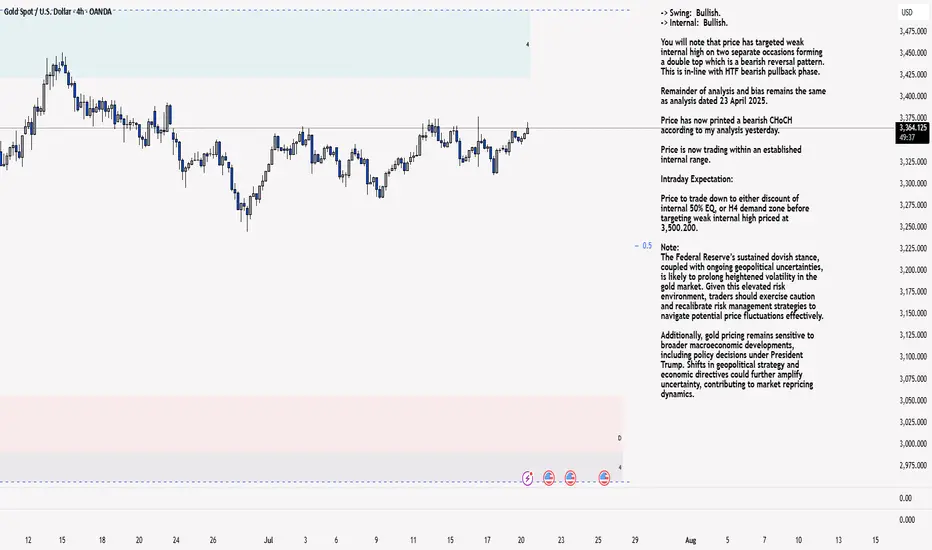
XAU/USD 21 July 2025 Intraday AnalysisH4 Analysis:
-> Swing: Bullish.
-> Internal: Bullish.
You will note that price has targeted weak internal high on two separate occasions forming a double top which is a bearish reversal pattern. This is in-line with HTF bearish pullback phase.
Remainder of analysis and bias remains the same as analysis dated 23 April 2025.
Price has now printed a bearish CHoCH according to my analysis yesterday.
Price is now trading within an established internal range.
Intraday Expectation:
Price to trade down to either discount of internal 50% EQ, or H4 demand zone before targeting weak internal high priced at 3,500.200.
Note:
The Federal Reserve’s sustained dovish stance, coupled with ongoing geopolitical uncertainties, is likely to prolong heightened volatility in the gold market. Given this elevated risk environment, traders should exercise caution and recalibrate risk management strategies to navigate potential price fluctuations effectively.
Additionally, gold pricing remains sensitive to broader macroeconomic developments, including policy decisions under President Trump. Shifts in geopolitical strategy and economic directives could further amplify uncertainty, contributing to market repricing dynamics.
H4 Chart:
M15 Analysis:
-> Swing: Bullish.
-> Internal: Bullish.
H4 Timeframe - Price has failed to target weak internal high, therefore, it would not be unrealistic if price printed a bearish iBOS.
The remainder of my analysis shall remain the same as analysis dated 13 June 2025, apart from target price.
As per my analysis dated 22 May 2025 whereby I mentioned price can be seen to be reacting at discount of 50% EQ on H4 timeframe, therefore, it is a viable alternative that price could potentially print a bullish iBOS on M15 timeframe despite internal structure being bearish.
Price has printed a bullish iBOS followed by a bearish CHoCH, which indicates, but does not confirm, bearish pullback phase initiation. I will however continue to monitor, with respect to depth of pullback.
Intraday Expectation:
Price to continue bearish, react at either M15 supply zone, or discount of 50% internal EQ before targeting weak internal high priced at 3,451.375.
Note:
Gold remains highly volatile amid the Federal Reserve's continued dovish stance, persistent and escalating geopolitical uncertainties. Traders should implement robust risk management strategies and remain vigilant, as price swings may become more pronounced in this elevated volatility environment.
Additionally, President Trump’s recent tariff announcements are expected to further amplify market turbulence, potentially triggering sharp price fluctuations and whipsaws.
M15 Chart:
Xausd techinical analysis.The chart you’ve shared is a 4-hour timeframe for XAU/USD (Gold Spot vs US Dollar), and it features technical analysis with key zones and projected price movement.
Key Elements in the Chart:
1. Current Price: Around 3365.99.
2. Resistance Zone: Near 3375–3380 (marked at the top).
3. Support Zones:
Minor support around 3450 (short-term demand zone).
Stronger support around 3320 (major demand zone).
4. Yellow Arrows:
Suggest a possible pullback from resistance, leading to a retracement toward the 3450 support area.
Then potentially another rebound (bullish bounce) from that zone.
Interpretation:
The price has recently rallied and is approaching resistance.
The projected yellow path implies:
A temporary top or consolidation at the current level.
A dip to retest lower support.
If buyers step in, a bullish continuation may follow.
This aligns with a bullish flag or range breakout retest strategy.
---
Let me know if you want a trading strategy based on this setup (entries, stop-loss, take-profit) or if you want this analyzed in a different timeframe.

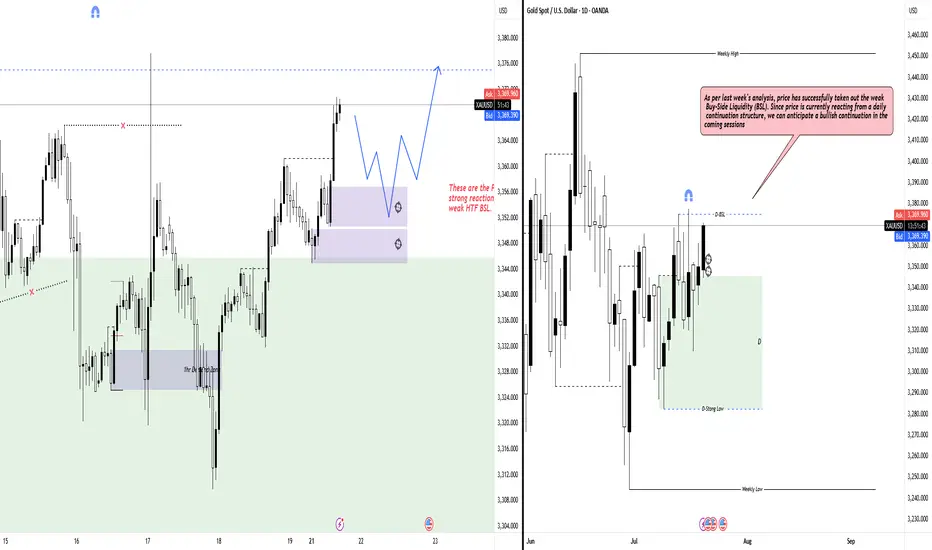
HTF Liquidity Grab Ahead: Eyes on Reaction ZonesHello fellow traders,
Welcome to the new trading week.
Following last week’s analysis, price has successfully swept the weak Buy-Side Liquidity (BSL) and is now reacting from a daily continuation structure, signaling potential for bullish continuation. However, before reaching the weak Higher Timeframe BSL, there are several key Points of Interest (POIs) where we could see strong intraday reactions. These levels may offer short-term pullbacks or re-entry opportunities before the larger move plays out. Patience and confirmation around these POIs will be key.
Gold chart OANDA:XAUUSD – Buy Mindset Activated!
Gold has broken above the 3360–3365 zone with strength and is now heading toward the key resistance levels at 3371 – 3380!
Breakout confirmed with strong momentum
Next resistance levels to watch:
3371.13
3376.29
3380.63

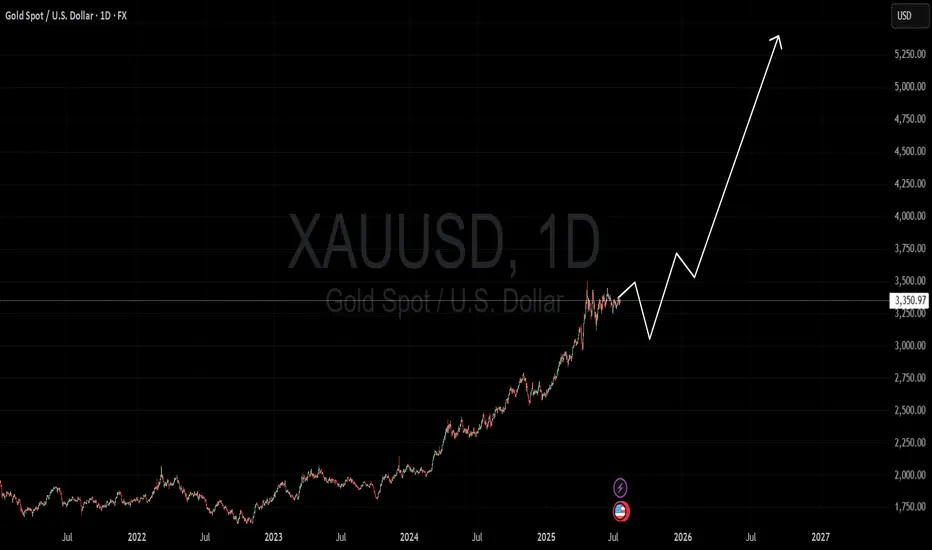
GOLD LONG TERM VIEW
## 🧠 **Fundamental Analysis of GOLD (XAU/USD)**
Gold remains one of the **most reliable stores of value**, especially in uncertain macroeconomic conditions.
### 🔥 Key Drivers Supporting a Long-Term Bullish Case:
1. **Global Debt Crisis & Currency Devaluation**
* Central banks worldwide are printing money to manage debt, inflating fiat currencies.
* This boosts demand for hard assets like gold.
2. **US Economic Uncertainty**
* Potential recession risk, softening labor market, and rising credit defaults.
* Markets expect rate cuts or at least a dovish stance from the Fed → Bullish for Gold.
3. **Central Bank Gold Buying**
* 2023–2025 saw record central bank gold accumulation (especially from BRICS nations).
* This adds massive long-term **demand pressure** on supply.
4. **Geopolitical Risk Premium**
* Ongoing wars, trade tensions, and China–Taiwan uncertainty increase gold's appeal as a safe haven.
5. **Inflation Hedge + Real Interest Rates**
* Even if inflation cools, **real interest rates remain low**, keeping gold attractive.
---
## 📉 **Technical Analysis of GOLD (XAU/USD)**
**Current Price:** \~\$3,350
**Timeframe:** 1D
**Trend:** Strongly bullish, forming higher highs and higher lows
---
### 🧱 Support Zones:
* **\$3,100–3,200:** Recent consolidation base
* **\$2,700–2,850:** Historical breakout retest zone (strong macro support)
* **\$2,000–2,200:** Long-term support from 2021–2023 accumulation
---
### 🎯 Resistance Zones / Targets:
* **\$3,500:** Minor resistance
* **\$3,900:** All-time extension
* **\$4,300 – \$4,500:** Mid-term rally target
* **\$5,200+:** Long-term hyper-bullish target (as shown in your chart)
---
### 📈 Market Structure:
* Strong parabolic rally since mid-2023
* Short-term pullback expected (as per your white zigzag path), before continuation
* Your projection matches a healthy **bullish flag → breakout → impulsive wave**
---
### 📌 My Outlook:
* **Short-Term (Next 3 months):** Correction possible to \~3,100–3,200
* **Mid-Term (2025–2026):** Rally continuation to **\$4,200–\$4,500**
* **Long-Term:** If USD weakens further or more crises emerge, **\$5,200+** is achievable
XAUUSD M45 Outlook Just mapped a high-confluence zone on XAUUSD 👇
FVG + OB + BOS combo forming a bullish base.
Entry around 3343 could set up a clean move to 3375
SL : 3331
If this holds, we fly 🚀
If not — next opportunity loads 🧠

XAUUSD Bullish Outlook – Eyeing 3400+ Zone
Price is currently trading within a rising channel on the 1H timeframe. We are seeing a potential continuation move after a bullish structure was maintained above 3340 support.
🔹 Key Technical Highlights:
Price respecting ascending channel support.
Bullish reaction near lower channel & previous demand zone.
Short-term consolidation may occur near 3375–3385 supply before breakout.
Next key target: 3420–3440 Quasimodo supply zone.

Target remained gold.All markets, especially gold, have been the most manipulated in the last month.
(Market manipulation is completely different from market volatility due to news)
Previously, this happened maybe once or twice a month, but in the last month it happened more than 10 times
Last word: The price of the bottom 3247 will never be hit until the target 3257 is touched

Gold price will reach 3400 next weekGold price will reach 3400 next week
Would you rather believe in your own beliefs or in what Trump says?
Trump's attitude towards Powell: "Fire him!" yesterday, "I didn't say that!" today, "Actually he is a genius!" tomorrow - this is more difficult to predict than the gold market. "
"If the Fed cuts interest rates, Trump will say it is his credit;
If the Fed raises interest rates, it must be a conspiracy of the "deep government." ”
As shown in Figure 4h
Gold prices are under pressure near 3375 and are currently converging near 3350.
The entire macro triangle convergence structure is slowly coming to an end.
Next week, a new round of big market will surely break out.
And this weekend, there is a high probability that new major events + black swan events will occur.
4-hour level short-term trading logic
Bull-bear watershed: US$3350 (closing price on Friday this week)
Upward breakthrough: Pay attention to the pressure zone of US$3370→3380. If the breakthrough fails, the upward expectation will look to 3400+.
Downward breakthrough: Pay attention to 3315-3 The $320 support zone, if lost, will turn bearish to $3,280.
Core driving events:
Fed policy game (key time: July 22-25)
July 22: Fed Governor Waller's speech (previously called for a 25 basis point rate cut in July)
Market focus: If the "immediate rate cut" stance is strengthened, gold prices may break through the $3,370 resistance level.
July 24: Fed Beige Book released
Potential impact: If the report shows regional economic weakness (especially manufacturing/employment), safe-haven buying of gold will increase.
July 25: US Q2 Initial GDP value (expected to grow 1.8% year-on-year)
Scenario simulation: If the data is lower than 1.5%, stagflation trading may push gold prices up by more than 1.5% in a single day
Geopolitical risk (Trump policy interference)
July 23: Trump team may announce details of tariffs on the EU
Historical law: For every 1% increase in tariff expectations, gold volatility will increase by 0.3%, but the market has partially digested 30% tariffs.
Middle East situation: If the ceasefire agreement between Israel and Hamas breaks down, gold prices may respond quickly and rise by 1%-2%.
Summary:
Next week, gold is likely to maintain a range of $3310-3380, but there is an event-driven breakthrough opportunity.
Key observation nodes:
Waller's speech on July 22 (rate cut expectation calibration)
Beige Book on July 24 (economic resilience verification)
GDP data on July 25 (stagflation trading trigger point)

GOLD hits resistance – usd strikes back!XAUUSD is charging into the "danger zone" around 3,375 – a level where bulls have fallen before.
But this time, gold faces a heavyweight opponent:
– The US economy is revving up like a race car: consumer demand is surging, jobless claims are dropping.
– The Fed holds its hawkish stance like a loaded weapon: high interest rates aren’t going away.
– The US dollar is back in full force, and bond yields are shooting sky-high.
While gold buyers try to climb higher, pressure from the “USD fortress” is building fast.
Every uptick in XAUUSD now… might just be a setup before the fall.
If selling pressure returns near the previous highs, another sharp drop in gold could be just around the corner.

XAUUSD will end July negative.During and post CPI, we saw the price of gold spike up towards 3366 to create a sell order block and quickly reversed to 3310 indicating weakening in bullish momentum. With all the geopolitical tensions easing up, XAUUSD price will respect the technical view. Currently, price seems to be printing a bearish flag pattern. We can expect sharp declines from XAUUSD next week.

XAUUSD
XAUUSD Updated in 15M :
The gold signal is marked on the chart based on the latest price changes and the supply and demand in the market. These points include the entry point, stop loss, and take profit

Gold Buying back every dip as expectedTechnical analysis: Interesting turn of events regarding the Short-term as Gold crossed the second Resistance (and is Trading #2 points above it currently) on the Hourly 4 chart and crossed aswell #6-session High’s, which may result as an traditional Buying back every dip (as I advice Traders to Buy every local Low’s recently / what I am doing personally), offering no Selling continuation patterns to Trade by. This is an additional Short-term Buying signal similar to cycle of February #2 - #5 #2020 parabolic rise, which ended as an correction. Hourly 4 chart is under much needed consolidation (current dip Buying) near #3,352.80 benchmark and is again leaning on Bullish side rather than Neutral, as Gold is still ignoring strong Overbought levels following mostly losses on DX (taking strong hits), turning as well Oversold in the process as global Geo-politics dust rises, and as long those guide the market sentiment, further uncertainty on Gold is inevitable and Buying underlying trend will persist.
My position: I repeat / keep in mind that Swing Trading is not possible currently on Gold as Scalp / in & out aggressive orders are key to make excellent Profits (I will advise when to continue with Swing orders). I have firstly Bought Gold on #3,324.80 throughout yesterday’s session and closed my set of Buying orders on #3,332.80 Resistance and since I knew news may push Gold down, had Buy limit on one of my possible reversal points of #3,307.80 / #3,310.80 / #3,313.80 which worked nicely. This was one of many brilliant weeks of Scalping the market. Keep in mind that #MA50 on Daily chart plays big role currently and whether Gold establishes it as an Support or Resistance, major trend will continue. I do believe it will be established as an Support and that’s why I maintain my #3,377.80 and #3,400.80 Medium-term Targets. Enjoy the Profits!

Gold (XAUUSD) at Decision Point – Watch $3,320 Closely! Technical Analysis – 4H Chart
Gold is trading within a rising channel, but momentum is weakening. The current price action is testing the lower channel support around $3,320 — a critical level for the next directional move.
🟥 Bearish Scenario:
Break & close below $3,320 could confirm channel breakdown
Target: $3,219 support zone
Bearish engulfing seen on higher timeframe adds pressure
🟩 Bullish Scenario:
If $3,320 holds as support and price bounces back:
Possible move toward upper channel resistance around $3,401
🌍 Fundamental Outlook
Recent CPI data was soft, but no strong bullish push yet
Focus on upcoming U.S. economic releases (employment, PMI, retail sales)
Strong data = Hawkish Fed = Bearish for Gold
Weak data = Dovish Fed = Bullish for Gold

Report - 25 jully, 2025U.S.–EU Tariff Negotiations Stabilizing Markets
Reports confirm the U.S. and EU are nearing a deal for 15% reciprocal tariffs—lower than the initially threatened 30% by President Trump. This easing of tensions led to moderate equity gains in both blocs, with the Stoxx 600 reaching a 6-week high before closing +0.2%. Pharmaceutical and auto stocks outperformed (Volkswagen +2.3%, Bayer +2.3%).
Forecast: If the 15% deal is finalized by the August 1 deadline, it would remove a key overhang on equities and boost cyclical sectors reliant on transatlantic trade. A failure, however, risks escalation, triggering retaliatory tariffs by the EU on $93bn of U.S. goods, dragging risk assets sharply lower.
DXY Outlook: Tariff de-escalation boosts safe-haven flows and investor optimism, supporting USD strength.
S&P 500: Short-term relief rally expected if the 15% tariff framework is signed. However, margin compression risks remain from lingering supply chain disruptions.
Tesla vs Trump: Policy Shock Rattles EV Sector
Elon Musk warned that Trump's anti-EV stance and trade war posture will sharply erode Tesla’s regulatory credit revenue and remove the $7,500 EV tax credit. Tesla's stock has cratered 37% since December, with a sharp 8% drop yesterday. Adjusted Q2 net income was down 22%, revenue -12%.
Risk Forecast: Loss of EV subsidies + political fallout between Musk and Trump could drag Tesla further and dampen broader EV sector growth.
XAUUSD: Rising political uncertainty and risks to the U.S. tech sector may drive safe-haven flows into gold.
Dow Jones: Tesla's underperformance and anti-EV policies could limit industrial sector gains.
ECB Holds Rates Amid Trade Risk Fog
The European Central Bank paused its easing cycle, holding the benchmark rate at 2%. Lagarde emphasized a "wait-and-watch" stance, signaling uncertainty due to unresolved trade talks and tariff volatility.
Market Implication: Eurozone government bond yields rose (10Y Bund at 2.70%), paring rate-cut bets. The euro softened to $1.1760.
EURUSD: Lack of further ECB accommodation and weaker consumer confidence amid trade frictions.
Fed Independence in Jeopardy? Market Confidence Wobbles
Pimco warned that White House pressure on Fed Chair Powell—including potential firing and scrutiny over $2.5bn HQ renovations—could destabilize markets. Trump continues pushing for aggressive 1% rates, diverging from current 4.25–4.5% levels.
Fiscal/Political Implication: Undermining Fed autonomy risks flight from U.S. bonds, undermining monetary policy credibility and capital inflows.
USDJPY: Yen may gain if markets lose faith in U.S. institutional integrity, despite rate differentials.
DXY: Temporary support from yields, but structural downside if Fed credibility erodes.
Deutsche Bank and BNP: Diverging Strengths in Volatile Landscape
Deutsche Bank posted its strongest Q2 in 18 years, driven by litigation charge reversals and stable investment banking performance. BNP Paribas also reported solid FICC trading (+27%), though equity trading lagged due to weak derivatives demand.
Equity Implication: Strong capital returns and stable European banking profitability support DAX resilience amid trade noise.
DAX: Boosted by banking and auto outperformance.
China–EU Trade Strains Escalate
Von der Leyen directly confronted Xi Jinping over trade imbalances and support for Russia. EU exports to China are down 6% YoY while Chinese imports to the EU are up 7%. Xi defended Beijing’s stance, warning against "decoupling" rhetoric.
Geostrategic Implication: EU may escalate anti-dumping and export control measures. Markets may see renewed volatility in European industrials and luxury sectors reliant on China.
XAUUSD: Rebalancing of power and heightened East–West tensions favor gold.
Oil Oversupply Warning from TotalEnergies
Total warned of an oil glut due to OPEC+ production increases and weakening global demand. Q2 profits fell 30% YoY. Brent now likely to stay within $60–70 range barring major geopolitical flare-ups.
Crude Oil: Short- to medium-term downside risk with soft demand and oversupply fears.
Energy Stocks: Dividend maintenance remains but debt levels and margin pressures may weigh.
AI Spending Surges – Alphabet and SK Hynix
Alphabet posted a 19% Q2 profit jump as AI integration boosts search volumes. Google’s cloud revenues rose 32%. Capex raised to $85bn. SK Hynix also posted record revenues from high-bandwidth memory chip sales, extending its lead over Samsung.
S&P 500: AI-driven earnings upside bolsters tech sector. Expect multiple expansion in mega-cap AI-exposed names.
XAUUSD : Robust AI investment supports risk appetite but inflationary fears could lift gold marginally.

Gold Ends Rally, Focus Shifts to Fed MeetingGold slipped, snapping a three-day rally. The retreat came after the U.S. struck trade agreements with Japan, the Philippines, and Indonesia, easing safe-haven demand. The latest deal with Japan includes 15% tariffs and expanded U.S. access. Still, unresolved tensions with the EU and anticipation ahead of next week’s Fed meeting are keeping investors on edge.
Resistance is at $3,400, while support holds at $3,375.

XAUUSD SELL 3428On the 4-hour chart, XAUUSD stabilized and rebounded, and short-term bulls took the lead. At present, we can pay attention to the area around 3428, which is a potential short position of the bearish bat pattern, and this position is in the previous supply area.

DeGRAM | GOLD correction from the resistance line📊 Technical Analysis
● Repeated rejections at the channel mid-band (3 346) and the higher swing-highs marked by red arrows form a descending wedge inside the bigger rising channel.
● Price has slipped back under the intraday up-trend and is tracking a fresh 30 m falling channel; a close below 3 328 completes the bear setup and points to the lower channel rail / former bounce base at 3 296.
💡 Fundamental Analysis
● US retail-sales surprise (+0.5 % m/m) lifted 2-yr Treasury yields while Fed’s Daly warned “inflation progress isn’t enough”, reviving dollar demand and capping bullion.
✨ Summary
Short 3 340-3 345; sustained trade beneath 3 328 opens 3 296 → 3 255. Thesis void on a 30 m close above 3 355.
-------------------
Share your opinion in the comments and support the idea with a like. Thanks for your support!

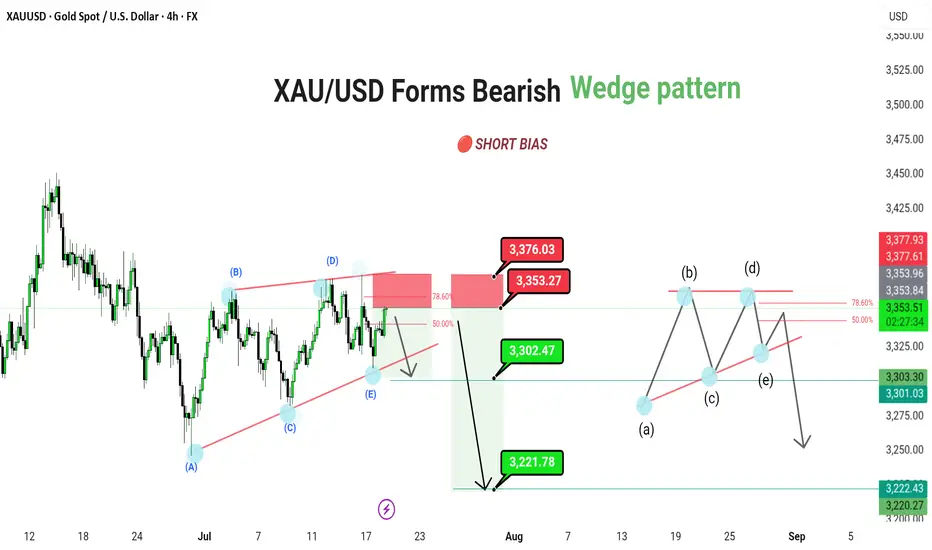
XAU/USD Forms Bearish Continuation Triangle – Future Downside
XAU/USD (4H) | FX | Gold Spot vs US Dollar
🔴 SHORT BIAS
📅 Updated: July 18
---
🔍 Description
Gold is trading within a bearish contracting triangle, suggesting a continuation move to the downside after the recent corrective bounce. Price is currently approaching the key 3,371–3,376 resistance zone, which aligns with the 78.6% Fibonacci retracement and upper triangle boundary.
This resistance confluence could mark the termination of the (E) wave of the triangle, paving the way for a larger downward thrust. A confirmed break below 3,302 would open the door toward 3,221 as the next major target.
The structure also leaves room for a minor internal triangle (a)-(b)-(c)-(d)-(e) pattern within the broader range, reinforcing the bearish setup.
---
📊 Technical Structure (4H)
✅ Bearish contracting triangle: (A)-(B)-(C)-(D)-(E)
✅ 78.6% Fibonacci + supply zone = ideal rejection point
✅ Internal triangle projection aligns with lower support test
📌 Downside Targets
Target 1: 3,302.47
Target 2: 3,221.78
🔻 Invalidation: Above 3,376.03
---
📈 Market Outlook
Macro View: Rising real yields and cooling inflation reduce gold’s appeal
Fed Watch: Hawkish tone supports USD, weighing on XAU
Technical View: Structure favors downside break from triangle formation
---
⚠️ Risks to Bias
Break and daily close above 3,376.03 invalidates triangle structure
Sudden risk-off sentiment or dovish Fed shift could boost gold demand
Sharp reversal in dollar strength
---
🧭 Summary: Bearish Breakout Setup Forming
XAU/USD is completing a bearish triangle structure, with price sitting just below resistance. A rejection from the 3,371–3,376 zone can trigger a breakout lower, first toward 3,302, then extending to 3,221. As always, confirmation and tight risk control are key.
---
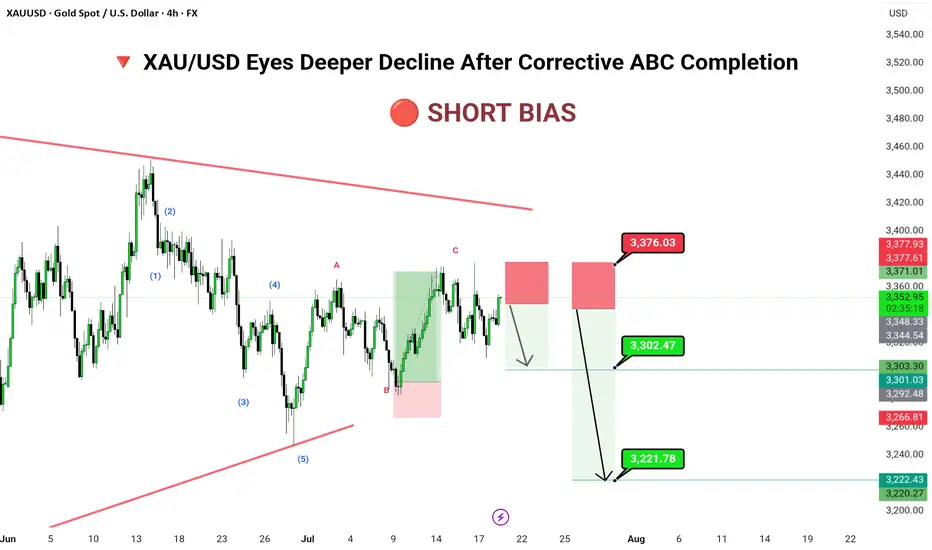
XAU/USD Eyes Deeper Decline After Corrective ABC Completion🔻 📊 Technical Structure (4H)
✅ 5-wave bearish impulse completed
✅ ABC correction likely completed
✅ Supply zone: 3,371–3,376
📌 Downside Targets
First: 3,302.47
Final: 3,221.78
🔻 Invalidation Zone
Above: 3,376.03 (Break above invalidates short scenario)
---
📈 Market Outlook
Macro Context: Gold faces pressure amid rising real yields and stronger dollar flows.
Technical Context: Price trapped within a long-term descending wedge; corrective rally meets resistance.
Risk Appetite: Risk-on tone limits safe-haven demand in short term.
---
⚠️ Risks to Watch
Breakout above 3,376 may trigger bullish breakout
Dovish Fed tone could reverse short-term USD strength
Geopolitical tension reviving gold demand
---
🧭 Summary: Bearish Structure in Play
XAU/USD has completed a textbook ABC retracement and now sits inside a key shorting zone. A rejection here opens space for significant downside toward 3,221. Traders should watch closely for bearish confirmation before committing to positions, with stops tightly placed above 3,376.
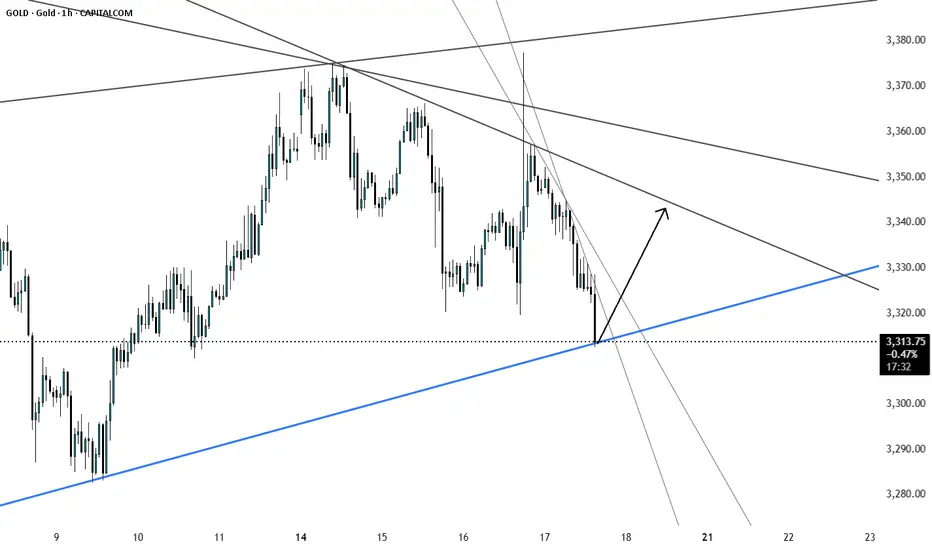
GOLD at support Gold price has reached the support level from where price has pulled up several time and price will soon may go up. Liq grab. SL3300.
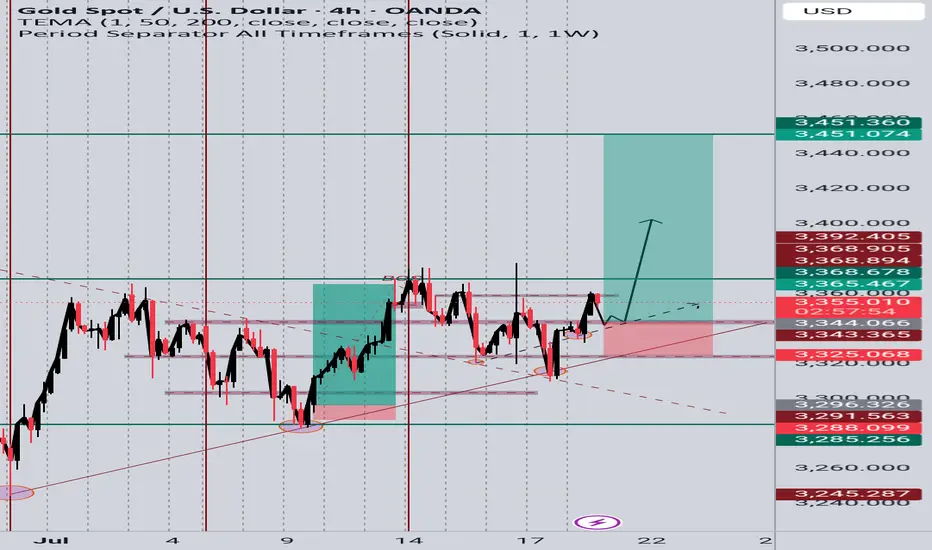
GOLD (XAUUSD) Long Idea – Breakout Confirmation📆 Timeframe: 4H
📈 Type: Long (Buy)
🎯 Entry: Around 3348-3355
🎯 Target: 3451
NOTE: Price has respected the ascending trendline from early July.
Clean breakout from a consolidation range after several rejections near 3365 resistance.
Bullish structure confirmed with higher lows and higher highs.
Fibonacci levels and support zone at ~3344 are holding strong.
Targets set at prior resistance zone (~3451), aligning with liquidity zone.