XAUUSD:Sharing of the Latest Trading StrategyAll the trading signals today have resulted in profits!!! Check it!!!👉👉👉
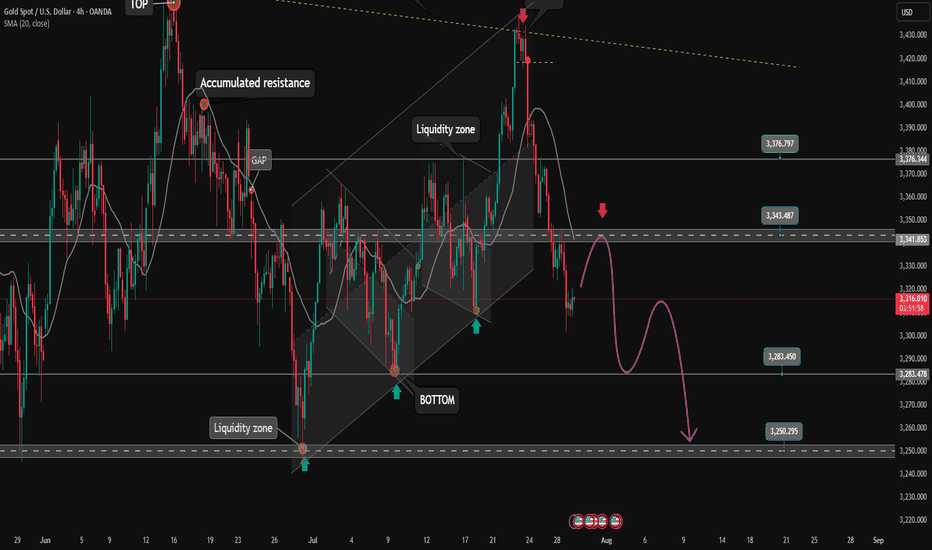
The international gold price reversed its earlier upward trend. Trump signed a trade agreement with the UK, which dampened market sentiment. In terms of the trade agreement, any cooling down of the trade war and reduction of uncertainties are bearish for gold. Pay attention to the resistance at 3,370. If it fails to break through, just wait for a rebound and then go short, with the target set at the support level of 3,300 below.
Trading Strategy:
sell@3370-3360-3350
TP:3320-3300
The signals in the Signature have brought about continuous profits, and accurate signals are shared every day. Hurry up and click to get them!
👇 👇 👇 Obtain signals👉👉👉
XAUUSD trade ideas
Pay attention to 3360 and go short if it does not break🗞News side:
1. China and the United States hold talks on trade issues
2. India-Pakistan conflict escalates again
3. Geopolitical risks
📈Technical aspects:
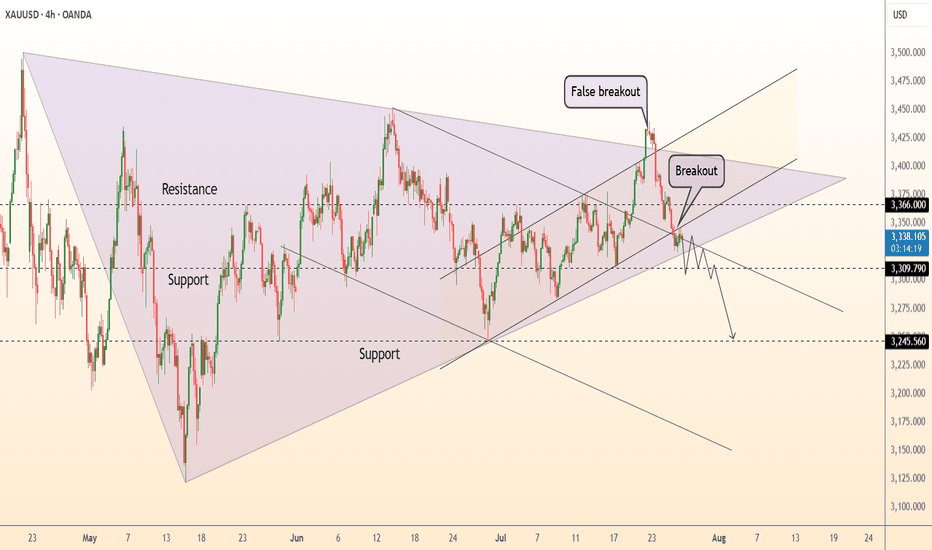
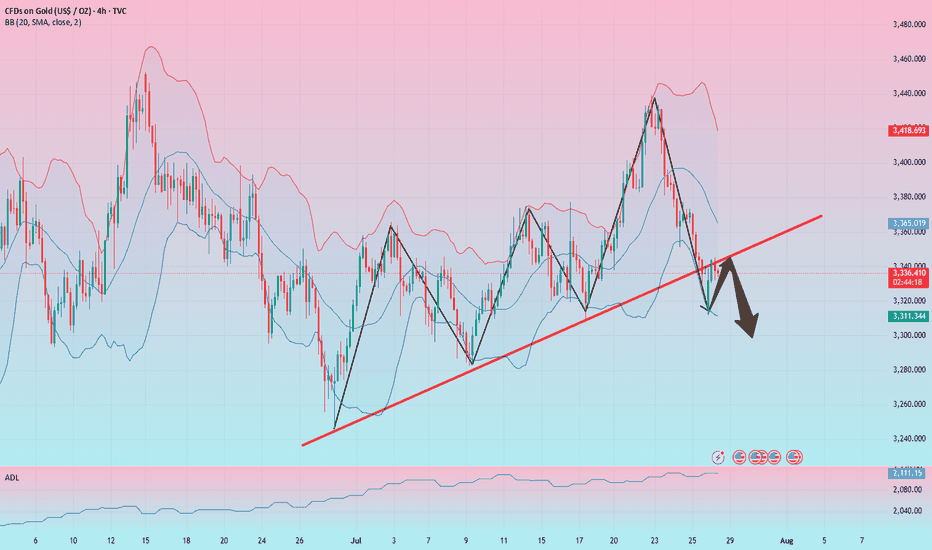
At present, gold has fallen below the trend line support. In the short term, we should focus on the battle for 3360. This point is not only the previous support-to-resistance level, but also the key signal for judging the trend reversal. If it cannot hold on to this position, the short trend will continue; if it recovers effectively, it may return to above 3400. Before losing the defensive line (the last starting and falling point) 3360-3362, the bears will still have the upper hand. It just so happens that the 4H lifeline is also in the 3360-3362 area. If the suppression is successful, the price will enter the 3362-3284 area from the lifeline to the lower track.
The rebound layout of the US market operation is short-selling, with the target at 3340-3330, and further support at 3310-3300.
If you agree with this view, or have a better idea, please leave a message in the comment area. I look forward to hearing different voices.
TVC:GOLD FOREXCOM:XAUUSD FXOPEN:XAUUSD FX:XAUUSD OANDA:XAUUSD
Tariffs, Fed & 3360 Line: Short-Term Bearish Gold Analysis📈 Tariff and International Relations: The Key Drivers of Gold Price 🌐
At present, the most crucial factors affecting the gold price are still the tariff situation and international relations. These global dynamics can quickly shift market sentiment, making gold a barometer for economic and geopolitical stability. Tensions often send investors flocking to the safety of gold, while diplomatic breakthroughs can ease its appeal. 📉💼
⚖️ 3360: The Pivotal Divide Between Bulls and Bears 📊
As things stand now, 3360 has clearly become an important dividing line for the game between the bulls and the bears. Technical analysts and traders closely monitor this level day and night. A decisive break above 3360 could fuel a bullish rally, while a drop below might unleash bearish momentum. 🚀📉 Every tick around this number draws intense attention from the trading community. 👀
📰 Real - Time News Shaping the Gold Market 📢
A series of real - time developments, such as the information released by the Federal Reserve, the remarks of Jerome Powell, and the agreements on tariffs signed between the UK and the US, are all influencing the trend of the gold market. Each central bank statement or trade deal announcement can send shockwaves through the market, triggering rapid price movements. Traders constantly refresh their news feeds, ready to react at a moment's notice. 💻⏱️
🌍 Future Outlook: A Bearish Short - Term Trend 📉
With the development of the situation, the tariff issue is likely to be further alleviated in the future. Based on this, from a short - term perspective, the gold price shows a bearish trend. However, long - term investors should also keep an eye on other variables like inflation rates and geopolitical flashpoints that could potentially reverse this trend. After all, the gold market is full of surprises! 🎯🔮
⚡️⚡️⚡️ XAUUSD ⚡️⚡️⚡️
🚀 Sell@3360
🚀 TP 3340 - 3320
Accurate signals are updated every day 📈 If you encounter any problems during trading, these signals can serve as your reliable guide 🧭 Feel free to refer to them! I sincerely hope they'll be of great help to you 🌟 👇
XAUUSD - Entered Massive Supply Zone! Will It Dump or Break OutGold (XAUUSD) is currently trading at $3,429, testing a major supply zone on the 15-minute chart. Price has rallied over +2.84% today and is now facing a key resistance area that previously triggered sharp sell-offs.
Key Technical Zones:
Supply Zone (Resistance): $3,420 - $3,440
Price is now reacting to this heavy-volume resistance area. Watch for rejection or breakout confirmation.
Mid-Level Support: $3,344
Strong structure level where previous consolidations and rejections occurred.
Demand Zone (Support): $3,223 - $3,227
Price bounced from here with a strong bullish impulse. This is our major demand base.
What to Watch:
Bearish Scenario: Rejection from supply zone could send price back toward $3,344, then $3,227.
Bullish Breakout: Clean break and retest above $3,440 opens the door to new highs.
Confirmation Tools:
LuxAlgo's Supply & Demand Visible Range shows clear institutional activity in these zones.
Look for candlestick confirmation, volume spikes, or divergence signals for entries.
My Plan:
Watching closely for short setups near $3,440 unless we get a confirmed breakout. If rejected, I’ll target the $3,344 and $3,227 zones.
---
What do you think? Will gold break out or get rejected hard again?
Like and share if you find this helpful — let’s grow together!
Gold will form a double top next week and then fall toward 2600.Gold will form a double top next week and then fall toward 2600.Of course, everything is hypothetical. If the correction trades time for space, it may not fall as much. It could consolidate sideways for a long time. In short, I think the uptrend has paused for now. If a double top forms next week, it’s a good opportunity. Let’s wait and see.
Is GOLD still rising star? XAUUSD AnalysisHello everyone!
i Want share my idea about gold price action.
End of April we had some correction but beginning of May it still has buyer and why? at global market we see still misunderstanding, America and China still talk about rates, final talk will be soon between that to giant country, Russia-Ukraine war plus we have very hard situation between India and Pakistan, everyone was expecting peace, after trump inauguration, but how we see we are still far, no one knows what will be next and for big investors gold is safest place to invest money. If we look at gold for long term we can see it has pretty strong bull run.
For me i have other view - China and America will deal about rates, which will give market better view, i think before it will happen, Gold will test new High, where it will find sellers and from there we will have 2 quarter Bearish trend. New high will be between 3500 - 3550, also if we look at Dollar index (DXY) at 1D chart it found buyers and slowly showing reversal, but don't forget 1W chart because there we had 1W consolidation from 2023 and the last fall was stronger than other falls, at technical it tested weekly Fair Value Gap, but i cant see any reason yet for fall.
I think Gold will show us new high which will be between 3500 - 3550 and then we will get bearish trend and we will see correlation with dollar and dollar will start bullish trend.
With technical i will use simple technic, gold tested today daily fair value gap and it got strong reaction, we have resistance + 2h FVG but for me it will be not hard for gold to brake it.
This analysis is from my experience, i am not financial advisor.
FOR COLLABORATION TEXT ME !
ALWAYS MAKE YOUR OWN RESEARCH !
Gold maintains gains near new record highsTechnically, gold's recent rally was remarkably rapid, in search of 3,420 and 3,500, leaving few clear entry points for new buyers. Now, with prices slightly correcting, traders may see this as a potential opportunity for a comeback. The 3,350-3,360 area stands out as a critical support zone. If prices remain above this area, the market may consolidate before attempting to move toward its recent highs. However, a break above this area could lead gold to test 3,330, a pivotal technical support level that could serve as a starting point or signal the beginning of a deeper correction.
Gold is expected to pull back, short gold!Fundamentals:
Focus on the Fed's interest rate decision and Powell's speech;
I think the Fed will keep the interest rate decision unchanged this time, at least it will not announce a rate cut this time, which may suppress the gold market;
Technical aspects:
Before the Fed's interest rate decision, gold is currently in a volatile state. However, relatively speaking, it is currently in a volatile and bearish state, with short-term resistance in the 3395-3405 area; and gold has repeatedly tested the 3370-3360 below during the retracement process. After multiple tests, gold may be more likely to break through this support area; the key support below is in the 3360-3350 area, followed by the 3320-3310 area.
Trading strategy:
Consider shorting gold in the 3395-3405 area, TP: 3370-3360
PATIENCE WILL PAY OFF 〉LONG TERM BUY COMING SOON.As illustrated, I'm trying to visualize what the next couple of weeks could look like.
Taking into consideration the fact that May + June are corrective months for gold historically (don't believe me; check the seasonality tool...) , Is likely for price to range up and down within quite a wide range anywhere between 3300 and 3100 before it enters a bullish continuation impulse by the end of June and into first week of July.
( I have illustrated 2 potential buying areas; one closer to price and another extended one lower )
That being said, one must adapt to such market conditions that will only offer certain structure offering a few intraday trades, but mostly short term trades or quick scalping moves all within a same trading session, simply because as each session comes in, they will target previous sessions highs or lows (ranging back and forth in an uncomfortable manner and without a clear direction).
Asia would target Sydney's open, then London might target Asia's open, then NY might target any low or high in the opposite direction... and so on back and forth without truly holding a bullish or bearish structure longer than a few hours to a full calendar day before it turns around (sideways behavior).
As price reaches "stronger psychological" price levels like 3150, 3100, 3050 and potentially 3000; then you might start seeing evident rejections within higher timeframes (4H and 1D); ideally seeing rejection wick/s followed by a nice push up showing true power and volume to the upside, potentially signaling the bottom of this correction phase.
TIME should be aligned with this market behavior; that means that checking the seasonality tool. every year (on average 5, 10 and 15 years), gold makes a bottom during the first week of JULY ...
So... market structure, price, and time must be aligned correctly and it will all make sense whenever that moment comes; hence, the title of this idea.
I am personally not worried about any sort of economic event; news are only gas for the market to move and create liquidity and volatility.
AT THIS POINT, THE ONLY THING THAT COULD TRIGGER A SIGNIFICANT MOVE IN GOLD, IS A GEOPOLITICAL EVENT THAT WOULD TRULLY TRIGGER UNCERTAINTY IN THE MARKETS... .
--
GOOD LUCK!
Persaxu
XAUUSD – 30m Precision Buy from 79% Fib + Liquidity Grab📈 GOLD LONG CONTINUATION – May 7, 2025 | Smart Money Masterclass
Here’s a 🔥 textbook entry on XAUUSD, showing exactly how Smart Money engineered liquidity, tapped into the Fair Value Gap, and launched the price from deep Fib levels.
Let’s break this down like a true Chart Ninja:
🔍 KEY CONFLUENCES IN THIS SETUP:
🧠 FVG Respect: Perfect reaction from the imbalance zone (gray box)
💰 Liquidity Sweep: Triple low fake-out → "Buy-side Engineered Liquidity" ($ symbols)
📉 Descending Trendline Break: Acting as a final bear trap
🧲 Fib Retracement: Entry from deep golden pocket zone (between 70.5% and 79%)
📊 50% EQ Magnet Above: Price reacting towards premium inefficiency
🚀 Risk-Reward Setup: ~1:6 RR targeting imbalance fill around $3435
🏗️ Structure: Price built a base with multiple accumulation candles before break
📈 Trade Details:
🟢 Entry Zone: $3,388 – $3,393 (limit filled within FVG + Fib zone)
❌ SL: Just below 79% zone at $3,386
✅ TP: $3,435 (0% Fib level / top of the range + inefficiency)
📈 RRR: ~1:6 sniper level precision
⚙️ Execution Strategy:
Confirmation entry after inducement wick
FVG + Fib overlap = High probability zone
Optional scaling in across zone: 70.5%, 75%, 79%
First partials around $3,412, full TP at $3,435 zone
💬 Chart Ninja Quote of the Day:
"The best trades don’t chase price—they wait for price to chase them."
🔒 SETUP SUMMARY:
Timeframe: 30m
Bias: Bullish
Entry Type: Limit
Confluences: FVG + Fib + Liquidity Sweep
Trade Type: Reversal from Demand
Confirmation: Structure shift + Clean W bottom
💾 Save this setup and study it frame-by-frame.
📲 Share it with your trading crew who still think breakouts are reliable 😉
Is gold ready for a bearish position??🔶Hello friends.
🔸If we want to check the trading position on the gold chart, according to my swing trading strategy, a suitable bearish position is forming.
🔶Follow me so you don't miss out on more opportunities I've decided to share with you from now on. I love you and I want you to love your money and trade carefully.
GOLD (XAUUSD): Retest of ATH Soon!Gold broke through a daily significant horizontal resistance level yesterday and closed above it.
It appears that the bullish trend is likely to continue, with the price expected to retest its all-time high soon.
After reaching this level, be prepared for a potential breakout that could drive prices even higher.
Daily Analysis- XAUUSD (Tuesday, 6th May 2024)Bias: Bullish
USD News(Red Folder):
-None
Analysis:
-Strong bullish momentum
-Looking for price to reach 0.618 fib level
-Potential BUY if there's confirmation on lower timeframe
-Pivot point: 3300
Disclaimer:
This analysis is from a personal point of view, always conduct on your own research before making any trading decisions as the analysis do not guarantee complete accuracy.
5/9 Gold Trading SignalsLong time no see, my friends! My holiday trip is about to end. I attended two weddings during this trip, which was unforgettable! I hope that everything goes well for everyone during my absence!
Gold has risen recently and returned to above 3400 again. Although it has fallen back in the past two days, the current technical level shows that the bulls are not over yet! This means that if there are friends who buy at high prices, they will have a chance to get out of trouble without doing other operations!
From the current pattern, it is in the stage of triangle consolidation. It is necessary to pay attention to the resistance of the 3360-3382 range. If the price falls under pressure at this position, we need to observe the support of the 3300-3280 range to determine whether it can form a short-term double bottom pattern or a head and shoulders bottom pattern again, so as to support the bulls to run again.
Based on the above analysis, today's trading suggestions:
Sell in the 3364-3386 range
Buy in the 3318-3302 range
Flexible trading in the 3323-3362 range
[ TimeLine ] Gold 5-6 May 2025📅 Today is Friday, May 2, 2025
📌 Upcoming Signal Dates:
May 5, 2025 (Monday) or
May 5 & 6, 2025 (Monday & Tuesday)
🧠 Trading Plan & Notes:
✅ Gold has undergone a significant reversal of over 2000 pips, from its ATH of 3500 down to 3200
⚠️ If the upcoming Hi-Lo range is wide, consider reversal entries or setups based on Fibonacci retracement levels
✅ I will personally be trading both signals as part of my research and ongoing strategy
⚠️ If you're risk-averse or uncertain, it’s okay to skip the May 5–6 signals
📋 Execution Plan:
🔹 Wait for the price range from the selected candles to fully form (marked by green lines on the chart)
🔹 Entry will be triggered upon breakout, including a 60-pip buffer
🔹 If SL is hit, cut/switch and double the position on the next valid setup for potential recovery
📉📈 Chart Reference:
🔗 Copy & paste this code into TradingView URL: TV/x/C5zZyXar/
Fibonacci Confluence Fuels Gold’s Next Rally: Wave (Y) InsightThis 4-hour chart of XAU/USD is showcasing a WXY corrective pattern, a classic double zigzag (W)-(X)-(Y) correction after a strong impulsive move
Wave (W) has topped, marking the end of the first corrective leg.
A deep correction into the 0.5 Fibonacci retracement level occurred with wave (X), forming a potential higher low within the red demand zone.
Now, wave (Y) is anticipated, which typically mirrors or slightly exceeds the length of wave (W) but in a more corrective format.
Target 1: 3292.629
Target 2: 3372.161
Stop loss: 3201.955
Should we go long on gold when it falls back?From a technical point of view, the daily line has been in negative trend, which is definitely weakening. Whether the market will continue in the future needs to be observed. If it is established, the lower side may be seen at 3260 and 3200, but if the daily line is positive on Friday, it can also turn strong at any time. After all, the current price is just near the middle track of the daily Bollinger, and both rise and fall are possible.
In the 4-hour cycle, we should pay attention to today's closing situation. The price is temporarily around 3300. If it continues to fall, the lower track of Bollinger will open, which may form a unilateral trend, rebound, and Bollinger will close, and it will rise strongly again. Therefore, it is not easy to say the specific rise and fall situation for the time being. It is recommended to observe more to see whether the Asian and European sessions break the new low of 3288, and the upper pressure is 3350 and 3370. In the morning, gold rose first and then fell, and it was quite fierce. It is recommended not to chase orders. Pay attention to the support of 3288 first. If it does not break, try to go long. If it breaks, it will go to the low point of 3260. It is expected that gold will have another wave of rising space on Friday.