DeGRAM | GOLD will retest the channel boundary📊 Technical Analysis
● Fresh rejection at the blue resistance line (~3 435) pushed XAU back to the 3 355 mid-band, yet successive higher-lows (green arrows) keep price inside the May-origin rising channel.
● The pullback is probing 3 328-3 355 — confluence of the former flag roof and triangle top; holding this zone should launch another test of 3 400/3 435, with the channel crest targeting 3 500.
💡 Fundamental Analysis
● U-S S&P-Global PMIs softened, nudging 2-yr real yields to three-week lows, while cautious ECB rhetoric limits dollar gains — both supportive for gold.
✨ Summary
Long 3 328-3 355; above that aims 3 400 ➜ 3 435, stretch 3 500. Invalidate on an H4 close below 3 293.
-------------------
Share your opinion in the comments and support the idea with a like. Thanks for your support!
XAUUSD trade ideas

GOLD (XAUUSD): Bearish Move From Resistance Confirmed
Gold tested a significant confluence cluster on a daily time frame
that is based on a rising trend line and a horizontal resistance.
A double top formation on that on an hourly time frame indicates
a highly probable retracement from that.
Goal - 3378.5
❤️Please, support my work with like, thank you!❤️
I am part of Trade Nation's Influencer program and receive a monthly fee for using their TradingView charts in my analysis.

Gold breaks trendline and returns to uptrend. BUY NOW!✏️ OANDA:XAUUSD A deep sweep to 3310 and bounce back to the trading range. Gold is reacting at the Trendline around the price zone of 3344. This is an important price zone that if broken will return to the uptrend and head towards 3373 soon. 3332 plays an important role in the current bullish wave structure, which is a suitable SL placement point for BUY signals.
📉 Key Levels
Support: 3332-3312
Resistance: 3344-3357-3373-3389
BUY trigger: Break and trading above Resistance 3344 (trendline, top uptrend wave 1)
BUY DCA trigger: Break Resistance 3353
Target 3373
Leave your comments on the idea. I am happy to read your views.

Gold Potential UpsidesHey Traders, in today's trading session we are monitoring XAUUSD for a buying opportunity around 3,310 zone, Gold is trading in an uptrend and currently is in a correction phase in which it is approaching the trend at 3,310 support and resistance area.
Trade safe, Joe.
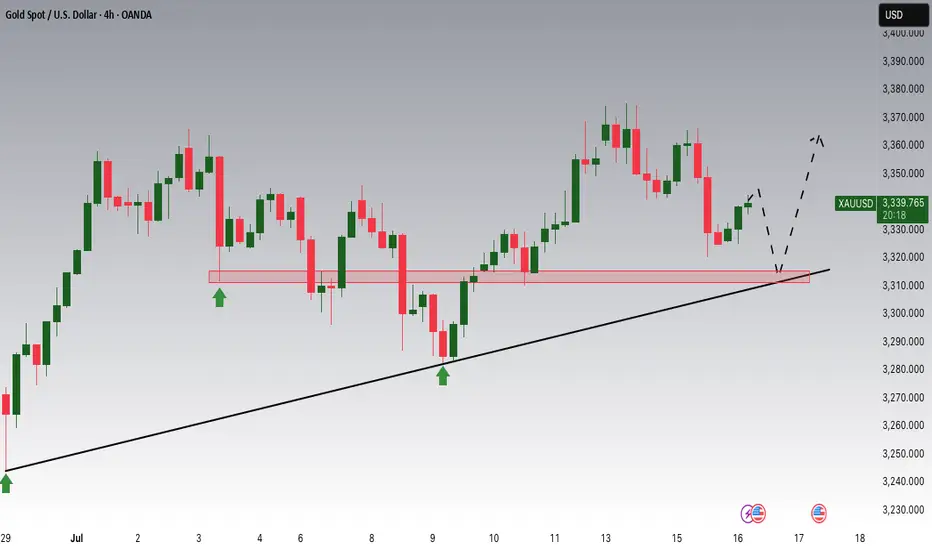
XAU/USD) bullish the support Read The captionSMC Trading point update
Technical analysis of (XAU/USD) on the 4-hour timeframe, indicating a potential bounce from a key trendline support within a rising channel.
---
Analysis Summary
Pair: XAU/USD (Gold Spot vs. USD)
Timeframe: 4H
Current Price: 3,338.715
Bias: Bullish rebound within ascending channel
---
Key Technical Elements
1. Ascending Channel:
Price has been respecting a well-defined rising channel, bouncing between support and resistance levels.
2. Key Support Zone:
The yellow highlighted area marks a critical support level and lower boundary of the channel.
Also intersects with the trendline, strengthening the potential for a bounce.
3. 200 EMA (Dynamic Support):
The 200 EMA at 3,343.616 lies just below current price, acting as a dynamic support level.
4. RSI (14):
RSI is around 34.93, nearing the oversold zone, suggesting a buying opportunity may be near.
---
Target Points
First Target: 3,402.099
Second Target: 3,446.661
---
Trade Idea
Direction Entry Zone Stop-Loss Target Zones
Buy 3,330–3,345 Below 3,320 3,402 / 3,446
Mr SMC Trading point
---
Summary
Gold is currently testing a key support level and ascending trendline. If price holds above this area, we can expect a bullish rebound toward 3,400–3,446 levels, aligning with the upper channel resistance.
Please support boost 🚀 this analysis)

HelenP I. Gold, after small correction, can continue to move upHi folks today I'm prepared for you Gold analytics. If we look at the chart, the dominant feature is a strong, sustained bullish trend defined by a major ascending trend line that has repeatedly served as a reliable foundation for the price, confirming that buyers currently maintain firm control. At present, the price action is consolidating above a crucial horizontal pivot area, the support zone between 3385 and 3400. The significance of this zone is high, as it's a classic polarity point where previous resistance has flipped to become support, suggesting a concentration of buying interest. My core analysis hinges on the scenario of a brief, healthy corrective move down to retest this support zone. I believe this retest is a key market dynamic to confirm buyers' commitment. If the price dips into the 3385-3400 area and is met with a decisive rejection of lower prices, it would provide a powerful signal that the underlying bullish sentiment remains fully intact. A successful defense of this zone would be the primary trigger, creating the momentum for the next upward leg. Therefore, I have set the primary goal for this move at the 3460 level. If you like my analytics you may support me with your like/comment.❤️
Disclaimer: As part of ThinkMarkets’ Influencer Program, I am sponsored to share and publish their charts in my analysis.

GOLD NEXT MOVE (expecting a bullish move)(18-07-2025)Go through the analysis carefully and do trade accordingly.
Anup 'BIAS for the day (18-07-2025)
Current price- 3350
"if Price stays above 3330, then next target is 3360, 3378 and 3407 and below that 3310 and 3280 ".
-POSSIBILITY-1
Wait (as geopolitical situation are worsening )
-POSSIBILITY-2
Wait (as geopolitical situation are worsening)
Best of luck
Never risk more than 1% of principal to follow any position.
Support us by liking and sharing the post.
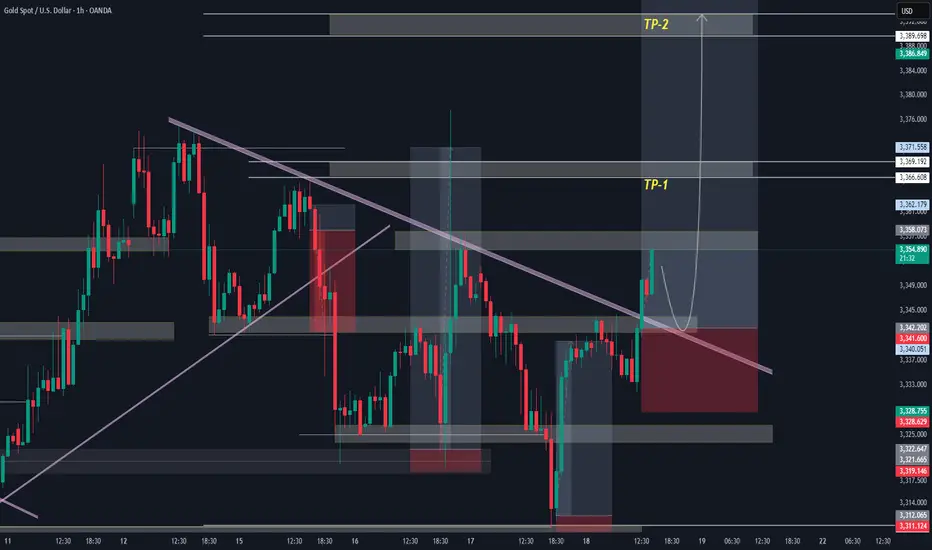
XAUUSD Breakout Structure | Smart Money Bullish Roadmap 🚨 XAUUSD 2H | Smart Money Concept Setup
Price perfectly tapped into demand zone and showed a strong bullish reaction — now forming a clear BOS (Break of Structure).
📍 Key Liquidity Zones:
• Price swept previous lows and is now targeting major liquidity levels marked as “Target Points.”
• Bullish momentum is expected to push price towards 3410 – 3425 range 📈
🔁 Expect possible consolidation before a continuation to upper targets.
💡 Strategy:
Wait for a minor pullback near the 3380–3390 level for confirmation, then ride the momentum to higher targets.
🎯 Target Levels:
1. 3398 ✅
2. 3410 🚀
3. 3425+ (Final Target)
📌 Like, Follow & Save if you caught this early 📊
#XAUUSD #SMC #LiquidityGrab #GoldSetup #TradingViewIdea #SmartMoney #Breakout

Gold in Demand Zone | Target $3,380🚨 GOLD/USD – BIG MOVE LOADING! 🚨
🔍 Price is currently reacting from a major demand zone ($3,340–$3,345) with signs of accumulation and a possible double bottom pattern forming.
📉 After a strong downtrend, this looks like a liquidity sweep and smart money trap — prepping for a reversal back to the $3,380 resistance zone where liquidity resides.
📈 Scenarios to Watch:
1️⃣ Price sweeps support again and reverses hard
2️⃣ Clean structure break above $3,365, followed by a retest
🎯 Target: $3,380–$3,385
🛡️ Invalidation: Strong close below $3,335
⚠️ Confirmation Required! Best entry would be after structural break + retest. Keep your risk tight, and let the market show its hand.
⸻
📌 Key Levels:
• Support Zone: $3,340–$3,345
• Target Zone: $3,380–$3,385
• Invalidation: Below $3,335
⸻
📣 If this setup helps you, like 👍, comment 💬, and follow 🔔 for more high-probability ideas every week!
#Gold #XAUUSD #SmartMoney #LiquidityGrab #ForexSetup #PriceAction #BreakoutTrade #DoubleBottom #TradingView #GoldAnalysis #ForYou #FXStrategy #SupplyAndDemand

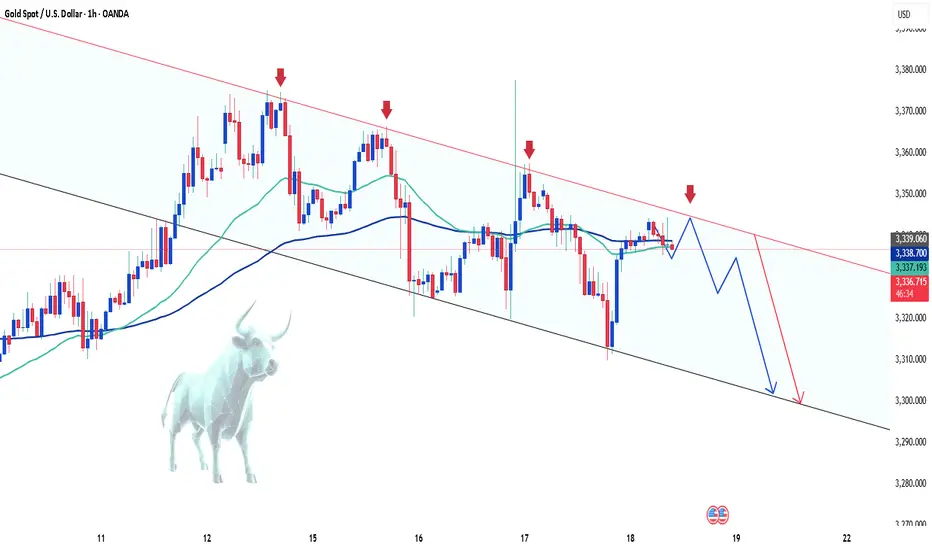
Gold's Short-Term Decline: What's Next?Hello everyone, what do you think about gold?
Today, gold continues its short-term downtrend. After new data was released at the end of yesterday’s trading session, the USD rose by 0.3%, and U.S. Treasury yields also increased, reducing the appeal of gold. Additionally, the latest unemployment claims data shows improvement in the U.S. economy, which has contributed to the drop in the precious metal.
As of writing, gold is trading around the EMA 34, 89 levels at 3,336 USD. With the recent news, the market is expected to maintain its current stance throughout the day, as no new significant updates are expected.
From a technical standpoint, the downtrend remains in place, with prices continuing to be capped below the trendline. The series of lower highs and lows could likely lead XAUUSD to test lower levels, with the possibility of reaching the 3,300 USD mark.
What do you think about the price of gold today? Let us know in the comments!
Pending Orders Are Not Set in Stone – Context Still MattersIn a previous educational article, I explained why I almost never trade breakouts on Gold.
Too many fakeouts. Too many emotional traps.
Instead, I stick to what works:
• ✅ Buying dips
• ✅ Selling rallies
But even these entries — placed with pending orders — are not automatic.
Because in real trading, price is not just a number — it’s a narrative.
And if the story changes, so should the trade.
________________________________________
🎯 The Setup – Buy the Dip Around 3400
Let’s take a real example from yesterday.
In my analysis, I mentioned I would look to buy dips near 3400, a former resistance now acting as support.
Price dropped to 3405, just a few points above my pending buy at 3402.
We saw a clean initial bounce — confirming that short-term support was real.
But I missed the entry by 30 pips.
So far, so good.
But here’s the important part — what happened next changed everything.
________________________________________
🧠 The Rejection Shifted the Entire Story
The bounce from 3405 was immediately sold into at 3420, a newly formed short-term resistance (clearly visible on the 15-minute posted chart).
After that, price started falling again — heading back toward my pending order.
📌 At that point, I cancelled the order. Why?
Because the context had changed:
• Bulls had tried once — and failed at 3420
• Sellers were clearly active and waiting above
• A second drop into my level wouldn’t be a clean dip — it would be retest under pressure.
The market was no longer giving me a “buy the dip” setup.
It was showing me a failed recovery. That’s a very different trade.
________________________________________
💡 What If It Had Triggered?
Let’s imagine that price had hit 3402 first, triggering my order.
Then rebounded, failed at 3420, and started dropping again.
Even then, I wouldn’t hold blindly.
Once I saw the rejection at 3420, I would have understood:
The structure had shifted.
The bullish case is weakening.
Exit early — breakeven or small controlled loss.
________________________________________
🔁 Sequence > Level
This is the most important principle:
• ✅ First down, then up = healthy dip → shows buyers are still in control
• ❌ First up, then down = failed breakout → shows selling pressure is stronger
Two scenarios. Same price. Opposite meaning.
That’s why you should look for:
Not just where price goes — but how it gets there.
________________________________________
🔒 Pending Orders Are Conditional
Many traders treat pending orders like traps:
“Just let price come to my level, and I’m in.”, but you should refine a little
✅ Pending orders should be based on a conditional expectation
❌ Not a fixed belief that the zone must hold
If the market tells a different story, remove the order.
No ego. No drama. Just process.
________________________________________
📌 Final Thought
Trading isn’t just about catching a price.
It’s about understanding price behavior.
First down, then up = strength.
First up, then down = weakness.
Let the market show its hand — then decide if you want to play.
Disclosure: I am part of TradeNation's Influencer program and receive a monthly fee for using their TradingView charts in my analyses and educational articles.
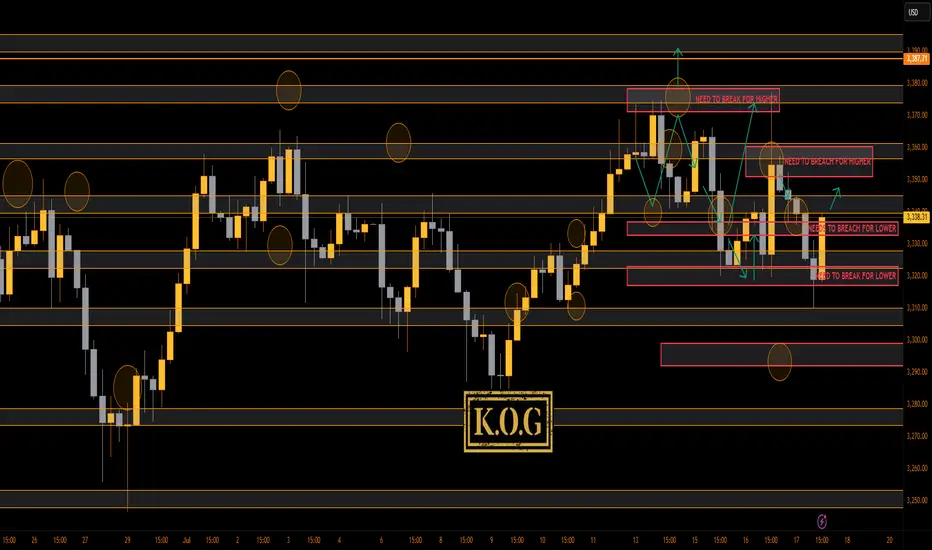
THE KOG REPORT - UpdateEnd of day update from us here at KOG:
Nice! Our idea from yesterday worked well giving the short trade into the level we wanted, to then break below the bias level and give us our 2 Gold Excalibur targets and 1 of our red box targets shared with the wider community. We suggested our traders watch the level of 3310 for a potential RIP, and that's exactly what we got upside.
Now, we have support at the 3330-27 level and resistance above at 3340-3. We have a red box above as well so we'll be waiting to see if the close is significant enough for us to target higher tomorrow! For now, keep an eye on the retracement into the 3335-2 level initially.
RED BOXES:
Break above 3335 for 3341, 3355, 3362, 3370 and 3376 in extension of the move
Break below 3320 for 3310✅, 3304, 3297 and 3294 in extension of the move
As always, trade safe.
KOG
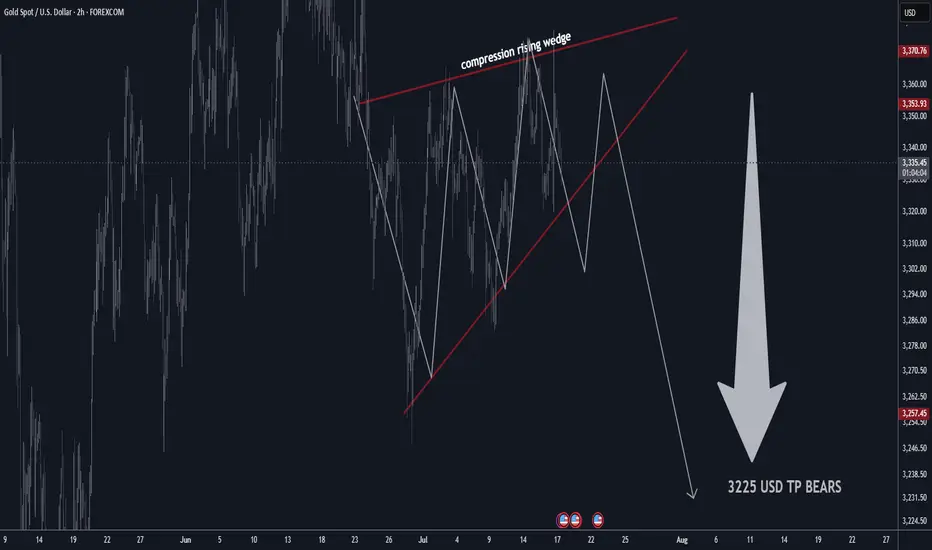
GOLD H2 Rising Wedge Expecting SellOFF TP BEARS 3225 USD📊 Gold Technical Outlook Update – H4 & 2H Chart
📰 Latest Summary Headlines
• Gold stalls near highs as technical compression signals possible breakdown
• Bearish rising wedge on 2-hour chart hints at sharp move lower
• Market volatility stays elevated amid global economic risks
• Short-term sellers targeting $3,225 if wedge pattern breaks
________________________________________
🏆 Market Overview
• Gold remains in a choppy range, struggling to clear key resistance.
• 2H Chart: Bearish rising wedge pattern identified, showing compression—expecting a potential breakdown soon.
• Overhead resistances: $3,410 / $3,460 USD will likely cap further upside.
• Major supports: $3,160 / $3,240 USD.
• If support fails, next key bear target is $3,225 USD.
• Range trading remains favored for now.
• Volatility likely to persist with no major bullish headlines on the horizon.
________________________________________
⭐️ Recommended Trade Strategy
• Bearish Setup (2H): Short sell gold at market on wedge breakdown.
o Stop loss: Above recent highs (set according to your risk tolerance and latest 2H swing high).
o Take profit: Target $3,225 USD.
• Continue to focus on selling near resistance, buying near support.
• Momentum: Watch for sharp moves as wedge resolves—be nimble!
• Always manage risk and adjust stop as price develops.
________________________________________
💡 Gold Market Highlights
• Safe-haven demand still strong due to tariffs, geopolitical tension, and U.S. fiscal concerns.
• Central banks & investors remain net buyers, but jewelry demand slides at high prices.
• Price action is dominated by institutional flows, with banks forecasting potential for gold above $4,000 next year—but short-term correction likely if wedge breaks.
• Current price: ~$3,358 per ounce. Compression suggests a larger move coming soon.
________________________________________
Summary:
Gold is at a crossroads, with a bearish wedge pattern building on the 2-hour chart. A breakdown could see a quick move to $3,225. Short sellers should act on confirmation, while bulls will look to reload at key support. Stay tactical!
GOLD → The triangle is contracting. Retest of support...FX:XAUUSD tested a local high of 3375 but quickly returned to consolidation. The reason is manipulation by the US administration related to Powell, inflation, and interest rates...
Demand for gold has risen sharply amid global risks: Trump's aggressive tariff plans, strong inflation, and uncertainty about the Fed's actions have increased interest in defensive assets. Despite the temporary strengthening of the dollar, gold remains a popular hedging instrument. Technical analysis also points to a bullish outlook. However, growth potential is limited until the Fed clarifies its interest rate policy
Technically, on the D1 chart, it is clear that the price is consolidating, with the range continuing to narrow. Due to the bullish factors listed above, we can expect growth to continue. However, it is difficult to say where and when the growth will begin due to the uncertainty factor. All attention is on the support at 3320-3312, the triangle support, as well as the consolidation support at 3287.
Resistance levels: 3365, 3375
Support levels: 3320, 3312, 3287
Since the opening of the session, the price has spent part of its daily range, so there may not be enough potential for the decline to continue. A false breakdown of support and consolidation of the price above the key zone may attract buyers, which will trigger growth towards resistance.
Best regards, R. Linda!

GOLD Price Can rise catch the ResistanceGold is currently showing strong underlying momentum, although it is undergoing a short-term correction from the 3400 level. This pullback appears to be driven by profit-taking ahead of Fed Chair Jerome Powell’s upcoming speech, as well as uncertainty around U.S. trade negotiations with the EU and Japan expected to conclude before August 1.
Resistance Levels: 3420 / 3440
Immediate Support: 3375
A false breakout below resistance could result in a retest of 3375 before resuming upward momentum.
You can see more details in the chart.
Ps support with like and comments for better analysis Thanks.

GOLD ROUTE MAP UPDATEHey Everyone,
End of week update following up on yesterday’s 1H chart outlook.
✅ 3353 was hit and respected to the pip, just as we mapped out and highlighted yesterday.
We saw the EMA5 cross and lock above 3328, confirming continuation.
The market respected structure beautifully
Rejections gave us clean dip buying entries
EMA5 methodology guided our execution
High probability Goldturn levels played out exactly as planned
Our discipline and patience were rewarded, yet again. Another strong end to the week.
We will now come back Sunday with a full multi timeframe analysis to prepare for next week’s setups, including updated views on the higher timeframes, EMA alignments, and structure expectations going forward.
Thanks again for all your likes, comments, and follows.
Wishing you all a fantastic weekend!!
Mr Gold
GoldViewFX
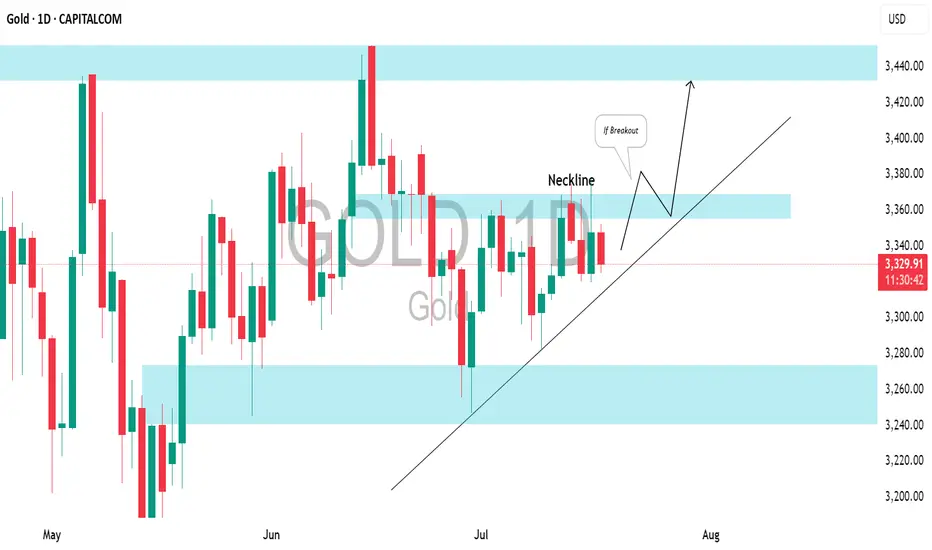
GOLD (XAUUSD): Bullish Accumulation PatternI spotted a clear ascending triangle pattern on a daily time frame.
To validate a bullish continuation, we need a breakout above the neckline.
A daily candle close above 3370 will serve as a strong confirmation, and we can expect a move up to at least the 3440 resistance level.
Hellena | GOLD (4H): LONG to resistance area of 3397 (Wave 3).Dear colleagues, my previous forecast remains valid, but I have decided to update it.
At the moment, I still think that wave “3” of the medium order continues its upward movement.
At the moment, I think that the small correction in wave “2” is ending and we will see a continuation of the trend. I see the resistance area of 3397.94 as the target. The main thing is to overcome the local level of the small wave “1” at 3366.37.
Manage your capital correctly and competently! Only enter trades based on reliable patterns!

XAUUSD 2H | Smart Money Buy from Strong DemandXAUUSD 2H | Support Rejection with Upside Targets 🎯
Price respected the key support zone and is now showing bullish momentum. Two clear target levels are marked above. Ideal buy opportunity after rejection confirmation from demand zone. Watch for clean continuation toward 3370 and 3390.
#XAUUSD #GoldAnalysis #SmartMoneyConcepts #SMC #Forex #PriceAction #BuySetup

GOLD Price Continue to GrowXAUUSD has formed a bullish pattern after successfully testing and holding the strong support zone at 3310, which marked a key demand level. The recent bounce from this level confirms strong buyer interest despite temporary USD strength.
Demand for gold has sharply increased, often seen as a hedge during uncertain economic periods—even with a temporarily stronger dollar. The current price action reflects a bullish continuation pattern, suggesting potential for further upside. targeting will be 3360 3378 / 3400
You may find more details in the chart Ps Support with like and comments for better analysis.
I am Part of Trade Nations Influencer program and receive a monthly fee for using their Trading view charts charts in my analysis.

Gold Correction Finshed ? At fib 0.5 level, bullish wedge Gold was trading in bullish trend, recently price went down from 3400 level and now reached the 0.5 fib and formed bullish wedge and soon price may resume upward.

"Gold Price Reversal Setup: Targeting Bullish Recovery After BOSThis 1-hour gold (XAU/USD) chart shows a potential bullish setup. After a Break of Structure (BOS) and a drop into a support level, price may rebound through the Fair Value Gap (FVG) toward the target zone around 3,431.42–3,436.92. The dotted line outlines a projected bullish move.

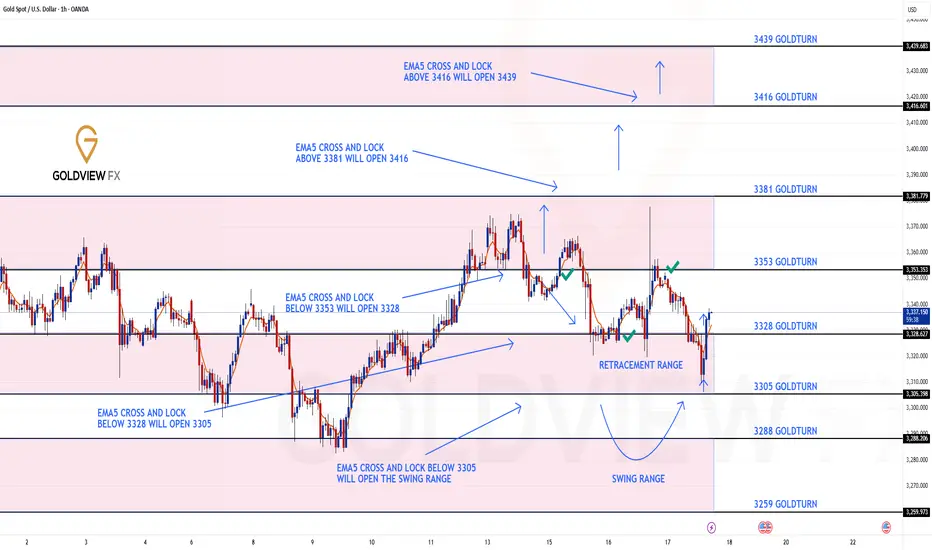
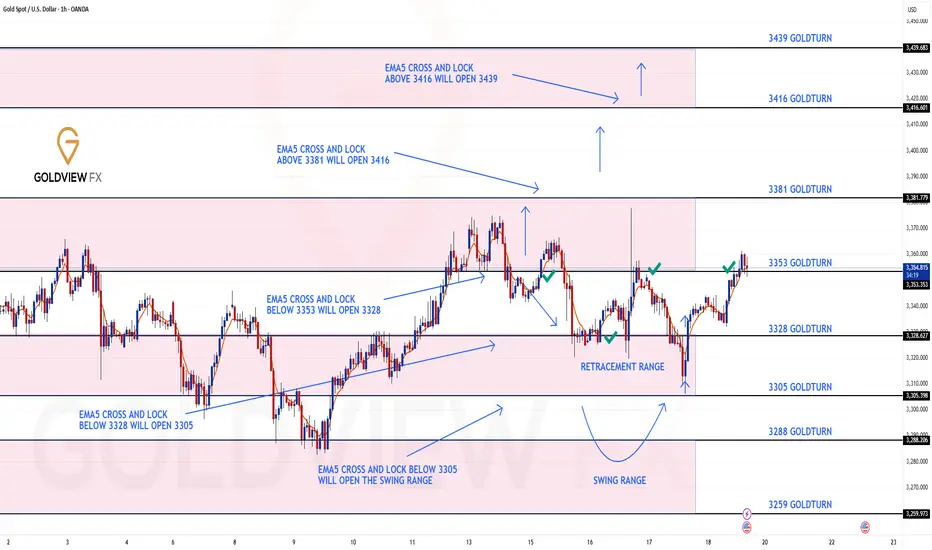
GOLD ROUTE MAP UPDATEHey Everyone,
Quick follow-up on yesterday’s 1H chart update
After hitting 3353, we did not see an EMA5 cross and lock above this level. That lack of confirmation was key and it validated a rejection right at 3353, leading to another drop into the retracement zone.
As per plan, that retracement provided yet another clean bounce, perfectly in line with our dip buying strategy.
We are once again looking toward 3353, and just like before, we will be closely watching for an EMA5 cross and lock confirmation to validate any continuation.
This kind of movement continues to confirm the power of patience, structure, and disciplined execution. No chasing just clean planned executions with high probability setups based on our EMA5 methodology.
We’re also still watching the 3381 gap a key magnet above, and a level we’ve been tracking since the Monday outlook. The roadmap remains unchanged. We’re trading the structure, managing risk, and letting confirmations guide the execution.
Updated Reminder of Key Levels:
BULLISH TARGET
3381
EMA5 CROSS & LOCK ABOVE 3381 opens
3416
EMA5 CROSS & LOCK ABOVE 3416 opens
3439
BEARISH TARGETS
3353 ✅ HIT
EMA5 CROSS & LOCK BELOW 3353 opens
3328 ✅ HIT
EMA5 CROSS & LOCK BELOW 3328 opens
3305
EMA5 CROSS & LOCK BELOW 3305 opens Swing Range:
3288
3259
As always, we’ll continue monitoring and sharing updates, as price reacts around these zones. Thank you all for the continued support, your likes, comments, and follows are genuinely appreciated!
Mr Gold
GoldViewFX