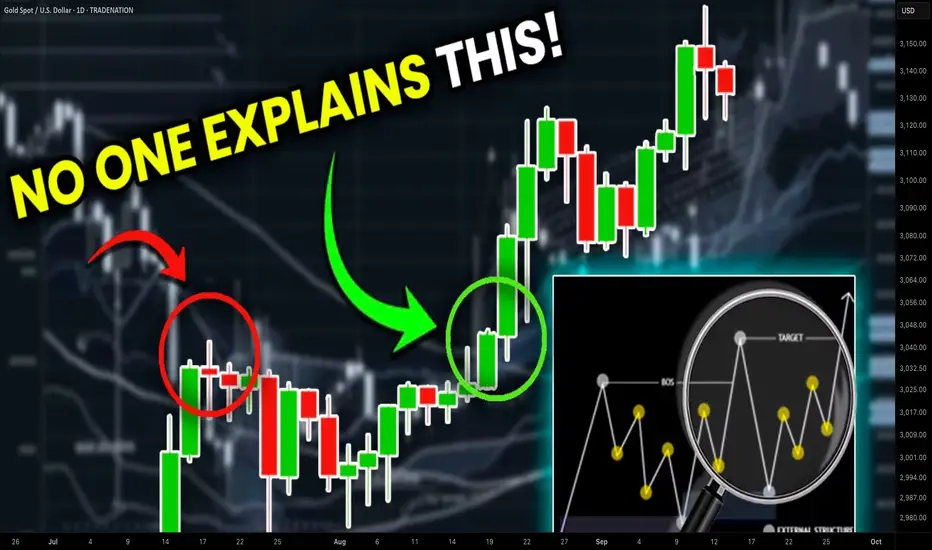
Accurate Price Model for Trading Smart Money Concepts SMC (=
If you trade Smart Money Concepts SMC, there is one single pattern that you should learn to identify.
In this article, you will learn an accurate price model that you can use to predict a strong bullish or bearish movement way before it happens.
Read carefully and discover how to track the silent actions of smart money on any market.
The only thing that you need to learn to easily find this pattern is basic Structure Mapping . After you map significant highs and lows, you will quickly recognize it.
This SMC pattern has 2 models: bullish and bearish ones.
Let's start with a bearish setup first.
Examine a structure of this pattern
it should be based on 2 important elements.
The price should set a sequence of equal lows.
These equal lows will compose a demand zone.
The area where a buying interest will concentrate.
The minimum number of equal lows and lowers highs should be 2 to make a model valid.
Exhausting of bullish moves will signify a loss of confidence in a demand zone . Less and less market participants will open buy positions from that.
At some moment, a demand zone will stop holding. Its bearish breakout will provide a strong bearish signal , and a bearish continuation will most likely follow.
This price model will signify a market manipulation by Smart Money.
They will not intentionally let the price fall, not letting it break a demand zone. A buying interest that will arise consequently will be used as a source of liquidity.
Smart money will grab liquidity of the buyers, silently accumulating huge volumes of selling orders.
Once they get enough of that, a bearish rally will start, with a demand zone breakout as a trigger.
Though, the chart model that I shared above has a strong bullish impulse, preceding its formation, remember that it is not mandatory.
The price may also form a bearish impulse first and for a pattern then.
Each bullish movement that initiates after a formation of an equal low should be weaker than a previous one.
So that the price should set a lower high every time after a formation of an equal low.
Look at a price action on USDCHF forex pair. Way before the price dropped, you could easily identify a market manipulation of Smart Money and selling orders accumulation.
A breakout of a horizontal demand zone was a final bearish confirmation signal.
Let's study its bullish model.
It has a similar structure.
The price should set a sequence of equal highs, respecting a horizontal supply zone.
Each bearish move that follows after its test should have a shorter length, forming a higher low with its completion.
This model will be also valid if it forms after a completion of a bearish impulse.
Weakening bearish movements will signify a loss of confidence in a supply zone, with fewer and fewer market participants selling that.
Its bullish breakout will be an important even that will confirm a highly probable strong bullish continuation.
Smart Money will use this price model to manipulate the market and accumulate buying orders, not letting the price go through a supply zone. They will grab a liquidity of the sellers each time a bearish move follows from a supply zone.
When they finally get enough of a liquidity, a bullish rally will initiate and a supply zone will be broken , providing a strong confirmation signal.
That price model was spotted on GBPJPY forex pair.
Smart Money were manipulating the market, not letting it continue rallying by creating a significant horizontal supply zone.
Selling orders that were executed after its tests provided a liquidity for them.
A bullish breakout of the underlined zone provides a strong bullish confirmation signal.
A breakout and a future rise could be easily predicted once this price model appeared.
Why they do it?
But why do Smart Money manipulate the markets that way?
The answer is simple: in comparison to retail traders, they trade with huge trading orders . To hide their presence and to not impact market prices much, they split their positions into a set of tiny orders that they execute, grabbing the liquidity.
The price model that we discussed today is the example how they do it.
The important thing to note about this pattern is that it efficiently works on any market and any time frame. You can use that for scalping, day trading, swing trading. And it can help you find great investing opportunities.
❤️Please, support my work with like, thank you!❤️
I am part of Trade Nation's Influencer program and receive a monthly fee for using their TradingView charts in my analysis.
XAUUSD trade ideas
GOLD PRICE: 2 BIG OPTIONS.1. Option 1: Wave 4 of gold price ends, with this scenario, the DXY trend will not be like the chart below, but this week DXY will return to the old bottom and head towards 95-91, gold will increase to complete wave (5).
Price range for the next 3-4 months: 3350-3750.
2. Option 2:
In terms of time, wave (4) has not yet ensured balance. DXY increases and recovers as the chart.
That means we have a gold price range for the next 3-4 months of 3400-3100.

GOLD (XAUUSD): Road to 3430
Quick update for my yesterday's analysis for Gold.
The price broke through the trend line with a local Break of Structre BoS,
updating an intraday-high.
The road to 3430 is now empty, and the market will most likely
continue rising steadily to that.
❤️Please, support my work with like, thank you!❤️
I am part of Trade Nation's Influencer program and receive a monthly fee for using their TradingView charts in my analysis.

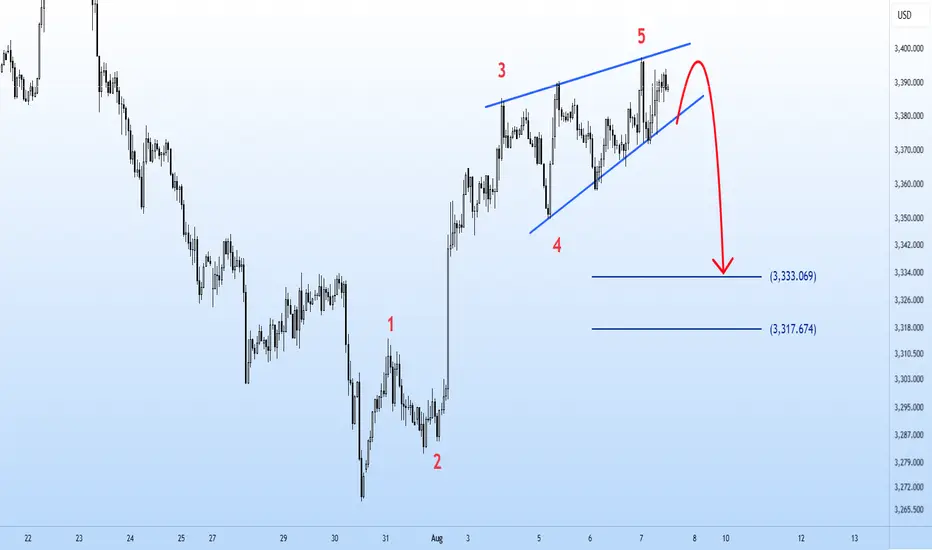
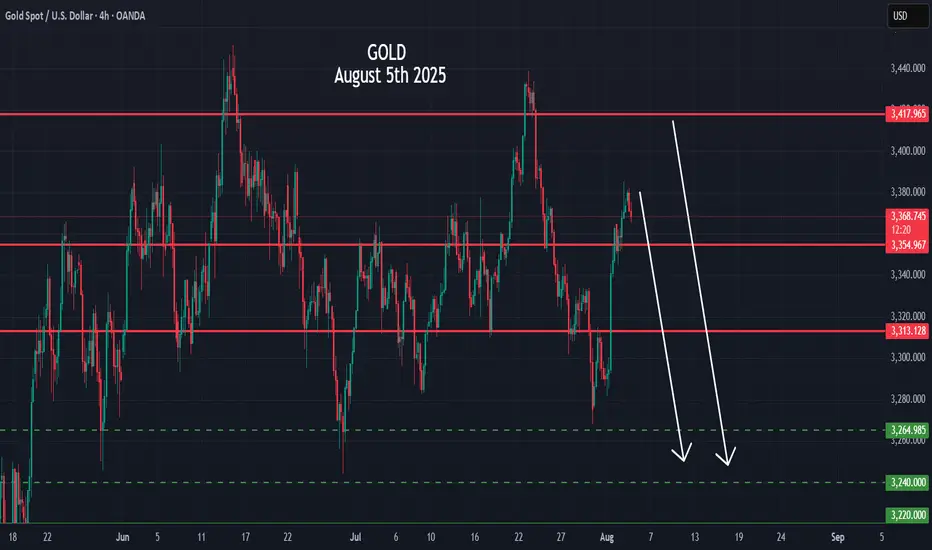
A great opportunity to sell gold!Gold Analysis Short and Medium Timeframe Elliott Wave Analysis Style The gold market has completed five upward waves and is currently at the end of the upward wave. Given the formation of the corner market pattern, it could enter a reversal and decline towards $3,333.
Crystal Ball Forecast for Gold (XAUUSD)🔮 Crystal Ball Forecast for Gold (XAUUSD)
Current Price: 3372
Medium-Term Direction: 🔻 DOWN
✅ My Forecast: GOLD WILL GO DOWN from 3372
🔍 Why? (Technical Reasons Supporting Bearish Outlook)
1. Gann Price Vibration (From recent high ~3385)
3372 = 45° level – key resistance level
Price rejected at 3375–3385 zone multiple times
If 3375 holds as resistance, next vibration levels:
3335 (Gann 45° down)
3284 (Gann 90° down)
3250 (Gann 120° down)
2. Elliott Wave
Looks like Wave 5 (ending diagonal) completed at 3385
Current price at 3372 = classic "after top" trap zone
Next structure likely forming ABC correction or new bearish impulse
Projection:
Wave A → 3335
Wave C → 3280–3250
3. Price Action + Candle Behavior
Strong upper wicks around 3375–3380
Lower highs forming = distribution pattern
MACD & RSI divergence visible on 4H/1D
📉 Medium-Term Bearish Targets
Target Price Reason
3335 Gann 45° down, Wave A low
3284 Gann 90° down, Wave C
3250 Gann 120°, Cycle
3183 Gann 180°, major support
📌 Summary Forecast
✳️ Gold is topping out.
✳️ Bearish move toward 3280–3250 is highly likely.
✳️ Best entry = on rejection from 3375–3380 zone
✳️ Stop = above 3390
✳️ Hold short for 2–3 weeks or until target reached
continue to maintain gold purchase, 3400⭐️GOLDEN INFORMATION:
Gold prices edged higher on Monday, supported by growing expectations of a Federal Reserve rate cut following last Friday’s disappointing U.S. Nonfarm Payrolls report. XAU/USD is trading around $3,375, up 0.39% on the day.
Speculation over a potential policy shift has strengthened, with markets now pricing in an 87% chance of a rate cut at the Fed’s September 17 meeting — a boost for the non-yielding yellow metal.
Last week’s labor data revealed early signs of weakness in the job market. The U.S. Bureau of Labor Statistics (BLS) revised May and June payrolls down by a combined 258,000 jobs, reinforcing dovish remarks from Fed Governor Christopher Waller, who downplayed tariff-driven inflation and emphasized concerns about the Fed’s full employment mandate.
⭐️Personal comments NOVA:
Uptrend, gold price is maintaining stability. Heading towards 3400, before the expectation of interest rate cut is becoming more and more obvious.
⭐️SET UP GOLD PRICE:
🔥SELL GOLD zone: 3415- 3417 SL 3422
TP1: $3405
TP2: $3394
TP3: $3380
🔥BUY GOLD zone: $3311-$3313 SL $3306
TP1: $3325
TP2: $3338
TP3: $3350
⭐️Technical analysis:
Based on technical indicators EMA 34, EMA89 and support resistance areas to set up a reasonable BUY order.
⭐️NOTE:
Note: Nova wishes traders to manage their capital well
- take the number of lots that match your capital
- Takeprofit equal to 4-6% of capital account
- Stoplose equal to 2-3% of capital account

(Gold) Technical Analysis – Buy-Side Correction in PlayGold is currently undergoing a correction on the buy side, with price action suggesting the potential for further upside. The market is showing bullish momentum amid rising global uncertainty.
Dovish Fed Expectations: Increasing speculation around potential Fed rate cuts, along with discussions about leadership changes (including the possible replacement of Kugler and Powell), is contributing to a more accommodative outlook. Geopolitical & Trade Tensions: Continued escalation of global trade conflicts is boosting demand for safe-haven assets like gold, adding to bullish pressure.
If the price holds above the 3370–3380 support zone, bullish continuation toward 3420/3440 is likely in the short term.
You May find more details in the chart.
Ps; Support with like and comments for better analysis

GOLD Breakout Done , Long Setup Valid To Get 150 Pips !Here is My 15 Mins Gold Chart , and here is my opinion , we finally above 3350.00 and we have a 30 Mins Candle closure above it And Perfect Breakout , so i`m waiting the price to go back and retest this res and new support and give me a good bullish price action to can enter a buy trade and we can targeting 100 to 150 pips .
Reasons To Enter :
1- New Support Created .
2- Bullish Price Action .
3- Bigger T.F Giving Good Bullish P.A .
4- Clean Breakout .

GOLD LAST LIQUDITY GRAB SELL SELL SELLI have take another SELL (as seen on the chart)
GOLD just came to test SUPPLY/DEMAND AREA which work well as a LIQUIDITY GRAB/SL HUNT before DUMP HEAVILY
Stay alart gold at the moment looks good for sell gives very good risk/reward
Thanks

GOLD Potential Bullish Fallowing the PullbackGold is currently forming a trading range, with recent price action indicating a test of support, which may mark the end of the recent pullback. Yesterday, gold retraced toward the 3391 level, showing signs of short-term recovery.
Key Market Focus
The market is closely watching developments around the Federal Reserve appointment, including the potential replacement of Chair Powell. Trade-related comments from Donald Trump are also creating uncertainty. These geopolitical and macroeconomic factors may trigger a new correction or volatility phase in gold.
Resistance: 3400 / 3425
Support: 3355 / 3350
Price action confirmed a false breakout to the downside, with strong buying interest near the 3350–3355 support zone. If the price holds above this support, it strengthens the case for a bullish continuation. A break and close above 3400 could pave the way toward 3425 and potentially higher Growth.
You may find more details in the chart.
Trade wisely Best of Luck Buddies.
Ps: Support with like and comments for better analysis Thanks

GOLD ROUTE MAP UPDATEHey Everyone,
What a PIPTASTIC finish to the week! 🚀. We tracked the move down with precision durung the week and then rode the momentum right back up.
Yesterday, we confirmed the swing range activation and bounce, and that bullish follow through carried beautifully into today, completing our Bullish Target at 3348. Just perfect execution all around.
BULLISH TARGET
3348 - DONE
BEARISH TARGETS
3328 - DONE
EMA5 CROSS AND LOCK BELOW 3328 WILL OPEN THE FOLLOWING BEARISH TARGET
3305 - DONE
EMA5 CROSS AND LOCK BELOW 3305 WILL OPEN THE SWING RANGE
3289 - DONE
3267 - DONE
We will now come back Sunday with a full multi timeframe analysis to prepare for next week’s setups, including updated views on the higher timeframes, EMA alignments, and structure expectations going forward.
Thanks again for all your likes, comments, and follows.
Wishing you all a fantastic weekend!!
Mr Gold
GoldViewFX

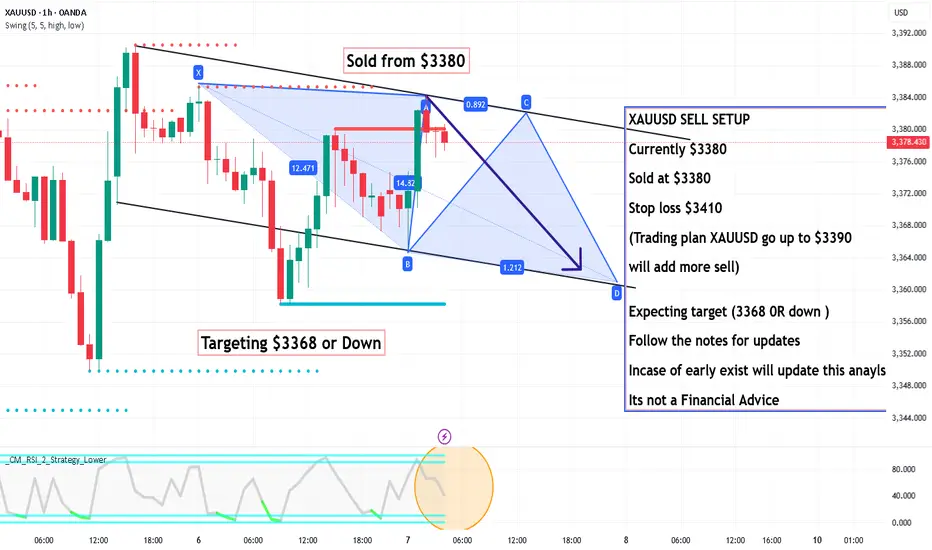
XAUUSD SELL SETUP ,Sold at $3380XAUUSD SELL SETUP
Currently $3380
Sold at $3380
Stop loss $3410
(Trading plan XAUUSD go up to $3390
will add more sell)
Expecting target (3368 0R down )
Follow the notes for updates
Incase of early exist will update this anaylsis
Its not a Financial Advice
Gold next move (Read Description). Hello, Traders.
As you see gold has changed its direction after the NFP News. It was in down trend after the NFP News its flying to the my moon.
Gold is just flying and making breakouts of resistance areas. In my view gold wants to fly and it wants to hit buy side liquidity and then we can see the waterfall.
Gold can continue the trend and if price pullbacks it can touch the area 3365 - 3353 and then can fly.
Don’t trade against the trend, analyse the market before opening the trades.

Will gold break out of its range-bound trading on August 7th?
📌 Core Logic: High-level fluctuations, be wary of a pullback risk
News support for gold prices
Expectations of a Fed rate cut: Weak US economic data (employment, services) reinforce expectations of a rate cut, putting pressure on the US dollar (around 98.7), benefiting gold.
Safe-haven demand: Trump’s policy uncertainty (tariffs, personnel changes) has increased market risk aversion, and gold has been sought after as a safe-haven asset.
Key Technical Signals
Resistance: 3390-3400 (nearly two-week high, bullish risk zone; a breakout targets 3420-3450).
Support: 3370 (short-term bull-bear boundary), 3360-3350 (key support for pullbacks).
Short-term Trend:
4-Hour Chart: Price is under pressure after approaching the acceleration line, indicating a high risk of chasing higher prices.
30-minute chart: Double top resistance at 3390. If it fails to break through, it may retest 3370. A break below 3370 signals weakness, with a target of 3350.
🎯 Today's Trading Strategy
1. Short Opportunity (Priority)
Entry Point: 3385-3395 (Test short position with a small position)
Stop Loss: 3402 (Short position expires if it breaks through 3400)
Target: 3370 → 3360 (If it breaks below 3360, hold to 3350)
2. Long Opportunity (Buy low after a pullback)
Entry Point: Go long if it stabilizes at 3360-3350
Stop Loss: 3345 (Prevent false breakouts)
Target: 3380-3390 (Hold if it breaks through 3400)
⚠️ Key Market Signals
If the Asian and European sessions continue to fluctuate above 3380, the US session may see another push towards 3400, but avoid chasing long positions. Wait for shorting opportunities at higher levels. If it quickly breaks below 3370, then turn short-term bearish and follow through to 3360-3350.
If it stabilizes at 3400 → Set stop loss for short position and switch to long position if it stabilizes on a pullback, with target at 3420-3450.

DeGRAM | GOLD above the descending channel📊 Technical Analysis
● XAUUSD broke above the descending channel and confirmed a breakout from a narrowing wedge near 3,382, signaling bullish continuation.
● The price structure now targets the 3,435 resistance, with pullbacks likely to retest the breakout zone before the next leg higher.
💡 Fundamental Analysis
● Gold is supported by renewed safe-haven demand after geopolitical tensions in the Middle East and weaker-than-expected US ISM services data, which pressured the USD.
✨ Summary
Buy above 3,382; target 3,435. Setup remains valid while holding above 3,360.
-------------------
Share your opinion in the comments and support the idea with a like. Thanks for your support!

XAUUSD GOLD Buy Trade
Buy trade condiational buying on Restest and confirmation of bullish candle
Chart shows SL TP Entry point
Partial booking is suggested risk free trade as soon possible ap per risk reward

Gold Reverses After Hitting Resistance–Bearish Correction Ahead?GOLD – Market Overview
Gold reached our resistance target perfectly, rallying nearly $50 from 3349 to 3400, as previously projected.
Now, price has reversed from the resistance zone and is stabilizing below 3380, which supports a potential bearish correction toward 3365.
A break below 3365 would likely extend the move down to 3349.
For bullish momentum to resume toward 3402, we need a clean break above 3385.
Pivot Line: 3380
Support: 3365 – 3349
Resistance: 3391 – 3402
previous idea:

GOLD: $4000 on the way! Bulls has the controlGold is on the way hitting a record high since the global tension rising we can see gold creating another record high. Please note that it is a swing trades and may take weeks and months to hit the target or it may not even reach the target itself. This is prediction only so do your own due diligence.
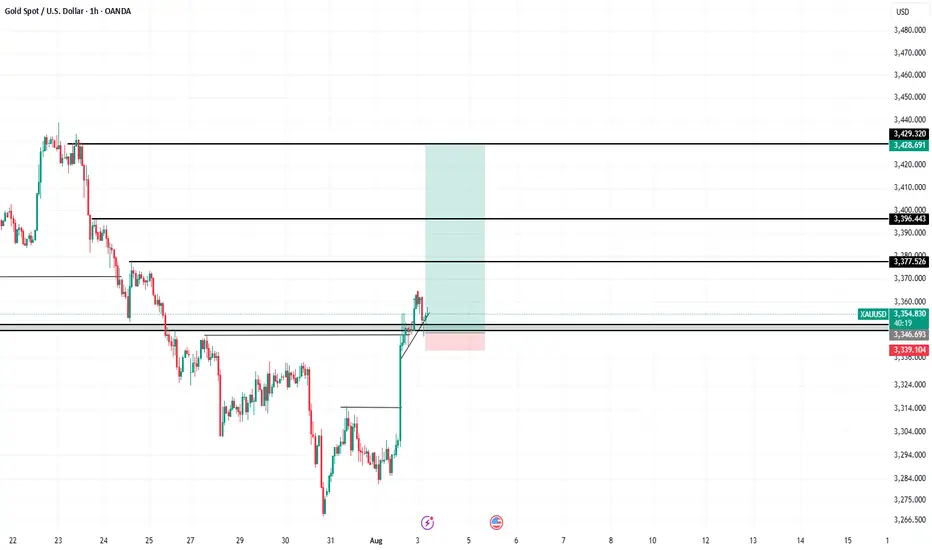
XAUUSD Breakout and Retest – Targeting 3428 Supply ZoneGold (XAUUSD) has broken above key resistance at 3346 and successfully retested it as support, forming a bullish structure with higher lows. This aligns with a classic breakout–retest continuation setup.
The entry is taken after confirmation of support holding, with the following levels in focus:
Entry: Around 3355
Stop Loss: Below retest zone at 3339
Targets:
TP1: 3377 (minor resistance)
TP2: 3396
Final TP: 3428–3430 supply zone
Market structure is bullish on the 1H timeframe, and momentum supports upside continuation. Trade aligned with trend and key demand zone reaction.
📌 Always manage risk. Not financial advice.
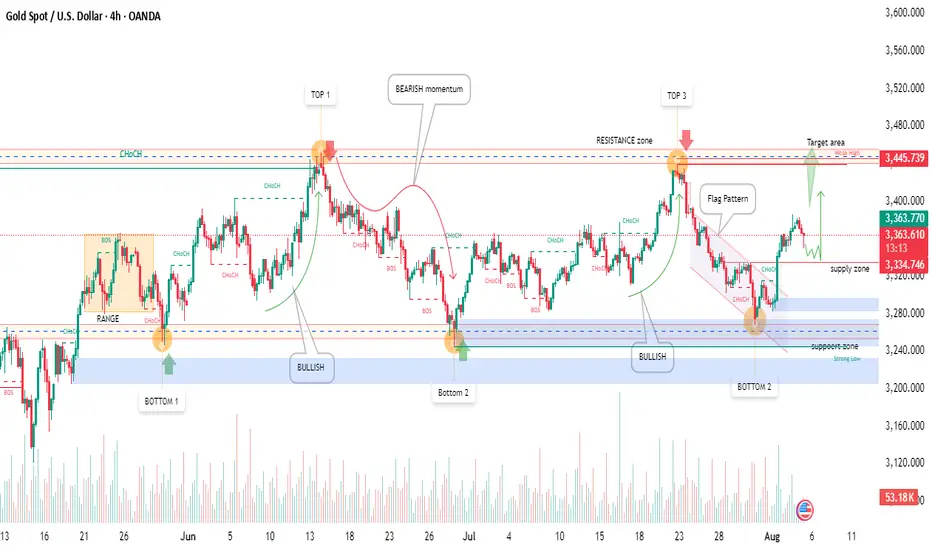
Gold(XAU/USD) 4H 5Aug2025 Price Analysis-Bullish Setup in Play!🧠 Technical Overview:
Gold has shown a solid bullish structure after rebounding from a strong support zone marked around the $3,250 area. We witnessed a textbook flag pattern breakout followed by a Change of Character (ChoCH) confirming bullish momentum.
🔹 Support Zones:
Strong demand near $3,250 – $3,280
Bullish reaction visible from Bottom 2
🔹 Resistance Zones:
Key supply zone at $3,334 – $3,356
Target area near the weekly high at $3,445
🏹 Trade Idea:
A bullish continuation is expected from the current zone after price retested the flag breakout.
🔸 Entry Zone: $3,334 – $3,356 (supply flip)
🔸 Target: $3,445 (Weekly High)
🔸 Stop Loss: Below $3,280 (support zone)
📊 Market Sentiment:
✅ Bullish momentum confirmed by multiple ChoCHs
✅ Strong buying volume at support
❗ Watch for price action confirmation at current supply zone
🏁 Summary:
Gold is currently respecting bullish structure with a clear path toward the $3,445 target. Traders can look for long opportunities after confirmation within the supply zone.
💬 What’s your outlook on Gold? Bullish or Bearish? Comment below!
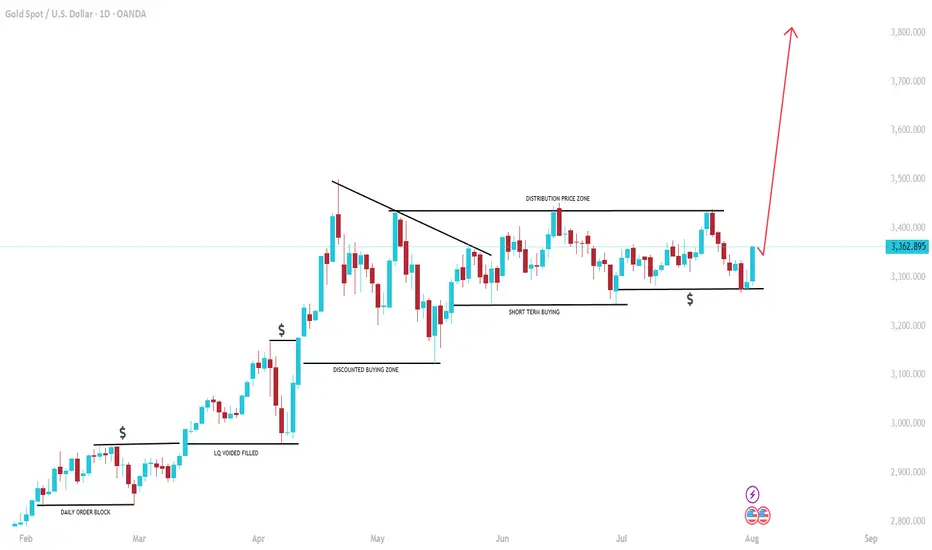
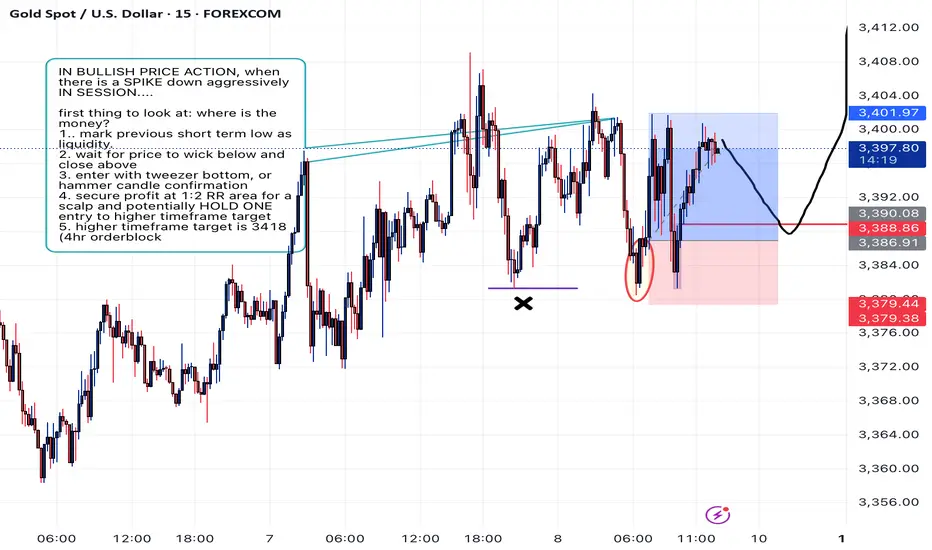
How to Trade Daily Orderflow Continuation Patterns on Lower TFStep 1. Zoom Out and Become Aware of Weekly, Daily, 4HR Orderflow. (a recent orderblock that got smacked)
2. Zoom Into Lower timeframe and Mark previous lows as liquidity.
3. During Major Session (New York or London) wait for price to move aggressively OPPOSITE of your bias. when this occurs set an alert below the Low or watch it.
4. when price wicks below the low and closes above, wait for CANDLE CONFIRMATION. study Japanese candlestick patterns: hammer, bullish engulfing, doji.
GOLD CAN FALLING SOONAccording to M15 analysis gold market in flying pressure from last day now market maybe go down from RESISTANCE ZONE if you want then go sell from RESISTANCE ZONE is best for you Dont be greedy use money management
TRADE AT YOUR OWN RISK
REGARD ALBERT

Gold Regained Bullish MomentumGold Technical Update:
Gold is currently exhibiting a bullish market structure, forming a bullish flag pattern on both the 4H and Daily timeframes, alongside an ascending triangle formation. Once this pattern completes, a breakout above the 3390 resistance is likely, potentially pushing the price toward the 3400–3430 zone.
Price remains above the Ichimoku Cloud, which indicates continued bullish momentum and provides a strong support zone around 3345–3352, reinforced by moving averages and structural support levels.
Today, the price has made a higher low at 3358, compared to the previous day’s low, suggesting strength in the current uptrend. A break above the psychological level of 3400 is anticipated, which could trigger bullish continuation toward 3430.
In light of the current technical setup, I maintain a bullish outlook, expecting the trend to continue. However, this view will be reassessed if price breaks below the daily lows of Tuesday and Wednesday, and closes below the 50-day moving average.
Good luck and trade safe!
