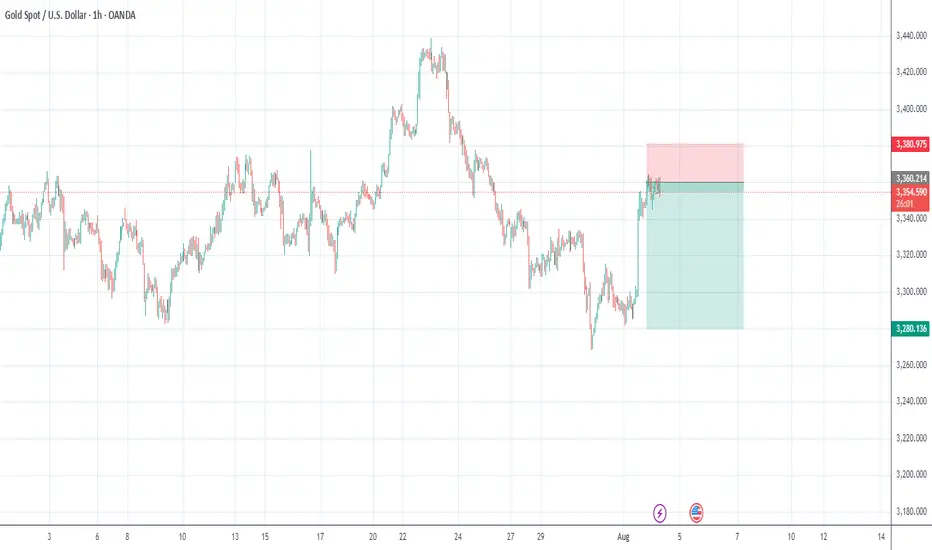
Gold looks like bearish move as the price hitting it resistance Gold is showing signs of a bearish move as the price tests its resistance zone. Sellers may take control if it fails to break above. Watch for confirmations before entering! 💹
#GoldAnalysis #XAUUSD #ForexTrading #BearishMove #ResistanceLevel"
XAUUSD trade ideas
Will Gold Break Out on Tariff and Fed UncertaintyGold’s price action is currently fluctuating above the trendline connecting higher lows from May 2025, potentially aiming for the trendline from December 2024, which aligns with the 2025 peak at 3,500.
A firm hold above the 3,400 and 3,450 levels could accelerate a move back toward the 3,500-record, with potential for further gains toward new highs at 3,780 and 4,000, respectively.
On the downside, a close below 3,340 may lead to a pullback to 3,280 for a possible rebound, or even a deeper retracement toward 3,230 and 3,130.

XAUUSD: Market Analysis and Strategy for August 6th.Gold Technical Analysis:
Daily Chart Resistance: 3430, Support: 3300
4-Hour Chart Resistance: 3400, Support: 3334
1-Hour Chart Resistance: 3390, Support: 3350.
Gold bottomed out and rebounded yesterday. After hitting 3350, the price quickly rebounded to 3390, then traded sideways. Keep an eye on the bullish trend and buy on dips. Wait for a breakout above 3390.
After reaching 3390 yesterday, the price fluctuated downward today, currently trading near 3365. A short-term pullback does not signal a change in the trend; it remains bullish. Yesterday's low of 3350 forms the bull-bear divide. If gold prices remain above this level, the bullish trend remains. Pullbacks are buying opportunities. Any stop-loss around the 3350 support level is a good time to buy. During the uptrend, there's no need to speculate on the top; for now, focus on 3390. A breakout above 3390 could target 3400-3415 for bulls.
For the NY market plan, you can buy when it stabilizes in the 3350-3356 area. The SL plan is set at 3345, and the rising target is 3385-3400.

XAUUSDSince we are bullish on XAUUSD, Price made a new high and now back on the discount of the 1hr range. I expect up down candle to send price to the buy side.

Gold trading rhythm is perfectly matchedIn the previous strategy, we recommended maintaining a high-selling and buying-low strategy for gold. We accurately predicted the high point near 3397 and arranged short positions near 3395. It then fell steadily to around 3371. Judging from the current gold trend, gold rose and then fell in the European session, touching around 3397, which is exactly the pressure level of the upward channel trend line. The Bollinger Bands in the 4H cycle closed, and the indicators temporarily showed signs of differentiation, but the overall market was resistant to declines at high levels. The current short-term support is around 3375-3370. If it does not break the short-term, it will still be volatile. If it falls below, the strong support of 3360 will be seen. The upper pressure levels are 3385, 3398-3400. In terms of operation, we still maintain a high-altitude, low-multiple short-term strategy. I will give the specific operation ideas at the bottom, remember to pay attention in time!

Gold short opportunityGold completed its mini bull flag target and re-entered a micro rising channel, a potentially bearish structure.
With price now testing a key supply zone, we’re watching for rejection to initiate a short, targeting the major demand zone below.

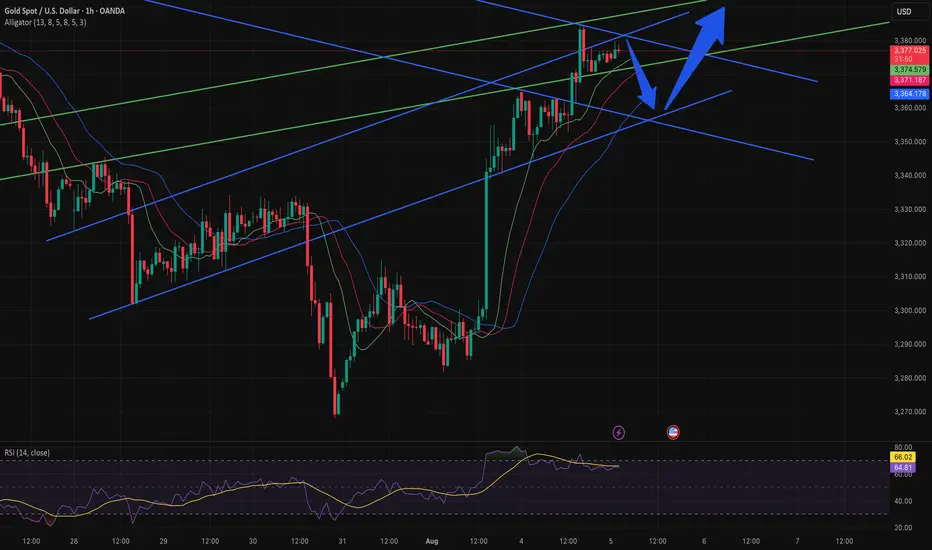
XAUUSD H1 - TRADING I’m quickly analyzing the turquoise trendlines on D1 and the others on H1, and I can determine that there will be a brief short reaction before continuing with the bullish trend.
Gold once again fell into range consolidation, how to operate inToday, Friday, gold finally closed above 3380 after Thursday's close. It initially surged to a high near 3408 on Friday's opening.
Gold is currently consolidating above 3380.
Over the past two days, gold has largely fluctuated between 3360 and 3360. After closing above 3380 yesterday, the current range has shifted to 3380-3400.
The hourly chart also shows the current range between 3380 and 3400.
Of course, 3380 is currently a significant support level.
If it falls below 3380 again, the range could fall back to 3380-60.
On the other hand, the current resistance above is around 3400 points.
If it stabilizes above 3400 (based on today's high, a new high would essentially indicate stability), the subsequent range would become 3400-3450.
This means that after stabilizing at 3400, there's a possibility of continued higher highs.
Of course, gold is currently trading between 3380 and 3400, depending on where it breaks in the US market.
Whichever way the breakout occurs, follow the trend.
Another possibility is that it could continue to consolidate between 3389 and 3400.
If this is the case, then you can simply buy low and sell high within the range.
Xau Usd Neyork time buy set up (05/08/2025)XAU USD Can buy with below level as swing as well as intraday
BUY FROM 3352/58
tp1- 3272
tp-2-3284
tp3-3393
tp4- 3410
SL- 3347/45 (for swing i prefer to hold
i use SMC/ fib tools. and truly a price action method for this entry
Don’t Blink — Gold Charging Toward 3400!Overnight, we entered a long trade at 3365 and successfully closed the trade by hitting TP: 3395, locking in nearly 300pips of profit. This was a very successful and accurate trading strategy.
Just now, gold became very crazy after rising, and plunged directly from around 3397 to around 3372. It was a very scary and crazy diving action. In fact, I am not worried about it. On the contrary, I am very happy that it provides me with another opportunity to enter the market and go long on gold. I've already entered a long position in gold again, as planned, in the 3375-3365 area.
Regarding the recent plunge in gold, I think it was intended to scare off the long positions that were somewhat loose in their intentions. Although gold has fallen sharply, it is still in a recent volatile upward structure. The volatile upward structure has not been destroyed in the short term, so I believe that gold will not have much room for retracement for the time being under the support of the bullish structure. On the contrary, I believe that after gold touches around 3397, even if it is weak, it will try to hit the 3400 mark, and it is even expected to continue the bullish trend to the 3420-3430 area.
There may be many friends in the market waiting for the opportunity to enter the long market at 3350 or even 3340, but what I want to say is that under the support of the gold bull structure, the downward space has been greatly limited. In the short term, gold may not go to such a low position at all, so relatively speaking, I prefer to go long on gold in the 3375-3365 area, and I have indeed done so!

Gold Price Analysis August 5#XAUUSD – Gold continues to increase in wave 3, BUY strategy continues to be prioritized
The D1 candle continued to close with strong increase, confirming that the uptrend is dominant and there are no clear signs of correction. Gold is currently moving in wave 3 - a period with strong amplitude and few recovery beats, so the main trading strategy is still to wait to buy at important support zones.
In the Asian session this morning, the price is reacting at the 3385 zone - an area that can act as a confirmation point for the next recovery. If the buyers maintain their position in this zone, the price will likely continue to move towards higher resistance zones.
🔹 Support zone to watch: 3363 – 3346 – 3332
🔹 Potential resistance zone: 3385 – 3407
👉 Strategy: Prioritize waiting for confirmation signals at support zones to open BUY orders in the direction of the trend. Need to carefully observe the price reaction at the 3385 zone to assess the strength of the buying force during the day.

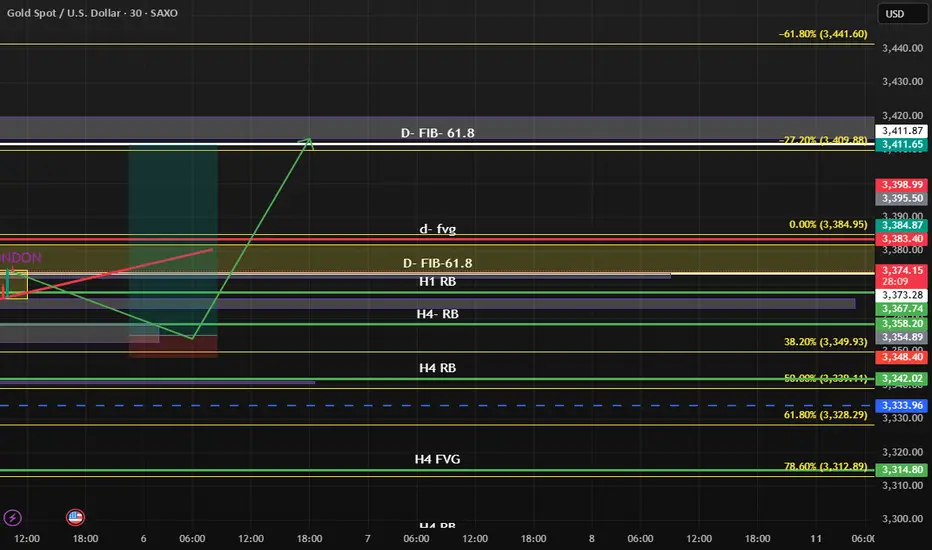
Gold market outlook on the H4 chart. Possible BUYWeekly storyline bullish
Daily storyline bullish
H4 storyline bearish
Two POV observations
Sell side: Price reacted from a daily obstacle ( DSs ) but still has a long way to break its confirmation swing on the H4 ( ? ). We hope to see H4 storyline change to bullish around the swing low area without breaking it ( ? )
Buy side: price rejects from a daily SnR level ( DBs ) and breaks its confirmation swing on the H4 ( + ) so we hope to join price on the 60% discount level.
Nb: Even though we’re still bullish on the weekly and daily, price refused to break PDC on the H4 chart right after a daily obstacle touch. Could be messy. Stay safe and always afford your risk

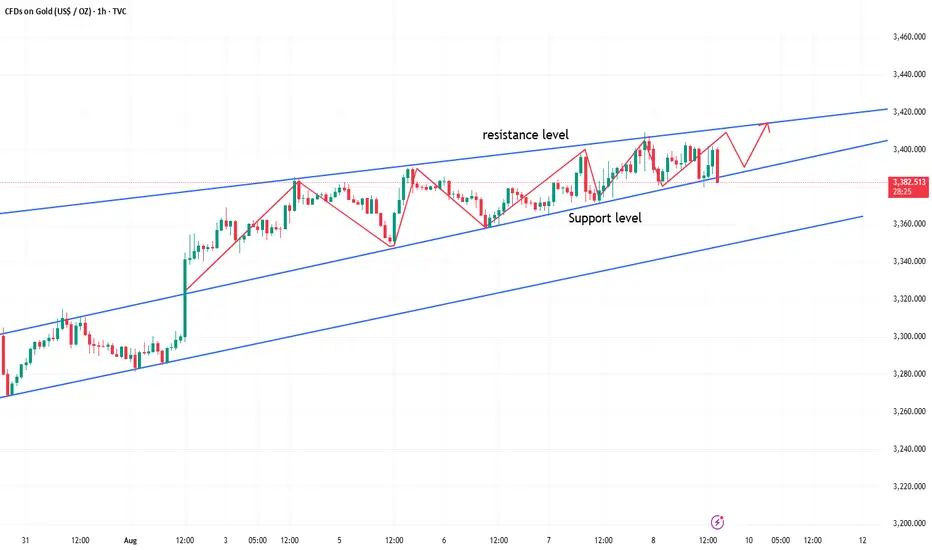
XAUUSD BUYProbably buy gold if it not go under the triangle. Im waiting for a breakout. What do you think?
Give me some feedback and what do you think about gold. I have trading about 3 months, so im a Newbie🧐💰

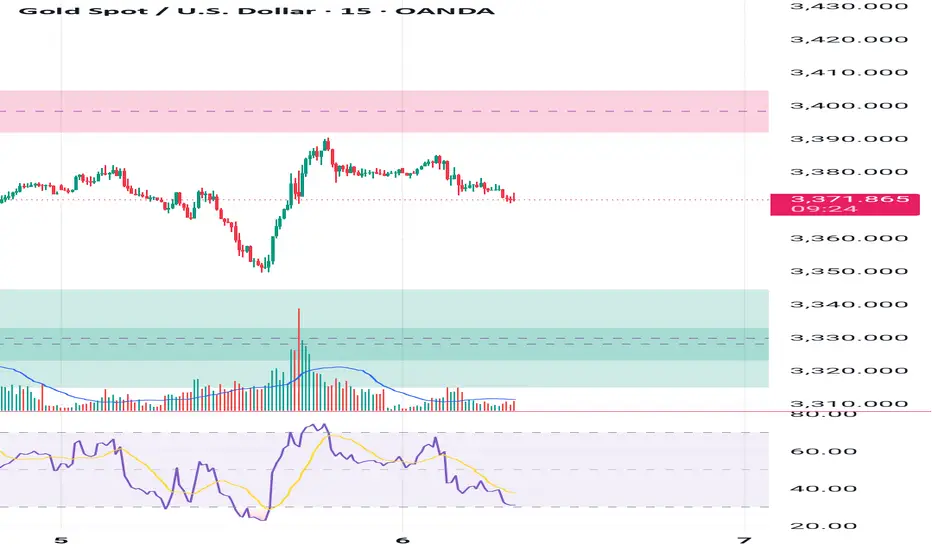
Gold Showing Distribution Signs – Is a Bearish Reversal in Play?Technical Analysis
1. Key Support & Resistance Levels
Short-term Resistance: 3,375–3,380 USD (previous consolidation zone now acting as supply)
Major Support: 3,300 USD (prior breakout base, possible Fibonacci target zone)
Intermediate Support: 3,335 USD (intraday low during the current correction)
2. Structure & Trend
The chart shows a strong bullish impulse on August 2, breaking out of a prolonged consolidation base.
After the breakout, price entered a distribution phase around 3,375 where momentum stalled and volume declined.
A clear breakdown from the distribution zone is now underway, suggesting increased selling pressure and a possible retest of lower demand areas.
3. Price Action Behavior
Price is currently attempting a pullback retest toward the broken structure near 3,370–3,375.
There’s potential for a small head and shoulders pattern, with the neckline near 3,335. A confirmed break below this level could accelerate the move down to 3,300.
4. EMA & RSI Outlook
EMA20 is beginning to turn downward and may soon cross below the EMA50, hinting at a short-term bearish trend shift.
RSI (not shown but worth watching) is likely cooling off from overbought levels, providing space for further downside.
Trading Strategy Ideas:
Sell on pullback to resistance:
Entry zone: 3,370–3,375
Target: 3,335 and 3,300
SL: 3,382
Short-term Buy if RSI oversold + bullish price action: 3,335
Target: 3,370
SL: 3,325
Gold is showing signs of weakness after a sharp rally. The breakdown from the distribution zone indicates a shift in sentiment. If price fails to reclaim 3,375 and confirms below 3,335, the 3,300 support could be the next key destination.
Follow to receive more high-quality trading strategies in upcoming sessions. Save this idea if you found it useful!
Gold Trading Strategy XAUUSD August 4, 2025Gold Trading Strategy XAUUSD August 4, 2025:
Gold prices rose more than 2% last Friday, hitting a one-week high, as weaker-than-expected US non-farm payrolls data boosted hopes for a Federal Reserve rate cut and the announcement of new tariffs fueled safe-haven demand for gold.
Fundamental news: The non-farm payrolls report showed only 73,000 jobs added in July, well below market expectations of 110,000. The unemployment rate rose to 4.2%, indicating a cooling labor market.
Technical Analysis: Gold prices are rising strongly after a strong candle in the 3285 - 3300 area as previously predicted. The bullish pattern on the H1 frame has shown that the buyers are returning very strongly. Currently, the price is showing signs of sideway at the 336x area, our strategy today will be to wait for trading at the support zones of the gold price. Important price zones today: 3315 - 3320 and 3330 - 3335.
Today's trading trend: BUY.
Recommended orders:
Plan 1: BUY XAUUSD zone 3330 - 3332
SL 3327
TP 3335 - 3345 - 3355 - 3370.
Plan 2: BUY XAUUSD zone 3318 - 3320
SL 3315
TP 3323 - 3333 - 3343 - 3363.
Plan 3: SELL XAUUSD zone 3370 - 3372
SL 3375
TP 3367 - 3357 - 3347 - 3337 (small volume).
Wishing you a safe, smooth and profitable trading week.💗💗💗💗💗

1 hrs BPRClear Buying area is near BPR
Look in the 1 hr BPR area, once it is tapped make to check for confirmation in small time frame for entry
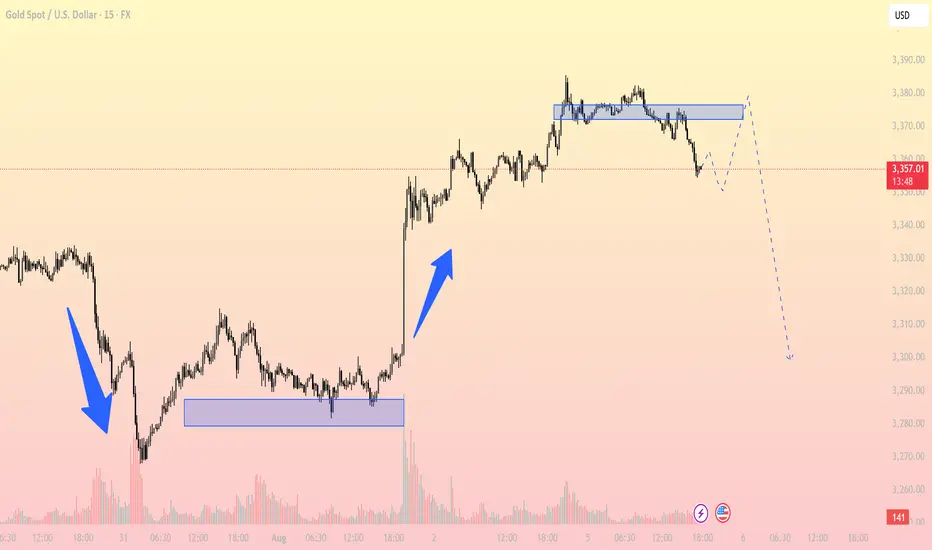
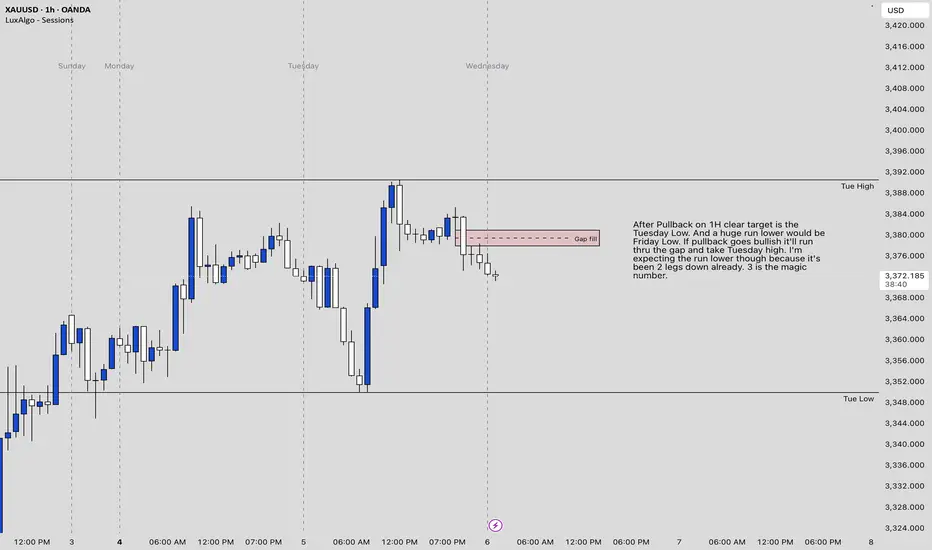
Gold Analysis - Possible big move inboundI left it all on the chart. But it appears gold is prepping for the third leg down after a massive move up. It could take a few days but it's free range all the way to Friday's low. It could be invalidated if the pullback is strong enough. But the gap was filled and its been 2 consecutive pushes downwards. A huge drop seems imminent from my perspective.
Gold Technical Analysis - Bearish Bias Below $3,384Gold is currently trading near $3,373 within an ascending channel but showing signs of weakness. A rejection near the $3,384–$3,390 resistance zone could trigger a downside move toward key supports at $3,350, $3,338, and $3,326. If price breaks below the channel midline, bearish momentum may strengthen. However, a bounce from support could push gold back toward the upper range. Keep an eye on breakout zones for the next move.
🔑 Key Levels to Watch
- Resistance: $3,384 → $3,390: Strong resistance zone
- Support: $3,350 → $3,338 → $3,326
- Breakout Zones: Below $3,338: Opens room to $3,310 and below. Above $3,390: May lead to fresh highs toward $3,410+
🧭 Trend Outlook
- Short-Term: Bearish bias within the ascending channel, especially if price breaks below mid-channel.
- Medium-Term: Neutral to bullish as long as the lower channel trendline holds.
- Momentum: Losing bullish momentum; potential for downside correction.
Price is at a decision point within the ascending channel. A clean break below the mid-channel and $3,365 area can accelerate downside correction. Stay alert to key support zones and any reversal signals.
Note
Please risk management in trading is a Key so use your money accordingly. If you like the idea then please like and boost. Thank you and Good Luck!

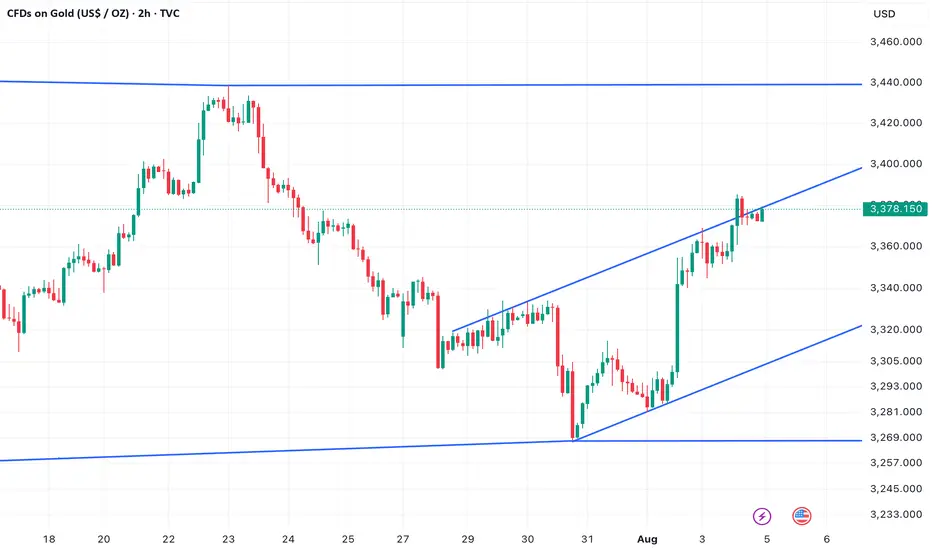
Gold in ascending channelAfter last week's steep and violent drop from $3,439 USD post Fed, Gold has found new momentum thanks to weaker than expected non-farm payroll numbers. But the price has been capped inside an ascending channel. This doesn't look particularly convincing to me for a strong reversel and bull case in the short term unless we manage to break out of the channel soon. If we fail to break the $3,439 USD high pre- Fed meeting I expect a test of the lower bound of the channel and a potential break below that.
A break below the channel opens up the way to the low at $3,267 USD.
Patience Through VolatilityThere's something the market teaches you over time that no book, course, or checklist ever really prepares you for - “how to live with uncertainty” .
It's amazing how quickly the market can make you doubt yourself. You can be doing everything right - following your process, managing your risk, sticking to your plans, and then volatility hits. Suddenly, nothing seems to make sense. The moves feel random. Your setups fail. Your confidence fades. You start questioning not just your trades, but yourself.
You'll have stretches where patience feels like the hardest thing in the world. Watching markets whip up and down without direction, sitting on your hands when you want to trade just to feel in control again, it's exhausting in a different way. It's not the exhaustion of doing too much. It's the weight of doing nothing when your instincts scream at you to act.
That’s the part most people don’t talk about. It’s not the losing trades that break most traders, it’s the feeling of being stuck. The uncertainty of not knowing when the noise will fade. The frustration of watching opportunities slip by without a clear way to take part. It’s the slow grind of sitting through volatility while your discipline quietly wears down, day after day.
Patience isn’t something you can show off. Most of the time, it looks like doing nothing. And often, it feels like falling behind.
Good trading isn't about finding opportunities in every move, it's about knowing when the market favours you, and when it doesn't. It's about understanding your edge and protecting it.
Some environments aren't built for your system, your style, or your strengths. Volatile markets don't offer you clean setups or easy entries. They offer noise, confusion, and temptation.
Most traders don’t struggle because of volatility itself, but because of the impatience it creates. They force trades. They chase moves. They try to squeeze something out of the market simply because the waiting feels unbearable.
But waiting is not a weakness. Sitting still is not inaction. Restraint is a skill.
Your progress won’t always be visible. It won’t always show up on a chart at the end of the day. Sometimes, progress is simply preserving your capital. Sometimes, it’s maintaining your discipline. And sometimes, it’s protecting your mindset so you’re ready when the right opportunities finally come back into focus.
You have to learn to stomach the discomfort of volatility without tying your self-worth to every swing in your account. The noise always feels permanent in the moment. Doubt grows louder. You start questioning your system, your progress, and even yourself. (More on this in a future post.)
That's normal.
What matters is what you do with those feelings. Whether you let them push you into reckless trades just to feel something again, or whether you have the maturity to sit still, protect your capital, protect your mindset, and wait.
There’s no hack for this. No shortcut. Patience is something you earn the hard way - forged in boredom, frustration, and the silence between trades. Patience isn’t about passively waiting; it’s about actively protecting yourself, your energy, your future self from the damage you could cause today.
Not every moment in the market is meant for action. Not every day is meant for progress. Some days, weeks, or even months are simply about survival. Some seasons are for growth, and others are just for holding on. Knowing the difference is what keeps you in the game long enough to eventually see the rewards.
The market will calm. Patterns will return. Opportunities will align. Your edge will reappear. The chaos always fades. The clarity always returns. When it does, you want to be ready - not emotionally drained, not financially wrecked, and not scrambling to recover from the mistakes impatience forced on you.
But if you lose patience and start chasing just to feel active, you risk more than money. You risk undoing the very discipline you’ve worked so hard to build.
Volatility will always test you. That's its nature. Patience will always protect you. That's your choice.
If you’re in one of those stretches right now - high volatility, failing setups, doubt creeping in; remind yourself this is part of the process. It’s normal, and it’s not the time to force progress.
Let the market burn itself out.
If you can do that, you’ll find yourself ahead, not because you forced results, but because you endured the pain when others couldn’t.
The rewards won’t come from predicting the next move. They’ll come from knowing you didn’t let the storm in the market create a storm within you.
Trust that clarity will return. Your only job is to make sure you’re still here when it does.
There’s strength in waiting. There’s wisdom in restraint.
GOLD Bullish strong TVC:GOLD After price formed an Ascending Triangle on the Daily time frame it looks like we'll be bullish for the entire week. Tho let's see how everything plays out and guys please do you have any ideas on Gold let me know on the comment session.

Gold on short term correction?Gold is likely to be on a short term correction, possibly in preparation for a bullish CPI. gold might actually head to 3400 after CPI release come next week.

Prediction Xxauusd keeps rejecting of this box on the 3 hour if we see a close above we will see the 90s
