Gold Faces Key Fibonacci Resistance Is the Bullish Momentum FadiTrend Structure: Gold remains in a short-term bullish structure, with a clear series of higher highs and higher lows. However, price action shows signs of hesitation near a critical Fibonacci extension zone.
Key Resistance Zone:
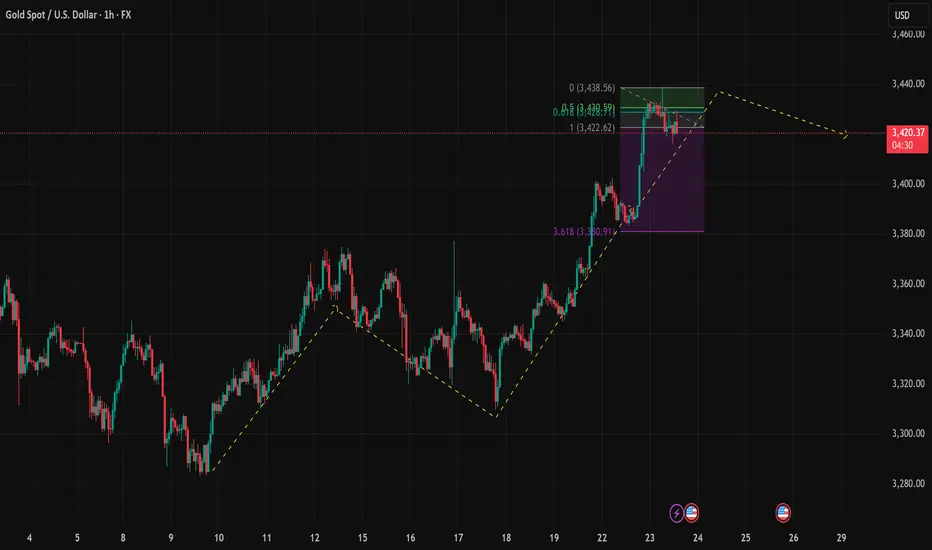
$3,428 – $3,438: This area aligns with the 0.618 Fibonacci extension at 3,428.59 and the 0.0 level at 3,438.56, forming a confluence resistance zone that has started to trigger selling pressure.
Immediate Support Levels:
$3,422.62: The 1.0 Fibonacci extension, serving as the first support on a minor pullback.
$3,408 – $3,410: A potential bounce zone combining short-term trendline support and prior consolidation structure.
Fibonacci & Price Waves: The recent bullish leg from $3,330 to $3,438 has completed a 3.618 extension (noted at $3,330.91 on the purple projection). This increases the probability of a corrective retracement.
EMA & RSI (suggested for confirmation): EMA20 (not shown) should act as a dynamic support. Watch RSI for potential overbought signals or bearish divergence if it crosses above 70.
Trade Setups to Watch: Scenario 1 – Short Setup at Fibonacci Resistance Entry: $3,428 – $3,432, only if price action confirms rejection (e.g., bearish engulfing, pin bar)
Stop Loss: Above $3,438
Take Profit 1: $3,422
Take Profit 2: $3,410 (if trendline breaks)
Scenario 2 – Buy Setup on Pullback Entry: Around $3,408 – $3,410 upon bullish price action confirmation
Stop Loss: Below $3,400
Target: $3,428
Final Thoughts: Gold is approaching a strong resistance zone, and short-term pullback is likely unless bulls break through $3,438 with momentum. Traders should stay patient and wait for confirmation signals before entering. Remember: discipline beats impulse.
Follow for more updated strategies during the US session. Save this idea if you find it helpful! Let’s discuss your view in the comments below.
XAUUSD trade ideas

GOLD NEXT MOVEGold reached the resistance area around 3420 and 3440 and from here a rejection for the correction is possible with target around 3360-3380 before it resume further growth. let us see
IS XAUUASD SET FOR WEELY BULLISH TREND ? FUNDAMENTAL ANALYSIS
"This week, the golden opportunity shines bright! With robust support at $3320 and our sights set on a $3340 target, we're giving strong buy signals. The path to profit is clear, but keep a keen eye on the $3370 resistance. Don't miss this strategic entry!

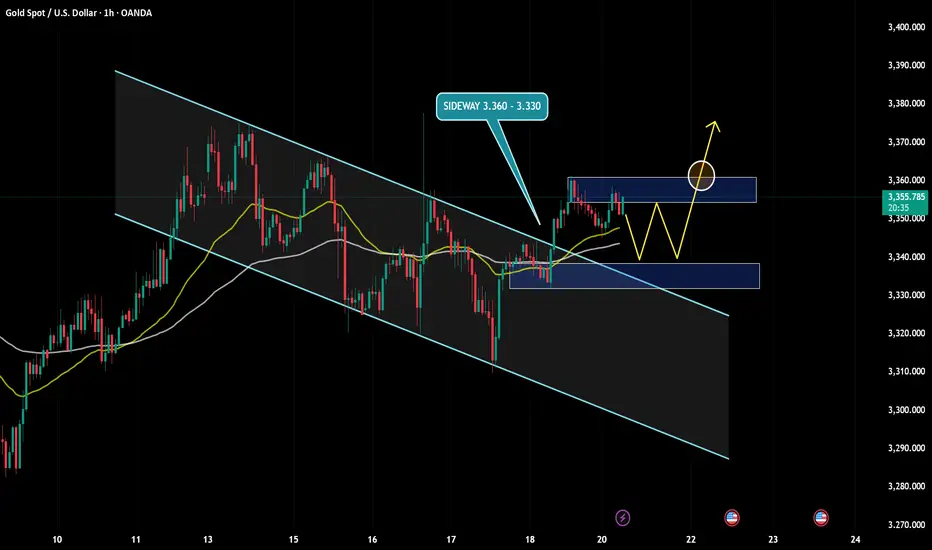
Gold holds steady near resistance – Is a breakout coming?Hello everyone, let’s explore today’s gold market together!
Overall, during the Asian session on Monday, gold traded cautiously, consolidating just below the nearest resistance level at $3,360, with minimal price movement. The uptrend remains strong, primarily driven by a sharp momentum shift last Friday following key news, as the weakening USD reignited investor interest in gold.
Current market sentiment suggests that major institutional funds and retail traders alike are showing renewed attention. As long as the previous support level around $3,330 holds firm, the next move could be a break above the $3,360 resistance, which would likely open the door for further upside expansion.
However, if price breaks below that support zone, I would consider the bullish setup invalid and shift to a wait-and-see approach until clearer signals emerge.
Feel free to share your thoughts in the comments — your perspective could contribute tremendous value to the global TradingView community!
Trend breakout towards master(ATH) trend line Purely from a trend line POV and HTF (M, W,D) POCs, which have been tested multiple times confirming their validity, best case scenario is a retest of the upper trend line that originates from the all time high.
The lower trend line has been tested and defended @ 3311. The continuation of this leg has faced initial resistance from a level @3360 where price closed below decisively after news event.
Favourite scenario is a pull back to last weeks VAL where the weekly candle closed above signalling buyers were keen on such level @3300, clear support formed to confirm validity of the level and upside target to 3400

Today's US market focus is 3350
Gold prices continued their decline from the previous session on Thursday, July 24, slipping further below the 3,400 mark as trade tensions eased and risk sentiment rose. Gold's decline today means a second consecutive day of decline as investors turned their attention to more positive trade progress since yesterday. However, gold still received buying support earlier this week, breaking through $3,400 at one point. This round of gains tested key resistance levels on the gold daily chart, but in the end the bears held their ground.
Risk data interpretation!
Investors are currently waiting for U.S. Purchasing Managers Index (PMI) data for new trading instructions. If any PMI index falls below 50.0, indicating a contraction in economic activity in related industries, the dollar may face pressure and help gold prices rise.
The market will also pay close attention to developments surrounding the ongoing discord between U.S. President Trump and Federal Reserve Chairman Powell. The White House announced Trump's schedule, and Trump will visit the Federal Reserve at 4 p.m. Eastern Time on Thursday.
Views on the trend of gold!
The trend of gold is directly reversed from that of Monday and Tuesday this week. At the beginning of this week, gold rose slowly and continuously without giving a chance to retrace, while today it retreated continuously and did not give a rebound. Does it look familiar? The trend is bearish and I want to short but I can't do it. In fact, we are still bullish in the morning today, and the watershed is actually at the 3375 line. After the frequent breakouts in the European session, it means that the current bulls are suppressed again.
And the K-line on the hourly line is more obvious. There is no positive line in the continuous negative retracement, so the weakness will continue. After all, the Asian session is weak today, and the European session is also continuously weak. The current market has reached the 3363 line, which is actually not far from our second support of 3350. So the US session needs to focus on this position. If the US session can hold, there is still hope for a rebound. Otherwise, it will fall continuously today!
Gold: Long around 3350, defend 3340, and target the 3385-93 line

gold view today (july 22, 2025📊 Market Context
🕰️ Daily & 4H: Bullish BOS (Break of Structure) formed.
📉 Retracement may occur to retest BOS levels before bullish continuation.
⚠️ Be aware: Price might dip lower before buying resumes.
🟢 For BUYS:
✅ Scenario 1: No retracement
1️⃣ Wait for a 15M 🟢 bullish CHOCH with body close to form BOS.
2️⃣ On 3M, get a 🟢 CHOCH with body close.
3️⃣ Retest the 🟨 FVG that forms.
🎯 Target: 3398.332
✅ Scenario 2: Retracement first
1️⃣ Let price fall to 🔵 3368.9480 – 3362.888 (near Daily BOS).
2️⃣ Wait for 🔁 1M/3M CHOCH confirmation.
3️⃣ Retest BOS zone.
📈 Buy towards:
• 🎯 Partials: 3383.518
• 🎯 Final TP: 3398.242
✅ Scenario 3: Breakout
1️⃣ Break above 3398.242 with strong 15M 🟢 body close.
2️⃣ Retest the level.
📈 Enter short-term BUYS targeting:
🎯 3412.172
🔴 For SELLS (if BOS fails):
⚠️ If 15M BOS is broken by 🟥 strong momentum candle:
1️⃣ Retest the BOS zone.
2️⃣ Look for bearish entry.
🎯 Target: 3369.557

Clear way to shoot up and touch atleast 3500.Clear way to shoot up and touch atleast 3500, Keep your support and resistance in place and take trades on order blocks making sure the breakouts are strong enough.
----------------------------------------------------------------------------------------------
Disclaimer:
Trading foreign exchange (Forex) on margin involves a high level of risk and may not be suitable for all investors. The use of leverage can work both for and against you. Before deciding to participate in the Forex market, you should carefully consider your investment objectives, level of experience, and risk tolerance.
There is a possibility that you may incur a loss of some or all of your initial investment, and therefore, you should not invest money that you cannot afford to lose. Be fully aware of all the risks associated with foreign exchange trading, and seek advice from a licensed and independent financial advisor if you have any doubts.
Past performance is not indicative of future results. Always trade responsibly.

XAUUSD
XAUUSD Updated in 15M :
The gold signal is marked on the chart based on the latest price changes and the supply and demand in the market. These points include the entry point, stop loss, and take profit


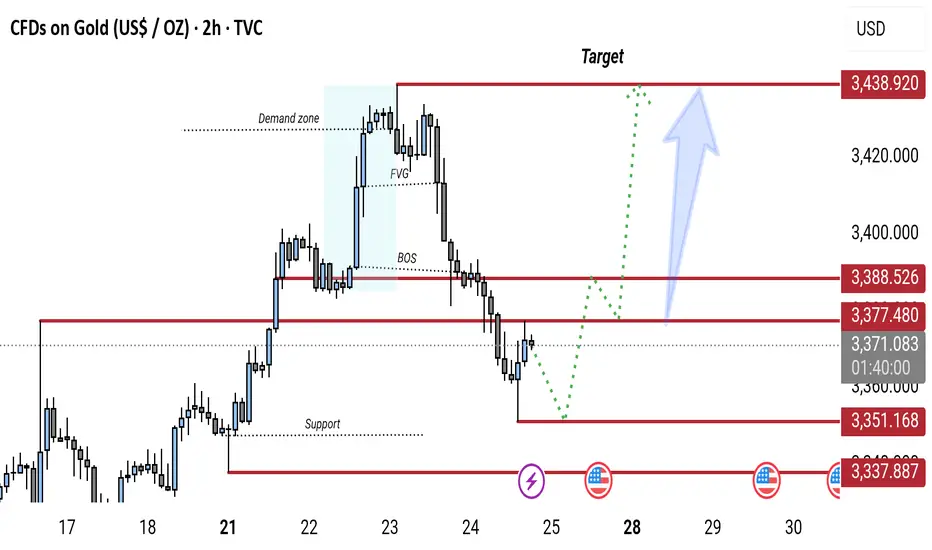
Gold 2H Chart: Bullish Reversal Expected from Key Support ZoneGold (XAU/USD) 2H chart shows a bearish break of structure (BOS) followed by a pullback toward a key support zone (around 3,337–3,351). A potential bullish reversal is expected from this zone, targeting the 3,438 resistance level. The chart highlights a demand zone, FVG (Fair Value Gap), and possible retracement before continuation to the upside.
SMC Strengths of the Analysis
• ✔️ Clear bearish structure (ChoCH + BOS + fake out)
• ✔️ Mitigation target (1H FVG not yet closed)
• ✔️ SL well protected outside the manipulation zone
• ✔️ Logical entry right where the imbalance begins

Gold Hits Five-Week High as Trade Tensions MountGold reversed early losses to rise above $3,420 per ounce, hitting its highest level since June 16, as US Treasury yields and the dollar continued to weaken amid persistent uncertainty over trade negotiations.

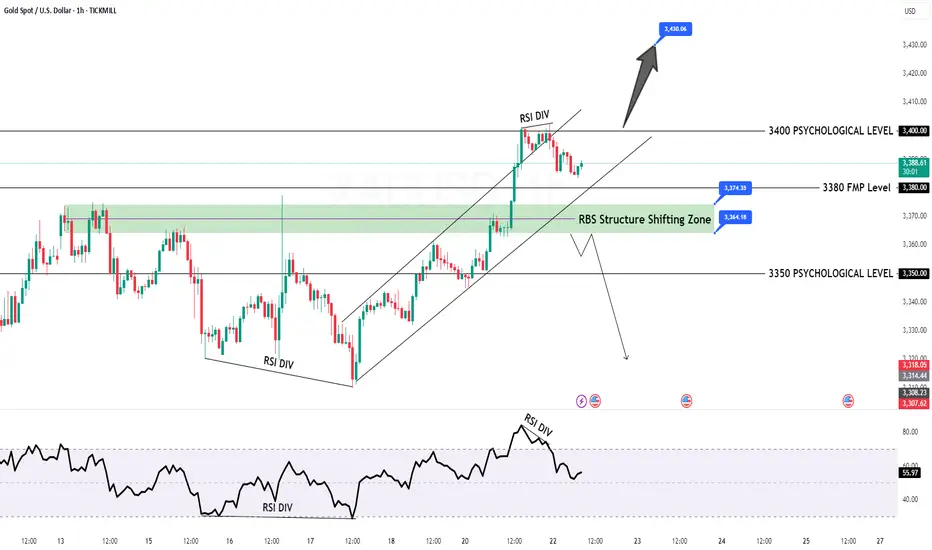
GOLD Intraday H1 Chart Update For 22 July 2025Hello Traders,
Today we have FED Chair Powell Speech ahead
all eyes on 3400 Psychological Level Break for now, if market successfully breaks 3400 then it will move towards 3435
below 3400 it will move back towards 3350 level
Disclaimer: Forex is Risky
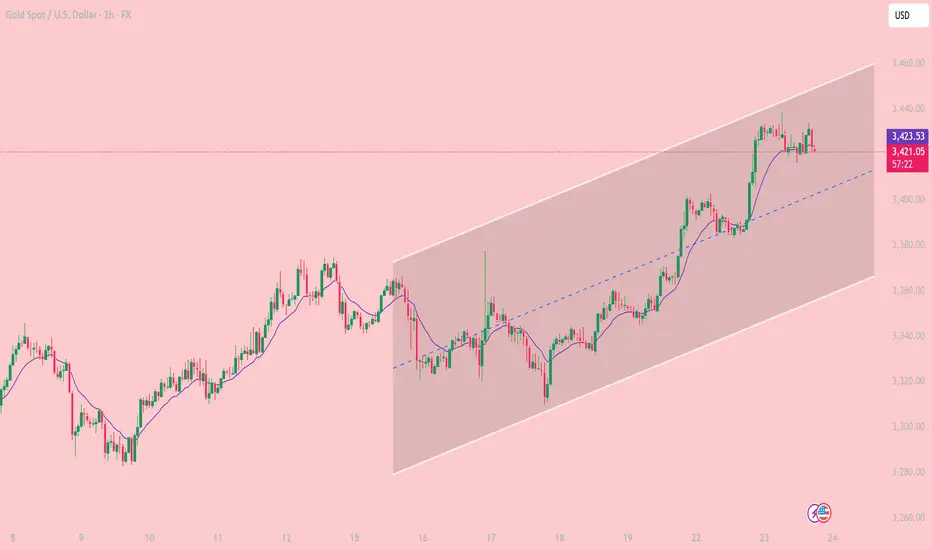
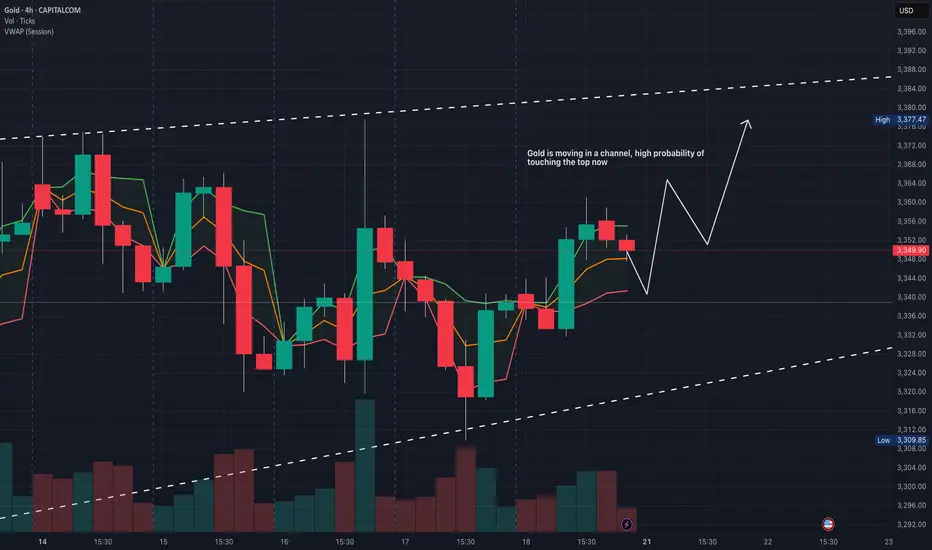
Bullish Channel in Play Key Trading Zones and Strategy for JulyOn the 1-hour chart, XAUUSD is clearly moving inside a well-defined ascending price channel, with price respecting both the channel boundaries and the midline as dynamic support/resistance. The pair continues to print higher highs and higher lows, confirming short-term bullish structure.
Trend Channel: Since July 18, gold has been steadily climbing within an ascending channel, bouncing off the lower boundary and riding above the midline.
EMA Support: The 10-period EMA (purple) has been acting as a dynamic support. Price has yet to close below it during this bullish swing.
Candle Behavior: Recent bullish candles with strong bodies show that buyers still have control, although price is stalling near the upper boundary of the channel.
Technical Level
3,459 USD. Major Resistance. Top of the channel – potential reversal or take-profit zone
3,423 USD.Immediate Support. EMA10 and current consolidation area
3,400 USD. Mid-Channel Support. Key pullback zone if price rejects near highs
3,360 – 3,365 USD. Major Support. Bottom of the ascending channel – break may invalidate bullish setup
Scenario 1 – Buy the Dip (trend continuation):
Wait for price to retest the 3,400 – 3,410 USD area or EMA10.
Look for bullish confirmation (e.g., pin bar, bullish engulfing).
Target: 3,445 – 3,459 USD
Stop loss: below 3,395 USD
Scenario 2 – Short at Channel Top (mean-reversion setup):
Monitor price behavior near 3,455 – 3,459 USD resistance.
If bearish reversal candles appear (e.g., shooting star, bearish engulfing), consider shorting.
Target: 3,420 – 3,410 USD
Stop loss: above 3,465 USD
As long as price remains inside the rising channel, buying pullbacks is the preferred strategy.
Stay alert to macroeconomic catalysts (Fed comments, PMI data, labor market releases) that could increase volatility.
Gold remains in a strong short-term uptrend on the 1H chart. Trading in the direction of the trend with proper risk management continues to offer the best opportunities for intraday traders.
If you found this analysis useful, don’t forget to follow for more trading strategies and ideas!
Why Swing Trading and Scalping Are Opposite Worlds"It's not about the strategy. It's about who you are when the market puts pressure on you."
Most traders fail not because they don’t learn “strategies” — but because they pick a style that doesn't match their temperament.
And nothing creates more damage than confusing swing trading with scalping/intraday trading.
Let’s break them down. For real...
________________________________________
🔵 1. Swing Trader – Chasing Direction, Not Noise
A swing trader does not touch choppy markets.
He’s not here for the sideways grind. He wants momentum.
If there’s no clear trend, he doesn’t trade.
He shifts between assets depending on where real movement is.
• USD weakens → he buys EUR/USD and waits
• Gold breaks → he enters and lets the move develop
Swing trading means positioning with the macro flow, not chasing bottoms and tops.
✅ He trades based on H4/Daily or even Weekly charts
✅ He holds for hundreds of pips.
✅ He accepts contrarian candles in the process.
________________________________________
🔴 2. Scalper/Intraday Trader – The Asset Specialist
A true scalper doesn’t chase trends.
He hunts inefficiencies — quick spikes, fakeouts, liquidity grabs.
✅ Loves range conditions
✅ Lives inside M5–M15
✅ Often trades only one asset he knows like the back of his hand
He doesn’t care what EUR/USD will do this week.
He cares what it does in the next 30 minutes after a breakout.
Scalping is not chaos. It's cold execution with a sniper mindset.
📡 He reacts to news in real time.
He doesn’t predict — he exploits.
________________________________________
🧾 Key Differences – Swing Trader vs. Scalper
________________________________________
🎯 Primary Objective
• Swing Trader: Captures large directional moves over several days.
• Scalper/Intraday: Exploits short-term volatility, aiming for quick, small gains.
________________________________________
🧭 Market Conditions Preference
• Swing Trader: Needs clean, trending markets with clear momentum.
• Scalper/Intraday: Feels comfortable in ranging markets with liquidity spikes and noise.
________________________________________
🔍 Number of Instruments Traded
• Swing Trader: Monitors and rotates through multiple assets (e.g. XAUUSD, EURUSD, indices, BTC, he's going where the money is).
• Scalper/Intraday: Specializes in 1–2 instruments only, knows their behavior in every session.
________________________________________
⏰ Time Spent in Front of the Charts
• Swing Trader: Waits for clean setups, may hold positions for days or weeks.
• Scalper/Intraday: Constant screen time, executes and manages trades actively.
________________________________________
📰 Reaction to News
• Swing Trader: Interprets the macro/fundamental impact and positions accordingly.
• Scalper/Intraday: Reacts live to data releases, wicks, and intraday volatility.
________________________________________
📉 When They Struggle
• Swing Trader: Fails in choppy or directionless markets.
• Scalper/Intraday: Loses edge when the market trends explosively.
________________________________________
🧠 Psychological Requirements
• Swing Trader: Needs patience, confidence in the big picture, and acceptance of drawdown.
• Scalper/Intraday: Needs absolute discipline, emotional detachment, and razor-sharp focus.
________________________________________
✅ Bottom line: They are two different games.
Don’t try to play both on the same chart with the same mindset.
________________________________________
✅ Final Thoughts – Your Edge Is in Alignment, Not Imitation
You don’t pick a trading style because it “sounds cool.”
You pick it because it aligns with:
• Your schedule
• Your attention span
• Your tolerance for uncertainty
If you hate watching candles all day – go swing.
If you hate waiting for days – go intraday.
If you keep switching between both – go journal your pain and come back later.
P.S. Recent Example:
I'm a swing trader. And this week, Gold has been stuck in a range.
What do I do? I wait. No rush, no overtrading. Just patience.
Once the range breaks, I’m ready — in either direction.
But I don’t close after a quick 50–100 pip move. That’s not my game.
I aim for 700+ pips whether it breaks up or down,because on both sides we have major support and resistance levels that matter.
That’s swing trading:
📍 Enter with structure, hold with confidence, exit at significance.
Not every move is worth trading — but the big ones are worth waiting for.
Disclosure: I am part of TradeNation's Influencer program and receive a monthly fee for using their TradingView charts in my analyses and educational articles.
Mean Reversion Risk & Short Trap ?Analysis :: XAU/USD – July 21, 2025
🧩 Scenario Expansion – Mean Reversion Risk & Short Trap Variant
🧠 FLOW STATUS (Reassessment for MR scenario):
Order book shows replenishment at 3401.50–3403.00, forming a liquidity ceiling.
CVD diverging slightly on 1M–5M as price presses upward—distribution signal rising.
VWAP bands stretched: price outside 1.5x STD (mean reversion trigger zone).
🕳️ Low effort on buyer continuation despite printing highs.
📉 ALTERNATE SIGNAL: 🔃 MEAN REVERSION TO VWAP
🔹 Confidence Band: CONSERVATIVE → CONFIRMED if 3393 fails
📍 Break Trigger Zone:
Breach of 3393.00 on delta + seller reclaim → validates reversal logic
Watch for bid collapse or sustained negative delta below 3391
📉 Expected Pullback Targets:
TP1: 3387.80–3386.20 = VWAP + 1 STD reversion
TP2: 3383.00 = HLQ + CVD shelf
🛡️ Stop Zone for Mean Reversion Entry:
Above 3397.20 or on full absorption at 3395.50 (failure = trap scenario invalid)
🧮 Probability Estimate – Mean Reversion:
46–55% over next 6–12 hours
↑ Strengthens to 65–70% if price fails to reclaim 3394.50 after sweep + delta shift
📈 Trap Reversal Setup (Short trap flipped into long):
If price fakes below 3391.00 then spikes back above 3393.50 with aggressive tape → strong trap confirmation
In that case:
✅ Re-entry LONG with confirmation
📍 Entry: 3393.40–3394.20
🎯 TP: New highs at 3402.50+, then 3406.00
📚 NARRATIVE (Alt Scenario):
Market extended into premium zone without strong continuation. Liquidity overhead, delta divergence, and VWAP stretch suggest potential for correction. If bulls fail to defend 3393–3391, price likely seeks VWAP center and HLQ for rebalancing. Conversely, any reclaim of broken bids post-sweep flips scenario into a reactive long on trap fuel.
📦 MODULE TRACE (Alt Path):
🧠 Disciplined Entry Logic: Rule 3 (bias must adjust if liquidity contradicts setup)
💧 HLQ under VWAP (~3384–3387) aligned with pullback
🔄 Delta divergence + DOM ceiling = soft rejection
📦 Shadowcode ST3/ST5 if price forms mirror wick rejection
🧠 Trap Narrative Active only after flush + reclaim with flow shift

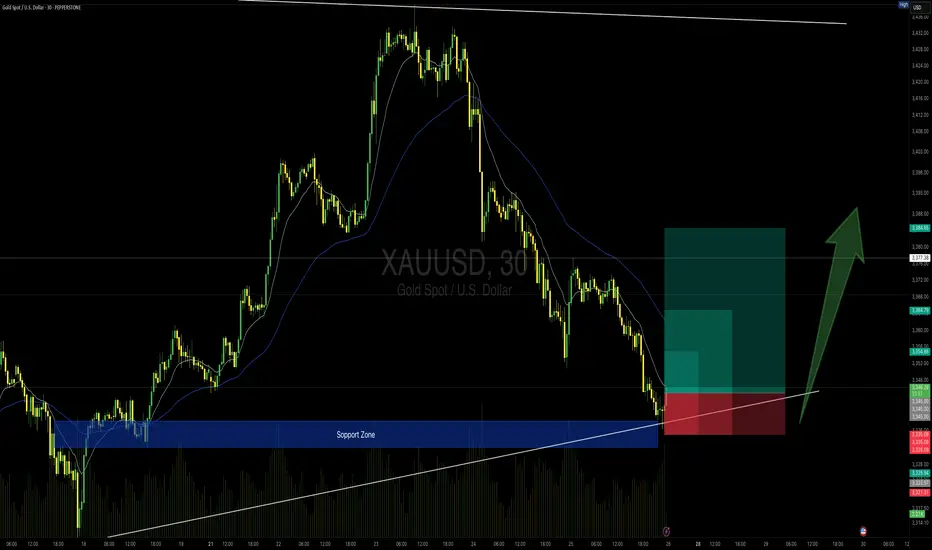
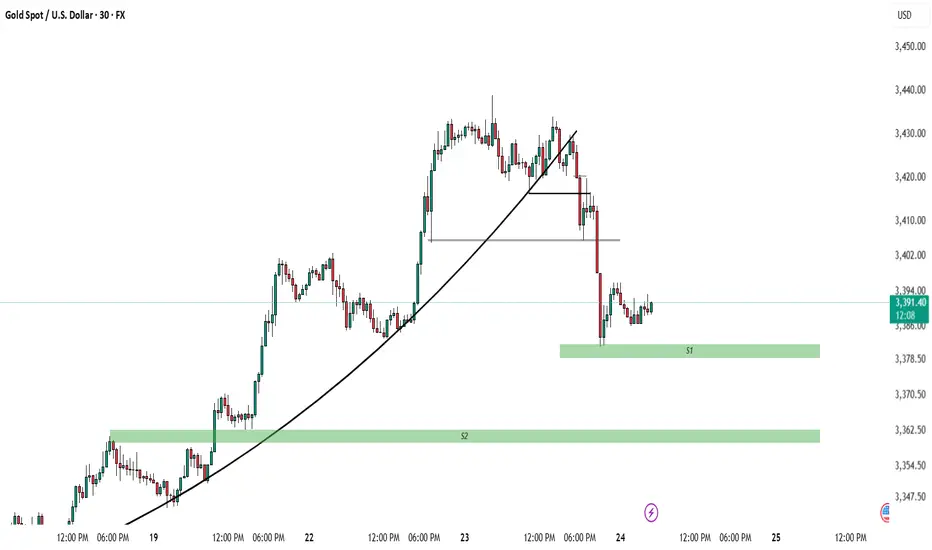
GOLD 30min Buy Setup (High Risk - High Reward)📍 TVC:GOLD 30min Buy Setup – MJTrading View
After an extended bearish leg, price has tapped into a strong support zone that previously acted as a launchpad. Also touching the main Uptrend...
We now see initial signs of absorption with potential reversal setup forming just above the ascending trendline.
🔹 Entry Zone: 3344–3346
🔹 SL: Below 3335 (under structure & wick base)
🔹 TP1: 3355
🔹 TP2: 3365
🔹 TP4: 3385+ (if momentum sustains)
🔸 RR: Up to 1:4 depending on target selected
🧠 Context:
– Still inside broader bullish structure (macro HL)
– Support zone coincides with rising trendline
– Potential for bullish reaccumulation after sharp drop
– Volume spike near zone suggests active buyers
Stay sharp and manage your risk please...
See the below Idea for full concept:
"Support isn't just a level — it’s a battlefield. If buyers win, they don’t look back."
#MJTrading #Gold #BuySetup #PriceAction #SmartMoney #ChartDesigner #ReversalSetup #MarketStructure
Psychology Always Matters:
XAUUSD Entry PossibilityFX:XAUUSD
🔥 Clean S&R + Previous FVG Confluence 🔥
30M sniper setup with high R:R 📈
Let me know your thoughts! 🧠👇
Possibilities For Entries!
1) If market Sweep Liquidity below 3382-3380 then wait for Bullish formation to Enter in Market
2) If Liquidity didn't sweep instead market close below these then wait for Retracement to go in sell side until 3360 Support
3) When Entry is place take 1:2 as partial Close and Let other position with breakeven SL. Open Until 3401 if get rejection then close.
IF NOT then keep it 3414-3430.
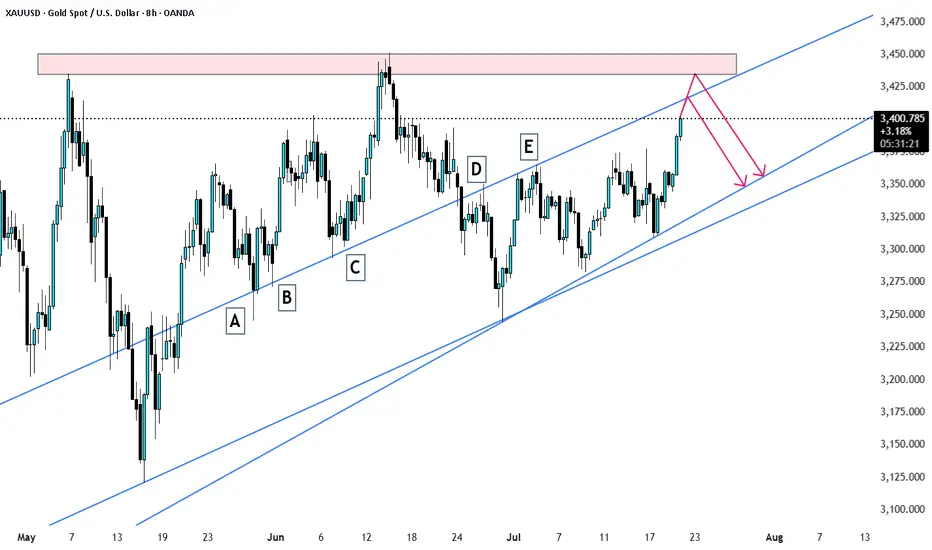
Gold is set to rise, which is an opportunity to buy!Last week gold made another correction down for Wave E but after that it broke the low again. This could be wave 2 of the next impulsive wave up and gold will continue to rise next week.
Or price makes one more move down for wave E and then start the next impulsive wave up.
Let's see what price does and react.
Trade idea: Wait for a small correction down on a lower timeframe and a change in orderflow to bullish to trade longs.
Don't be emotional, just trade your plan!

Gold-Bullish Leg to ContinueGold is Bullish. a minor pullback may happen before it continues its leg up. Looking at uncertainty at global level, Gold might push to 3400.
Thursday Analysis (24/7/2025)Hey guys today is looking pretty good for us. My swing sell has gone more than 600 pips and my buy is also looking pretty good. let's see how it goes from here. I will update in the notes if I found anything.
