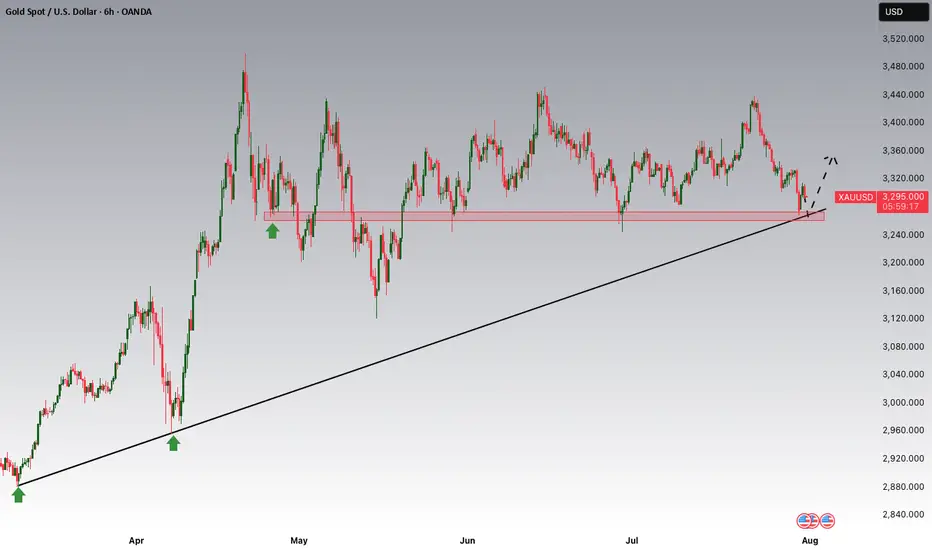
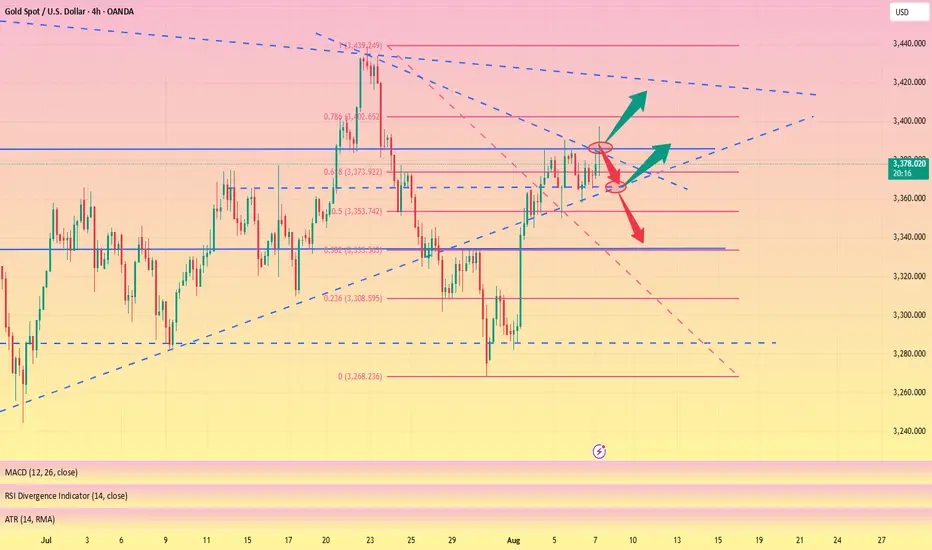
GOLD → The market is waiting for NFP. What could happen?FX:XAUUSD is bouncing off resistance at 3310, confirming the upper limit of the new trading range. The dollar continues to rally, but the market as a whole is stagnating ahead of upcoming news—NFP is coming up!
Gold is consolidating at monthly lows around $3268, awaiting key US labor market data (NFP). Trump's new tariffs (10% globally, 35% for Canada, 39% for Switzerland) have boosted demand for the dollar, putting pressure on gold. Markets are waiting for NFP: forecast +110K jobs, unemployment 4.2%. Weak data (<100K) → gold may rise to $3400. Strong (>150K) → the dollar will strengthen, gold will continue to fall. The probability of a Fed rate cut in September is <50%.
Based on yesterday's data, I would cautiously suggest that NFP will be in the range of 125K–145K, slightly above the consensus (110K). This will play into Trump's hands (I think you understand what I mean...).
Resistance levels: 3300, 3310, 3320
Support levels: 3287, 3268, 3255
The news has a negative nuance — unpredictability. Be careful.
Technically, based on the data we have at the moment, I would assume that the market may test resistance at 3300-3310 before a possible pullback to the specified support. BUT! Unpredictable data could turn the game around, and in that case, if the dollar falls, gold could start to rise.
Best regards, R. Linda!
XAUUSD trade ideas

Gold (XAU/USD) 1H Chart – Trendline Support and Upside TargetGold price is trading above the support trendline around 3,287. A bounce from this level could drive price toward the 3,313 resistance and potentially the 3,333 target. Maintaining support above 3,287 is key for the bullish outlook.

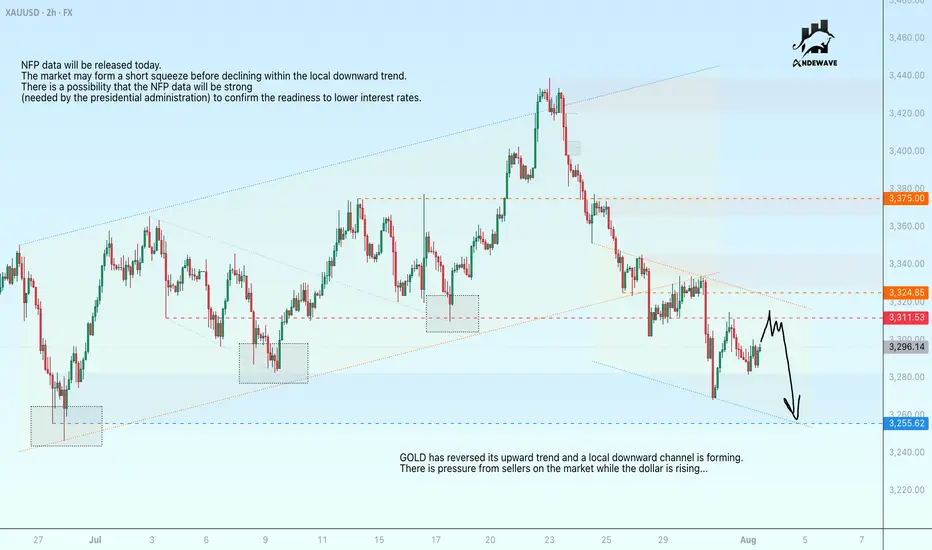
GOLD may be subject to manipulation ahead of the NFPGOLD has reversed its upward trend and a local downward channel is forming. There is pressure from sellers on the market while the dollar is rising...
NFP data will be released today. The market may form a short squeeze before declining within the local downward trend.
There is a possibility that NFP data will be strong (needed by the presidential administration) to confirm the readiness to lower interest rates.
Scenario: ahead lies a strong resistance zone at 3311.5 - 3324.85. The formation of a false breakout could intensify bearish pressure, leading to a decline in prices to 3255
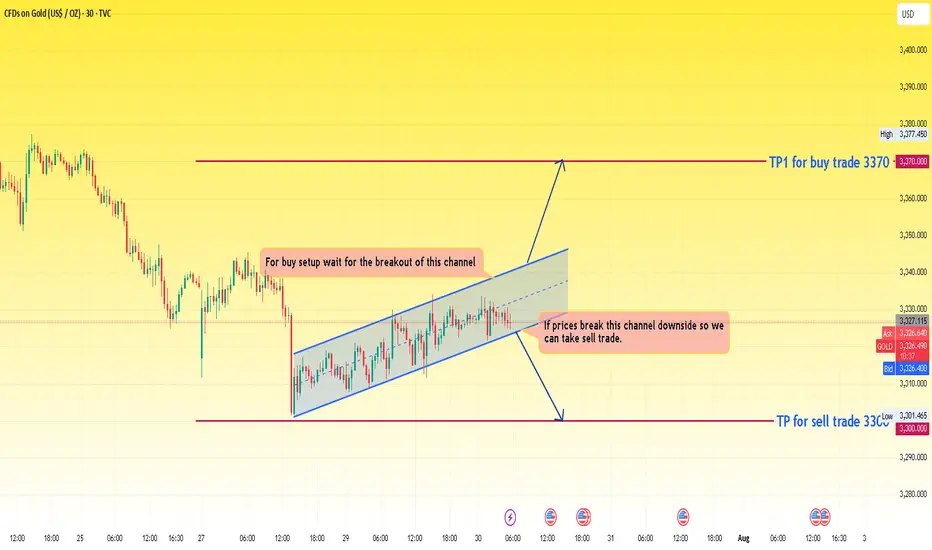
XAUUSD prices current scenario This chart presents a range-bound price action within an ascending channel and offers two potential breakout trade opportunities depending on price direction.
🔍 Chart Summary:
> Current Price: Around 3326-3328
> Pattern: Ascending channel
> Bias: Neutral (waiting for breakout)
📊 Channel Analysis:
> Price is moving inside an ascending channel, marked by two parallel trendlines (support and resistance).
> This suggests gradual bullish pressure, but the price is still within a consolidation/ranging structure.
> Buyers and sellers are currently indecisive, waiting for a clear breakout direction.
🧠 Trade Scenarios:
✅ Buy Setup:
: Condition: Breakout above the upper channel resistance
: Confirmation: Break and close above channel, ideally with strong bullish candles and volume
: Target: 3370 (marked as TP1 for buy trade)
> Reasoning: Breakout confirms buyer dominance and momentum continuation
❌ Sell Setup:
: Condition: Breakdown below the lower channel support
: Confirmation: Break and close below the channel with a bearish engulfing or volume spike
: Target: 3300 (marked as TP for sell trade)
> Reasoning: Break below structure indicates loss of buyer control and return of bearish trend
⚠️ Key Notes:
: The ascending channel suggests short-term bullish strength, but no strong trend has been confirmed yet.
: Avoid entering within the channel—this is a no-trade zone due to market indecision.
: Wait for confirmation of breakout/breakdown before entering trades.
✅ Conclusion:
> The price is currently in a rising consolidation channel.
> Breakout above = buy opportunity toward 3370
> Breakdown below = sell opportunity toward 3300
This is a classic wait-for-breakout setup—ideal for breakout traders looking for defined risk and reward zones.
GOLD (XAUUSD): Bearish Continuation Ahead?!
Gold retested a recently broken significant liquidity cluster.
I see a clear sign of strength of the sellers after its test
with multiple intraday confirmation.
I think that the price will retrace to day to 3276 level.
❤️Please, support my work with like, thank you!❤️
I am part of Trade Nation's Influencer program and receive a monthly fee for using their TradingView charts in my analysis.

Risk Capacity: The Real Reason Traders Blow Accounts | Ep. 4In this pre-recorded video, I unpack one of the most overlooked reasons why traders blow their accounts over and over again, and it’s not about your system, strategy, or signal.
It’s about risk capacity, the internal threshold your nervous system can handle before fear, greed, or shutdown kicks in.
This is part of my ongoing series on YouTube “Rebuilding the Trader Within”, where I reflect on the emotional and psychological dimensions of trading that no indicator can fix.
If you've ever found yourself repeating the same mistakes, feeling stuck at the same equity level, or losing composure in high-stakes trades... this might be the pattern underneath it all.
I'm still learning too, and I’d love to hear your thoughts. Drop a comment — let’s grow together.
#RiskCapacity #TradingPsychology #TraderMindset #RebuildingTheTraderWithin #ForexMentorship #TraderGrowth #InnerWork #ForexPsychology

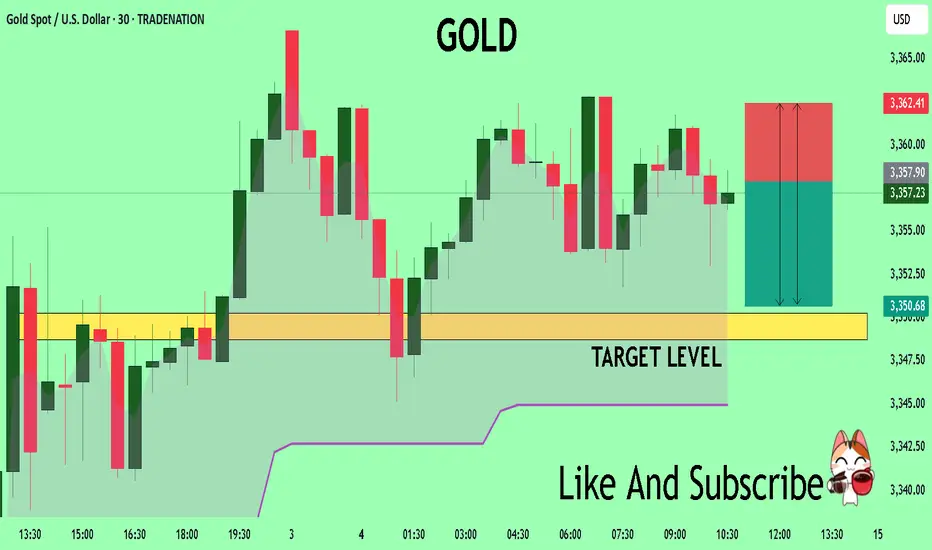
GOLD A Fall Expected! SELL!
My dear subscribers,
My technical analysis for GOLD is below:
The price is coiling around a solid key level - 3358.0
Bias - Bearish
Technical Indicators: Pivot Points Low anticipates a potential price reversal.
Super trend shows a clear sell, giving a perfect indicators' convergence.
Goal - 3350.7
My Stop Loss - 3362.4
About Used Indicators:
By the very nature of the supertrend indicator, it offers firm support and resistance levels for traders to enter and exit trades. Additionally, it also provides signals for setting stop losses
Disclosure: I am part of Trade Nation's Influencer program and receive a monthly fee for using their TradingView charts in my analysis.
———————————
WISH YOU ALL LUCK
Gold Potential UpsidesHey Traders, in today's trading session we are monitoring XAUUSD for a buying opportunity around 3,270 zone, Gold is trading in an uptrend and currently is in a correction phase in which it is approaching the trend at 3,270 support and resistance area.
Trade safe, Joe.
XAU/USD Approaches Resistance – Watch 3374 CloselyGOLD Overview
Gold is currently approaching the 3374 resistance level. A 1H candle close above 3374 could trigger further upside toward the next resistance zones at 3401 and 3402.
However, if the price fails to hold above 3365 and starts to decline, this would indicate a potential bearish reversal toward the support levels at 3350 and 3333.
The next short-term move will depend on how price reacts around the 3374 zone — watch for either a confirmed breakout or rejection.
🔹 Key Technical Levels:
Pivot Line: 3365
Resistance: 3374 • 3388 • 3402
Support: 3350 • 3333
Scenarios:
🔺 Bullish: 1H close above 3374 → Targets: 3388 / 3402
🔻 Bearish: Failure to hold above 3365 → Downside toward 3350 / 3333

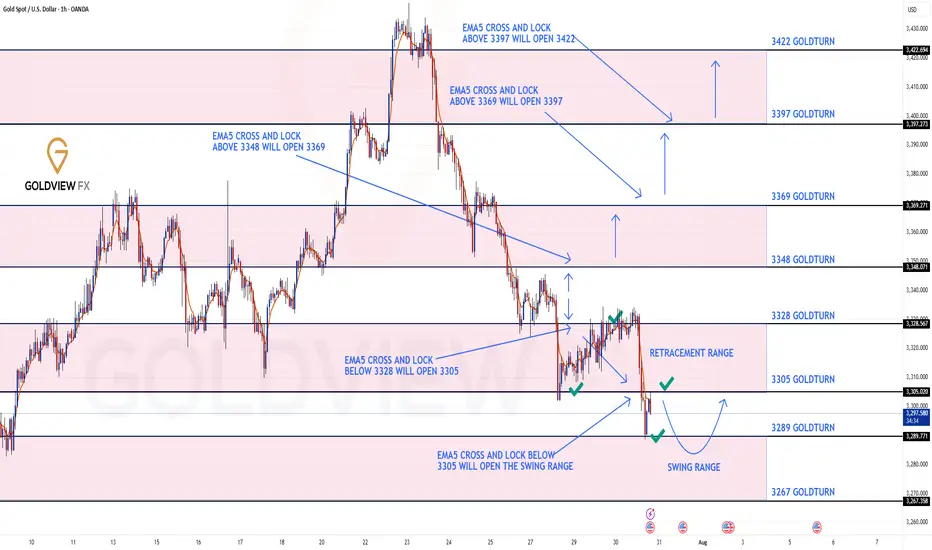
GOLD ROUTE MAP UPDATEHey Everyone,
Quick follow up on our 1H chart route map:
We had the break below 3305 Goldturn, opening and hitting the 1st level of the swing range at 3289, which did exactly what it says on the tin and gave us the perfect swing bounce into 3305.
We are now looking for support above the swing range and a break above 3305 to track the movement up or further retest and break below the 1st level of the swing range may open the the 2nd level at 3267. Ema5 cross and lock will confirm this.
From here, we’re watching for:
Support to hold above the swing range, followed by a clean break above 3305, which would suggest upward continuation.
Alternatively, if we retest and break below 3289, that opens the path toward the second level of the swing range at 3267.
We will keep the above in mind when taking buys from dips. Our updated levels and weighted levels will allow us to track the movement down and then catch bounces up.
We will continue to buy dips using our support levels taking 20 to 40 pips. As stated before each of our level structures give 20 to 40 pip bounces, which is enough for a nice entry and exit. If you back test the levels we shared every week for the past 24 months, you can see how effectively they were used to trade with or against short/mid term swings and trends.
The swing range give bigger bounces then our weighted levels that's the difference between weighted levels and swing ranges.
BULLISH TARGET
3348
EMA5 CROSS AND LOCK ABOVE 3348 WILL OPEN THE FOLLOWING BULLISH TARGETS
3369
EMA5 CROSS AND LOCK ABOVE 3369 WILL OPEN THE FOLLOWING BULLISH TARGET
3397
EMA5 CROSS AND LOCK ABOVE 3397 WILL OPEN THE FOLLOWING BULLISH TARGET
3422
BEARISH TARGETS
3328 - DONE
EMA5 CROSS AND LOCK BELOW 3328 WILL OPEN THE FOLLOWING BEARISH TARGET
3305 - DONE
EMA5 CROSS AND LOCK BELOW 3305 WILL OPEN THE SWING RANGE
3289 - DONE
3267
As always, we will keep you all updated with regular updates throughout the week and how we manage the active ideas and setups. Thank you all for your likes, comments and follows, we really appreciate it!
Mr Gold
GoldViewFX
Gold next prediction Aug 4 onwardsAs you can see in this chart gold was moving in a downtrend channel and after a big breakout in Non-Farm Gold moves to 3362 so now it will make a new Bullish channel in which first hurdle will be 3374-3380 and then can retrace till 3H and 4H chock point and then can continue to bullish side overall move can be done upto 3452-3460 which is last resistance of the market as my analysis this can be plan A.I will update about Plan B in my next analysis.
GOLDGOLD needed a reaction from 3360 which is what market gave us, now we need some more upside before any correction.
Disclosure: We are part of Trade Nation's Influencer program and receive a monthly fee for using their TradingView charts in our analysis.

XAUUSD – Bullish Reversal or Just a Deep Correction?Last week was a wild one for Gold.
After a quiet start and some choppy price action, the market dropped hard on Wednesday, breaking not only the 3300 key level but also the 3280 horizontal support — and what followed was anything but calm.
As expected after a strong move, the price pulled back to retest the broken support.
But Friday changed everything.
Instead of continuing down, Gold reversed sharply, fueled by weaker-than-expected NFP data. Price surged 800 pips from low to high, breaking above both the 3310 resistance zone and the weekly high around 3335.
________________________________________
🧭 Key Question:
Are we back in the bullish trend, or is this just a strong correction of the 3440 → 3270 drop?
Since May, Gold has lacked a clear trend — so a step-by-step trading approach is the most advisable to adopt.
________________________________________
🔍 Outlook:
Given the strength of the reversal and the break above two important resistance levels, my bias is bullish.
• 📌 Support: 3335 — a pullback into this zone could offer a buy opportunity in line with the recent momentum.
• 📌 Resistance: 3375 is the next key level to watch.
• ❌ Invalidation: A drop below 3310 would cancel the current bullish scenario.
🧠 Final Thoughts
Gold’s recent move challenges both bulls and bears.
Yes, the bounce was strong. Yes, key resistance levels broke.
But with no clear trend since May, chasing long term direction can be risky.
That’s why a step-by-step approach is the most advisable to adopt — let the market confirm each move before committing to the next.
For now, the breakout above 3310 and 3335 leans the bias to the upside.
However, staying reactive — not being stuck with an idea — is the smartest approach.
Disclosure: I am part of TradeNation's Influencer program and receive a monthly fee for using their TradingView charts in my analyses and educational articles.

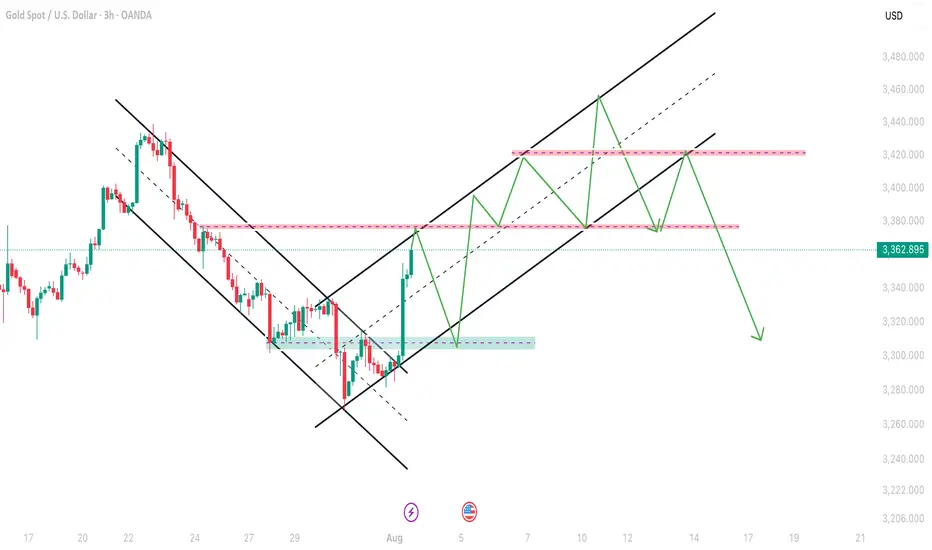
Gold is still stuck in range.Gold is still stuck in range before big move. The Yellow metal Is forming this wedge pattern for fourth days. I'm out of trade now. In any case I'm ready to sell it tomorrow with respect on its develope.

Gold’s Next Move: Bounce or Breakdown?Gold is pulling back after breaking the 3,360 USD resistance on the 6-hour chart. Price is currently testing the nearest fair value gap (3,370–3,380), but upside momentum is stalling, partly due to unfilled supply zones above.
A retest of the lower FVG near 3,340 will be key. Holding above this level could trigger renewed buying, while a break below may invalidate the bullish structure.
Traders should closely monitor whether downside gaps continue to fill and how price behaves near support zones. Lack of strong liquidity could lead to a false breakout.

GOLD in 1HHello to all traders. 😎😎
I hope all your deals will hit their targets. 🎉🎉
On the first day of August, gold surged strongly due to news about tariffs imposed by Trump on imported goods. It gained nearly $60 in a single powerful candle.
Currently, I expect a pullback from the $2362–$2370 range down to around $2347–$2352, followed by a potential rebound back to $2370.
⚠️⚠️⚠️⚠️Don’t forget to apply proper risk management!
What Do You Think?
Which scenario do you think is happen? **Share your thoughts!** ⬇️
Don't forget that this is just an analysis to give you an idea and trade with your own strategy. And don't forget the stop loss🛑🛑🛑
❤️❤️❤️The only friend you have in financial markets is your stop loss❤️❤️❤️
Please support me with your ✅' like'✅ and comments to motivate me to share more analysis with you and share your opinion about the possible trend of this chart with me 🙏😊
Be Happy , Ali Jamali
XAUUSD: Market Analysis and Strategy for August 5th.Gold Technical Analysis:
Daily chart resistance: 3430, support: 3300
4-hour chart resistance: 3400, support: 3334
1-hour chart resistance: 3385, support: 3350.
Gold prices have continued their upward trend since breaking through $3335 last Friday, with an overall bullish outlook. Currently trading around $3356, support lies at $3350, a key defensive barrier for bulls. If this level breaks, gold could fall further to $3328 or even the $3300 mark. Conversely, upward resistance lies at $3385 (previous high), $3400 (round number), and $3430 (trend line resistance). If gold successfully breaks through these resistance levels, it could retest the year's high of $3500. During NY trading, focus on the $3388-3405 range above and the $3350-3334 support range below. Keep an eye on the bull-bear dividing line at 3350!
BUY: 3350
SELL: 3345
SELL: 3385

GOLD 1Hello to all traders. 😎😎
I hope all your deals will hit their targets. 🎉🎉
In my opinion, gold is currently moving within an ending pattern with a slight upward slope. This type of pattern is typically a reversal formation, and I believe it could lead to a drop in gold prices.
At the moment, I think gold might revisit the $3390–$3400 zone, and from there, we could see a deeper decline—first toward the bottom of the ending pattern at $3370, and if the pattern breaks, possibly down to $3340 or even lower.
However, if gold breaks above the $3400 level with strength, this analysis would be invalidated, and we could then expect a move toward the $3440 area.
⚠️⚠️⚠️⚠️Don’t forget to apply proper risk management!
What Do You Think?
Which scenario do you think is happen? **Share your thoughts!** ⬇️
Don't forget that this is just an analysis to give you an idea and trade with your own strategy. And don't forget the stop loss🛑🛑🛑
❤️❤️❤️The only friend you have in financial markets is your stop loss❤️❤️❤️
Please support me with your ✅' like'✅ and comments to motivate me to share more analysis with you and share your opinion about the possible trend of this chart with me 🙏😊
Be Happy , Ali Jamali

Gold Price Rebound Towards 3325 Target After Support TestGold (30-min chart) shows a recovery from the support zone (3288–3298) with potential bullish movement. Key resistance levels are 3305 and 3316, with a target zone around 3325.510. Price is expected to follow a corrective structure before possibly reaching the target.

Gold Breakdown Hints at Continued Bearish MomentumThe XAUUSD chart on the 4-hour timeframe reflects a bearish sentiment, as the price has broken below a key trendline and is now trading under the Ichimoku cloud. Multiple rejections from the same resistance area suggest strong selling pressure. The structure shows a consistent pattern of lower highs, indicating weakening bullish momentum. After breaking key support, the price made a retest of the broken zone and failed to reclaim it, confirming bearish continuation. The highlighted resistance area has proven to be a significant supply zone. As long as the price stays below this zone, the bearish outlook remains intact, and a downward move is likely in the coming sessions.
Entry Sell: 3342
Target point: 3248
Stop Loss : 3362
If you found this analysis helpful, don’t forget to drop a like and comment . Your support keeps quality ideas flowing—let’s grow and win together! 💪📈

GOLD 15MInute PLan. Enjoy..So the Image is Simple as it is.
Currently @15$ gonna keep trading it.
Started @10$ Last Night.
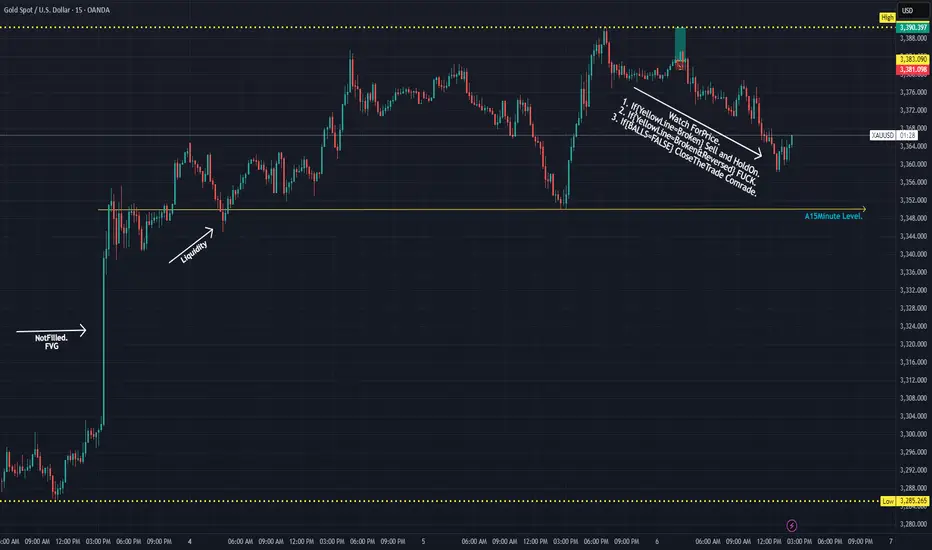
The triangle pattern is about to break through and hit 3400#XAUUSD
Although the price of gold was too high last night due to the rise in risk aversion, the upward momentum weakened significantly in the evening, and it fluctuated sideways at a high level. Gold is currently consolidating within a triangle pattern, with a short-term price increase reaching the triangle's boundary. A break above 3385 could lead to significant intraday gains. Meanwhile, the downside is defending short-term support at 3365. As long as this support level remains intact, the bullish trend remains intact. If the European session gives an opportunity to fall back to the 3375-3365 support area without breaking, you can consider going long and look at 3395-3405, and if it breaks, look at 3415.
GOLD BULLS STILL HAVE LAST PUSHBULLS 15M still have power still we have 3414 area need to be tested before we get good correction (BEAR IN MIND GOLD LONG TERM IS BULL)
We will only get this correction if 3414 area holds
Most likely will hold cos i can see 2985 area before we creating new highs for GOLD (2985 AREA WILL BE GOOD PLACE TO BUY AND HOLD)
Any way ONLY TIME WILL TELL
GOOD LUCK
