Gold Price Analysis July 30Gold (XAUUSD) Consolidating in a Triangle Pattern – Preparing for a Big Breakout
Currently, gold is moving within a triangle consolidation pattern, reflecting the market’s indecision as investors await a series of important economic data from the US this week. This hesitation suggests that a breakout from the triangle pattern could trigger a strong FOMO effect, creating a significant price movement in either direction.
The current price action is similar to a “bull flag” or “pennant” pattern, where a breakout could lead to a clearer and more decisive trend. If the support zone in the pattern fails to hold, the possibility of a sell-off is high.
Trading scenario:
🔻 Activate SELL order:
When price breaks the triangle bottom around 3324
Downside target: 3285, further is the strong support zone at 3250
🔺 Activate BUY order:
When price breaks and holds above the resistance zone 3333
Or: when there is a bearish rejection signal and candle confirmation at the area 3385
XAUUSDG trade ideas

XAUUSD Live Trade Last Night (Killed it with 11,641 USD Profits)I managed to ride the momentum last night on XAUUSD and made over 11,641 usd profit on a live trading account. Gold usually create a range. It will create a top and a bottom then it will spend most of its time inside that range. That is pretty much how XAUUSD moves. If you can identify the top and the bottom then you can short it from the top and do a long trade on the bottom. The price will just travel from bottom to top and top to bottom. You can scalp your way to profits on this move if you can time it properly. Once in a while, a break from the top or the bottom happens. This is where you switch from trading the range to trading breakouts.

xauusdxauusd Focus on red line
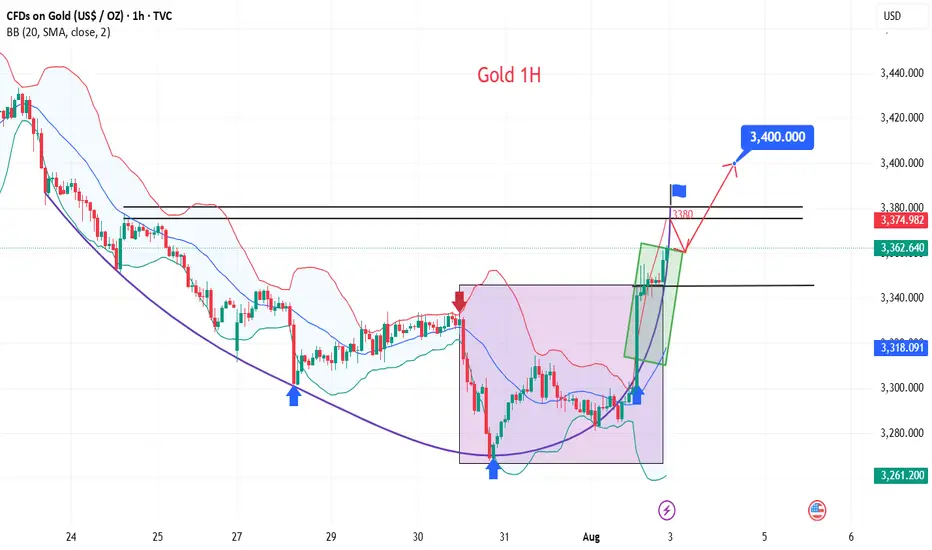
From the price level of 3368 and above, gold is expected to pull back at least until the Stochastic on the M30–H1 timeframes reaches oversold levels.
After that, a bullish continuation is likely, pushing the price up to around 3400.
This area will be a critical decision point — determining whether the market will continue its uptrend or reverse into a downtrend.
If the H4 chart prints a reversal candlestick pattern, it would indicate the beginning of a bearish trend, which could potentially lead to a downward movement of up to 20,000 points.

GOLD CONTINUATION PATTERNHello folks, here we go again, This idea stuck in my head only today and its friday. rather shared it or none, but see the charts for stops and target. this might be your lucky day on my page.
Here is my idea, take it if you love to swing or watch it fade. Congrats were on 800 community or I got more followers because of this. and Previous idea we made a lot thats 1200 pips good for a month trade. lets see this August. my target is labeled this chart first at 3500 zone. next target will be posted on my notes or updated the idea. no charts until it breaks that labeled on chart. until it goes higher again.
You will never see this kind of idea for a month again. So follow on my page, I have some for you if you have small accounts.d m here
My goal is to target the highest TP will be above this new highs.

Is Gold 3400 Still Far Away?
💡Message Strategy
The spot gold market experienced a V-shaped reversal trend.Driven by unexpectedly weak U.S. non-farm payrolls data and risk aversion triggered by Trump's new tariff policy, gold prices rose nearly 2% on Friday to a one-week high of $3,347.66 per ounce, up 0.4% for the week. The Federal Reserve kept interest rates unchanged, but weak employment data rekindled expectations of a September rate cut, increasing the appeal of gold as a non-yielding asset.
At the same time, Trump's decision to impose tariffs of 10%-41% on many countries has exacerbated market concerns about global trade tensions and boosted the safe-haven demand for gold.
📊Technical aspects
The 1-hour moving average of gold has begun to turn upward, and the 1-hour moving average of gold has a double bottom structure. However, gold should not have such a large pullback for the time being. After the non-farm payrolls on Friday, gold fell back to the 3335 line and then began to fluctuate upward at a high level. The 3335-3345 area was also an important platform support in the early stage. Therefore, gold will mainly be bought on dips above 3335 next week.
💰Strategy Package
Long Position:3345-3355,SL:3325,Target: 3380-3400
XAUUSD - 29/7/25 - continued bearish There was quite strong bearish momentum yesterday during the US session. Going into Asian session and London session today there is a consolidation bullish. There is a 4 hour zone marked out where i am looking for a retest and continuation bearish to a key zone below where a reversal pivot is expected and then continuing bullish with the larger trend.

SMC ✅ Strengths:
• Previous mitigation of institutional interest zones (1H FVG).
• BOS (Break of Structure) indicating bullish intent.
• Entry located at the 5M OB, which coincides with support and fake out (consistent with liquidity re-entry).
• TP is aligned with the previous resistance and distribution zone, which provides a good RR (2.23).
Good luck Traders

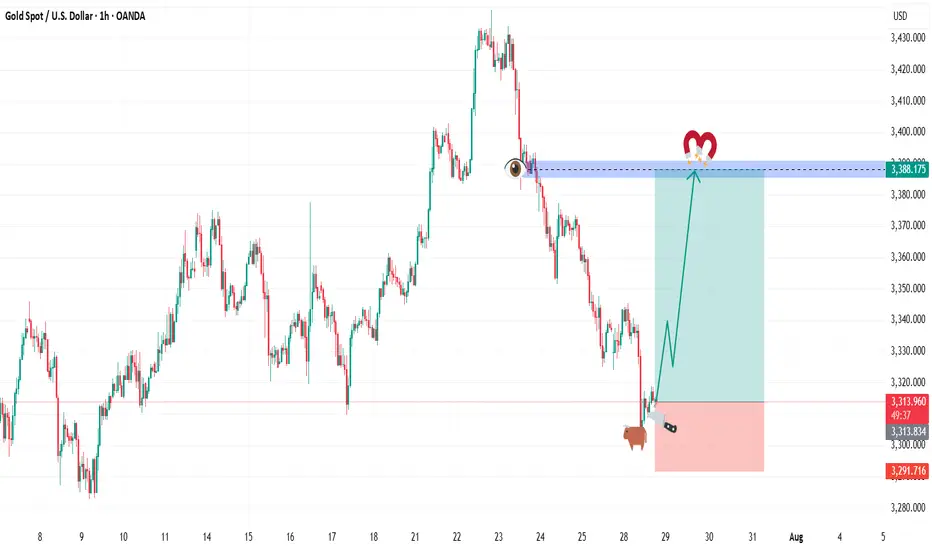
BUY GOLDIn todays session we are monitoring GOLD for buy opportunities. We have out entry at 3313.600 and stops below 3291 our target is at 3388.175 and higher. Use proper risk management. Cheers to you all.
Daily XAUUSD Outlook — Riding the Fed Wave (July 28, 2025)Hey Gold Hunters! 🌟
Today feels like the calm before a storm—ADP whispers tomorrow, the Fed speaks Wednesday, and gold is inching toward its next big move. Let’s weave the macro pulse into our Smart‑Money map, highlight the five real zones, then plot our sniper‑perfect entries. No fluff—just the human beat of the market.
1️⃣ Macro Pulse & Market Mood
US Dollar: Bullish tilt as markets price in another hawkish Fed pause.
Tomorrow (Tue): ADP jobs print could spark an early swing.
Wed PM: FOMC Statement & Powell’s press conference—biggest catalyst this week.
Thu/Fri: Core PCE, Unemployment Claims, then Friday’s NFP + ISM Manufacturing.
Gold is caught in suspense: a squeeze here (into supply) or a slide there (into demand) will come fast once the Fed drops its hint.
🧭 Bias: Neutral‑bearish—looking for lower highs under the 3,345–3,375 supply zone, with a preference to short rallies into that band until price convincingly breaks and holds above 3,375. Once we see a clean weekly‑style close above that level, we’ll flip to neutral‑bullish.
2️⃣ Five Breathing Zones (Top → Bottom)
🛑 Zone 1 “Sky Trap” (3,380 – 3,415)
The final airspace above our daily EMAs (10/50) where stops are hunted. Fib ext’s 127%–161.8% and an unfilled Fair‑Value Gap live here. Any spike that ends in a long upper wick or bearish engulf = short‑trap.
(let price fall clear of this zone before the next)
⚔️ Zone 2 “Premium Supply” (3,345 – 3,375)
The two‑week high order block, hugged by EMA50 and Fib 61.8%. Friday’s rejection candle was born here. Watch for bearish PA after a retest—your core sell zone.
(space down to next)
🌊 Zone 3 “First Demand Cove” (3,290 – 3,320)
Where mid‑June’s buyers piled in: June consolidation OB, filled FVG, and Fib 38.2–50% confluence. SMA100 sits below for extra gravity. A clean drop and bullish reaction here = sniper‑long trigger.
(gap to deep zone)
🚀 Zone 4 “Deep Pullback Bay” (3,240 – 3,270)
Hidden Fair‑Value Gap, BOS origin, and weekly EMA21 converge. If Zone 3 breaks, this is your deep‑dip reload—hunt that D1 reversal wick.
(last space)
🛡️ Zone 5 “Macro Reset Block” (3,000 – 3,140)
The root of 2024’s CHoCH, EMA200/SMA200 cluster, and 78.6–88.6% Fib retrace. Only if gold truly panics on a USD blitz—ultimate accumulation.
3️⃣ Sniper‑Perfect Scenarios
🔴 Short Setup
Where: A thrust into Zone 1 or 2 (3,345+).
Cue: Long upper wick → bearish engulf on D1/M30.
Edge: FVG fill + Fib confluence + RSI rollover.
🟢 Long Setup
Where: A dip into Zone 3 or, if swept, Zone 4.
Cue: Bullish pin‑bar or engulf + reclaim of EMA10/50.
Edge: June OB base + RSI bounce from ~50.
4️⃣ Your To‑Do List
Morning Watch: Does gold flirt with 3,375? Prep your shorts.
Mid‑Day Pull: A drop to 3,300? Hunt your longs.
Avoid: The gaps between zones—those are “no‑man’s land.”
News Trades: Let the daily candle close post‑Fed before committing.
💬 What’s your plan today? Comment below—let’s refine our edge!
👍 Enjoyed this map? Smash that Like & Follow for more pulse‑driven, zero‑fluff outlooks.
Disclosure: Chart powered by Trade Nation’s TradingView feed. I participate in their Influencer Program.
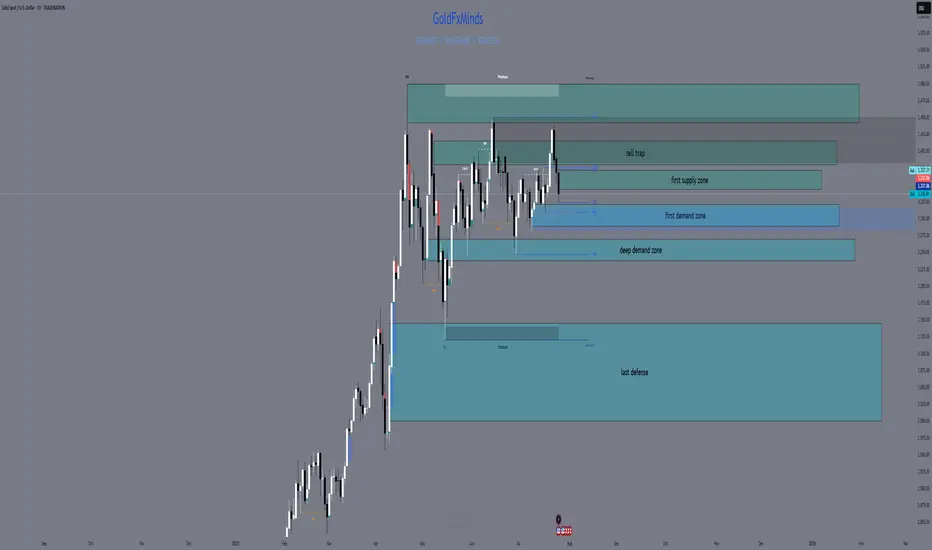
GoldFxMinds 💛
Gold Trade Plan 31/07/2025Dear Traders,
3304-3307 is very important area for Gold,
Pay close attention to the 3303-3307 zone. If you see a rejection in this area, you can enter a sell position.
if Fix above 3305------> 3351
IF Fix below 3305----->3267 (again)
Regards,
Alireza

XAUUSD Weekly Outlook – August 4–8, 2025New Month. New Week. New Questions.
Will the market reward hesitation — or bold reaction?
Will POTUS pump price with policy noise, or will smart money fade the manipulation?
August is historically a quieter month for hedge funds — but don’t mistake silence for safety. It's also the time when the Fed retreats to Jackson Hole, reflecting and recalibrating. Will September bring another rate cut… or another twist?
Stay sharp. This isn’t a month to sleep on.
"Last week's game plan played out nearly to perfection — well, almost! Let’s dive in and break down where gold could be headed next week."
Gold kicks off August with a strong breakout above $3360, powered by a weakening U.S. dollar, rising global risk appetite, and persistent institutional demand. With Jackson Hole on the horizon and shifting Fed expectations, volatility is set to spike. The big question: will gold extend above premium, or retrace to rebalance?
After the last rejection near 3440, price broke cleanly below its ascending channel. Now, gold appears to be forming a potential lower high around the broken trendline — a rejection here could trigger a drop toward the key $3250 support zone.
🟡 XAUUSD – August Macro Outlook
💰 Price: $3362
📅 Date: August 3, 2025
📈 Bias: Bullish but extended — high in premium
🔸 Monthly Overview
📊 Trend: Bullish continuation (CHoCH April 2023)
🧱 Supply Zone: 3350–3439 → monthly wick trap
⚠️ RSI 80+, price nearing 100% Fib extension
🔮 Breakout above 3439 → 3505 / 3610 next
🔻 Rejection → pullback to 3270 / 3180
🔸 Weekly Outlook
💥 Structure: Strong bullish, EMA stack intact
🟥 Final HTF Supply: 3350–3439 (currently testing)
🟦 Demand Below: 3270 → 3215 → 3070
🎯 Targets if breakout: 3505 → 3560 → 3610
🔸 Daily Structure
⚔️ Now testing: 3355–3375 → last valid supply
🎭 Above that → internal trap at 3398–3412
🧨 Final ceiling at 3430–3439 — breakout or reversal?
🔸 H4 / H1 Key Zones
🟥 Supply: 3360–3375 / 3385–3398 / 3430–3439
🟫 Flip Long Zone: 3322–3310
🟦 Bullish Demand: 3285–3260 → 3222–3205
⚠️ RSI elevated, watch for reaction not breakout
🔹 Execution Plan
✅ Above 3439 → Expansion to 3505 / 3610
🔁 Pullback to 3325 / 3285 → Sniper long zones
🔻 Rejection from 3375 → Short scalp → Target 3320
📌 3439 = Key Monthly Pivot
🟢 Hold above → New expansion wave
🔴 Fail below → Retrace toward value
Extended:
🔸 Scenario 1: Breakout and Expansion
If bulls push through 3375 with conviction and break above 3439, gold enters a fresh leg of macro price discovery. This would activate a clean expansion path toward:
3405 (short-term extension)
3505 → 3560 → 3610 (Fibonacci projections)
3740 (full trend extension if momentum persists)
This scenario requires solid bullish confirmation, especially on H4 or D1 structure. Traders should look for LTF OB re-entries or bullish flags above 3350 to join the trend safely.
🔸 Scenario 2: Rejection and Retrace
If gold rejects from the 3360–3375 zone and fails to hold above it, a controlled retracement is likely. Key downside targets include:
3325 → first flip zone for re-entry
3285 → origin of the latest rally (strong buy zone)
3215–3180 → high-timeframe demand and imbalance fill
Only a breakdown below 3260 would threaten the bullish structure and shift bias toward neutral or bearish.
🔸 Conclusion
Gold is approaching its inflection point. The macro trend is intact, but momentum is stretched, and the market now demands clear validation.
📌 3439 remains the weekly pivot:
Above → Expansion toward 3500+
Below → Retracement to reclaim value
For next week, the most probable path is early consolidation inside 3360–3375, followed by a decisive reaction — either continuation toward 3405+, or a corrective drop toward 3325/3285 to reset structure.
Disclaimer: For educational context only.
#XAUUSD #Gold #SmartMoney #TradingAnalysis #SMC #USD #GoldOutlook

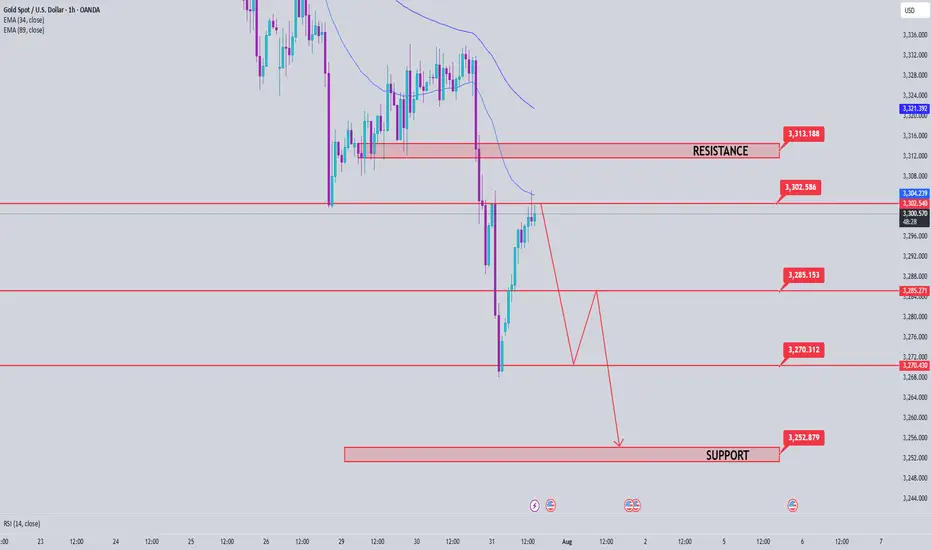
Gold price analysis July 31XAUUSD – Bearish pressure still prevails, watch for SELL in the direction of the trend
Yesterday's session witnessed a strong decline when the D1 candle closed with selling pressure up to 60 prices, forming a key candle that shapes the trend. When the market forms a main candle, the 25% and 50% candle body areas are often important price areas to continue trading in the direction of the main trend.
In the current context, the priority strategy will be to sell in the direction of the downtrend when the price rebounds to the resistance areas and there is a rejection signal.
🔹 Important resistance areas:
3301 – 3312 – 3333
🔸 Target support areas:
3285 – 3270 – 3250
🎯 Trading strategy:
Prioritize SELLing at the resistance area of 3301–3312 when there is a price reaction (rejection).
Target: 3250
BUY only considered when 3313 area is broken decisively.
Staying disciplined and sticking to the reaction price zone will be key in the context of the market moving in a clear trend.
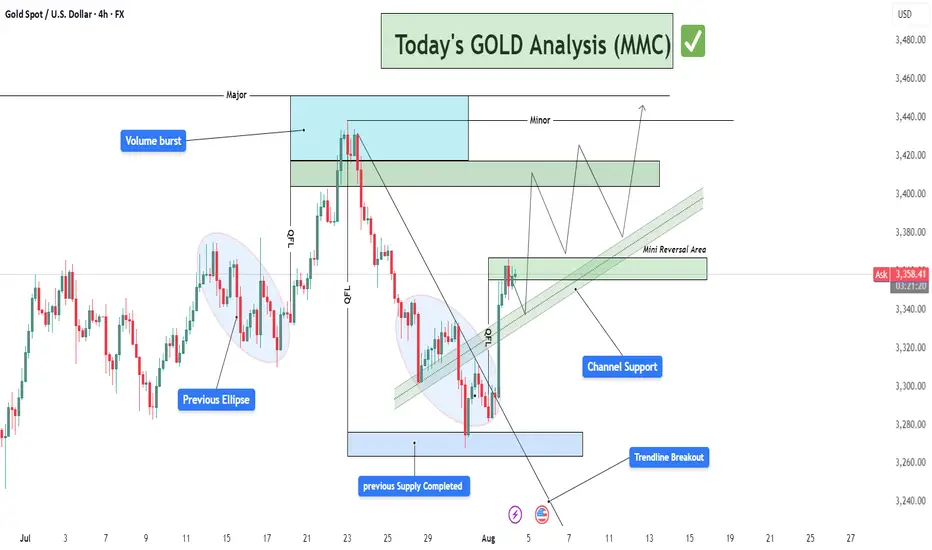
Today's GOLD Analysis : MMC Structural Analysis + Reversal ZoneThis analysis is rooted in MMC – Mirror Market Concepts, a framework designed to track institutional behavior through liquidity patterns, QFL (Quick Flip Levels), trendline shifts, and volume bursts. The current 4H Gold chart demonstrates a smart money footprint that provides actionable insight for intraday and swing traders.
🔍 Detailed Technical Breakdown:
🟦 1. Previous Supply Completed | Demand Zone Reversal
At the lower end of the chart, price entered a key blue zone around $3,250–$3,280, previously a supply zone now flipped into demand. This zone represents where institutional buyers absorbed liquidity, forming the base for a bullish impulse.
The strong reaction from this zone, marked by long-wick candles and immediate reversal, indicates exhaustion of selling pressure.
This reversal is confirmed by a QFL structure, meaning price created a fast liquidity sweep before flipping direction.
MMC recognizes this as a high-probability area of reversal, a point where smart money typically enters.
📈 2. Trendline Breakout & Structure Shift
A descending trendline, representing bearish market control, was decisively broken to the upside. This shift marks:
End of the corrective phase
Beginning of a bullish structural change
Buyers now control the short-term narrative
The breakout was not only clean but also supported by a volume burst, which is a classic MMC indicator that institutional traders are entering the market.
🔶 3. Volume Burst Confirmation
Volume behavior plays a critical role in MMC. We see a clear volume spike post-breakout. This suggests that:
The breakout is not false
Buyers were aggressively positioned
A sustainable move is in development
This supports the validity of the trendline breakout and confirms the idea that price is ready to test higher liquidity zones.
🟢 4. Current Price Structure: Bullish Channel
After the breakout, the market formed a bullish channel, where price is steadily climbing while respecting parallel boundaries.
The channel support line acts as a dynamic entry point for retracement buys
MMC strategy uses this structure to identify scaling entries at channel lows or after successful pullbacks into key reversal zones
🟩 5. Mini Reversal Area (Short-Term Resistance Zone)
Price is currently testing a minor supply zone or what MMC defines as a "Mini Reversal Area". This is a reaction zone before continuing toward the major target above.
There are two possible reactions:
Short-term rejection, leading to a pullback into the lower channel support zone
Minor consolidation, forming a base for a breakthrough toward major resistance
🟦 6. Major & Minor Supply Zones Above
Marked in light blue and green, these zones represent areas where previous selling volume and distribution occurred.
The major supply zone (approx. $3,440–$3,470) is the next institutional target
The minor zone sits between $3,400–$3,420 and may cause initial resistance or a base for another impulse
These levels are prime for partial profit-taking or scouting short-term reversal trades.
📊 Trade Management Insights:
🛒 Buy Opportunities (Long Bias):
On pullback into channel support near $3,340–$3,350
On bullish confirmation from mini reversal area
On break and retest above minor resistance at $3,420
🛑 Stop-Loss Suggestion:
Below the channel support or below the blue demand zone (approx. $3,245)
🎯 Profit Targets:
TP1: $3,400 (first resistance)
TP2: $3,420 (minor supply)
TP3: $3,450–$3,470 (major institutional level)
🧠 Mirror Market Concepts (MMC) Highlights:
QFL Structures = Institutional Reversal Points
Volume Burst = Confirmation of Breakout Validity
Trendline Breakout = Momentum Shift
Channel Structure = Controlled Climb Pattern
Mini Reversal Zone = Key Decision Point Before Continuation
🧭 TradingView Summary for Minds Community:
This GOLD chart beautifully aligns with the MMC method — spotting smart money involvement early and aligning with their flow. After confirming structural reversal via trendline and QFL, the setup now looks poised for continuation toward the $3,440–$3,470 zone, making it a perfect chart to watch for buy-the-dip setups.
Gold OutlookAfter our last idea, I'm looking to see gold sell down and then resume the upward trend. This is my personal conviction, always remember, I do not own the market
XAU / USD Weekly ChartHello traders. Just wanted to repost this weekly chart that shows the scalp trade set ups I will be looking for this week. All wicks get filled, albeit even partially if not full. Saying that, I will be monitoring the market to see how the overnight sessions play out. I will post some lower time frame analysis as we get into the week, or when I am gonna take a trade. New month, so trade carefully. Big G gets my thanks.. Be well and trade the trend. Wishing everyone a profitable trading week. I am gonna try to post the charts right as , or before I take any trades. Thank you so much for checking out my weekly chart analysis.

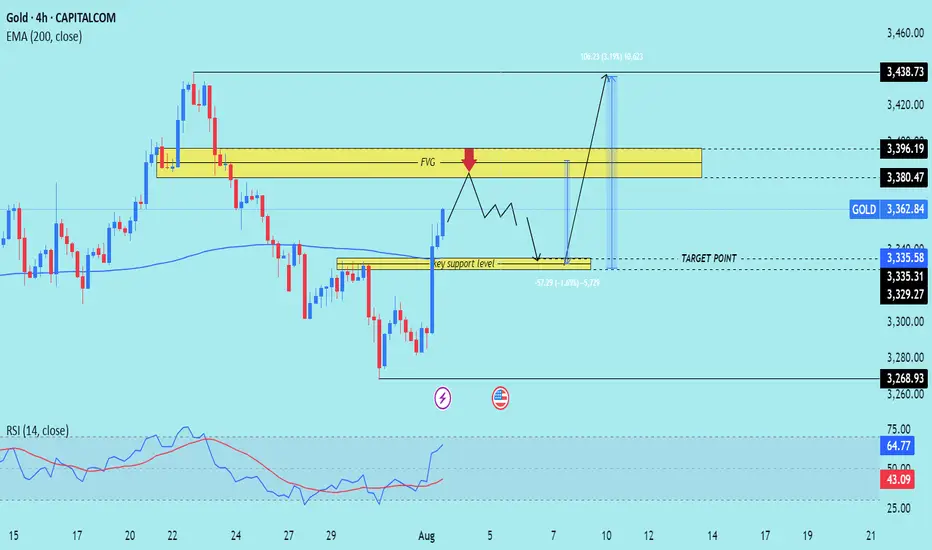
XAU/USD) Bearish Trend Read The captionSMC Trading point update
Technical analysis of (XAU/USD) on the 4-hour timeframe, showing both a potential retracement and a bullish continuation.
---
Technical Breakdown:
1. Current Market Structure:
Price recently made a strong bullish push from the key support level (~3,329–3,335), breaking structure to the upside.
It is now approaching a Fair Value Gap (FVG) and resistance zone between 3,380.47 and 3,396.19.
2. Key Zones Identified:
FVG / Resistance Zone: 3,380.47–3,396.19 — where price might initially reject (red arrow) due to unfilled imbalance and previous supply.
Key Support Zone: 3,329.27–3,335.31 — potential area of re-entry or demand if price pulls back.
EMA 200 (Blue): Currently at 3,335.58, aligning with key support.
3. Price Path Scenarios:
Primary Expectation: Price may tap into the FVG, face rejection, then pull back into the key support level for a higher low.
From there, it is projected to bounce back strongly toward the ultimate target at 3,438.73, marking a 3.19% upside move.
4. RSI (14):
RSI at 64.77, indicating strong bullish momentum but not yet in overbought territory. Favorable for continuation, but a short-term correction is possible.
Mr SMC Trading point
---
Trade Idea Summary:
Bias: Bullish (after a short-term rejection)
Entry Zones:
Watch for rejection at 3,380–3,396
Look to enter on a retest of 3,335–3,329 support
Target Zone: 3,438.73
Invalidation: Sustained breakdown below 3,329 or bearish engulfing with high volume
EMA & RSI Support: EMA 200 backs bullish bias; RSI confirms momentum
Please support boost 🚀 this analysis)
GOLD Local Short! Sell!
Hello,Traders!
GOLD made a retest
Of the horizontal resistance
Of 3313$ and we are already
Seeing a bearish reaction and
We will be expecting a further
Bearish move down
Sell!
Comment and subscribe to help us grow!
Check out other forecasts below too!
Disclosure: I am part of Trade Nation's Influencer program and receive a monthly fee for using their TradingView charts in my analysis.

Gold Spot / U.S. Dollar Analysis (15-Minute Chart)Key Levels
Support Levels:
Immediate: 3,294.000 (S/L level)
Next: 3,280.000
Resistance Levels:
Immediate: 3,304.000 (Entry level)
Next: 3,308.000, 3,316.250, 3,320.000
Profit Targets:
Tiered levels up to 3,328.000 (highest target).
Price Action & Trends
Current Trend:
The price is bullish (+0.84% today) but hovering near the entry level (3,299.000) and testing 3,302.700.
The presence of multiple profit targets above suggests a bullish bias in the trade setup.
Critical Observations:
Price recently dipped to 3,294.000 (S/L) but rebounded, indicating buying interest at support.
The 3,304.000 level (entry) now acts as resistance. A breakout above could target 3,308.000+.
Volume & Momentum:
Not visible in the screenshot, but the upward movement suggests moderate bullish momentum.
Trade Setup Analysis
Entry: 3,299.000
Stop-Loss: 3,294.000 (5 USD below entry)
Profit Targets:
3,304.000 (Breakeven+)
3,308.000 → 3,328.000 (Scalping opportunities).
Risk-Reward Ratio:
If targeting 3,328.000, the RR is ~5:1 (29 USD profit vs. 5 USD risk).
Actionable Insights
Bullish Scenario:
Hold if price sustains above 3,304.000 (entry resistance).
Next target: 3,308.000.
Bearish Caution:
If price falls below 3,294.000 (S/L), exit to limit losses.
Watch for rejection at 3,304.000 (potential reversal).
Market Context:
Gold is sensitive to USD strength and geopolitical events. Monitor broader trends for confirmation.

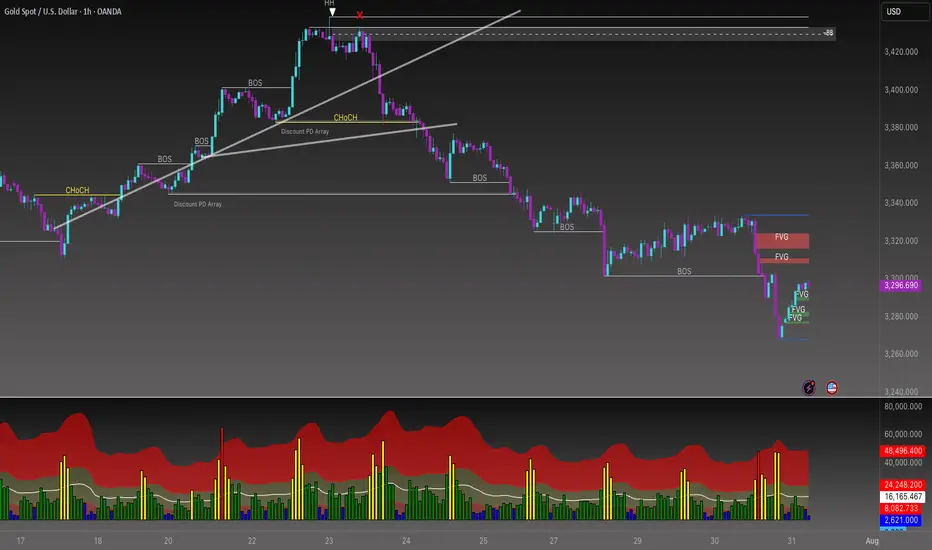
Beyond the Chart – GOLD Market Technical Analysis🧠 OANDA:XAUUSD Market Outlook: Gold (XAU/USD)
✅ Bullish Case (Upside Bias)
• Price has reclaimed multiple Fair Value Gaps (FVGs) on the way up.
• Holding above the 0.382 Fib level (3293) indicates moderate bullish momentum.
• A confirmed breakout above 3301 (0.5 Fib) may open the path to key resistance levels:
• 3308 (0.618 Fib)
• 3314 (0.705 Fib)
• 3319 (0.786 Fib)
📌 This move is likely a retracement rally within a broader downtrend — unless price reclaims above 0.786 with strength, confirming a shift in structure.
⸻
🛠️ Trading Plan
• Bullish Setup: Long above 3301, targeting 3308 → 3314, with tight stops.
• Bearish Setup: Look for rejection patterns at 3308–3314 zone, targeting a move back to the 3280 area.
⸻
📘 Disclaimer: This is educational content and not financial advice. Always do your own analysis and manage your risk accordingly
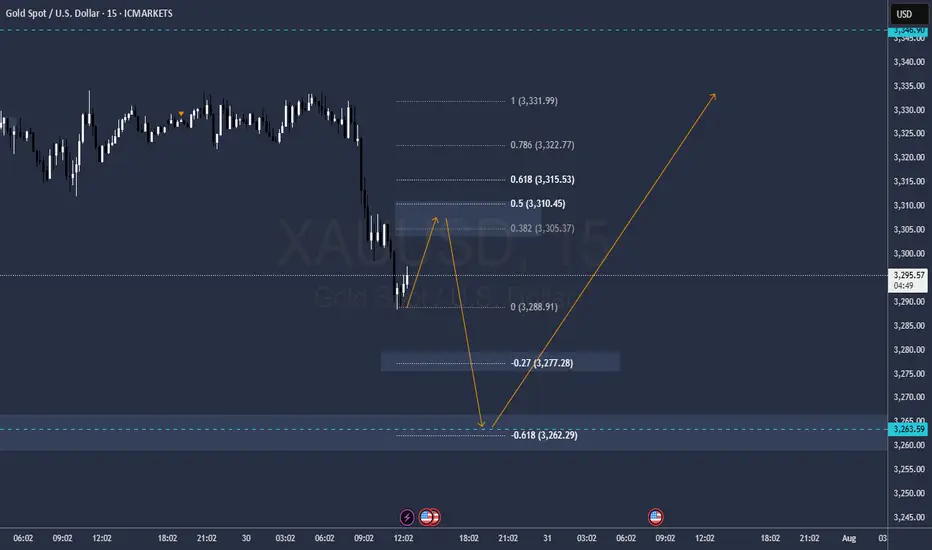
GOLD FOMC Ok it will be rising this previous FOMC 90 minutes but then will fall fasta and sharp
Sell levels 3305 / 3310 SL above .618
Targets 3277 3263
Reversal spectation on 3263 towars all time highs 3550 and 3650
XAUUSD: Market Analysis and Strategy for July 29Gold Technical Analysis:
Daily chart resistance: 3345, support: 3285
4-hour chart resistance: 3340, support: 3300
1-hour chart resistance: 3330, support: 3308.
After last week's sharp decline, gold continued its decline yesterday, breaking below its opening low and continuing its downward trend, reaching a low near 3300. In the short term, selling pressure is strong, but the rebound is weak, with a rebound high of 3330.
In terms of intraday trading, yesterday's low of 3301 was followed by a rebound. Focus on the resistance range of 3330-3338. Selling is recommended if the price is trading sideways between 3330-3338, with a defense of 3340. If it falls below 3300, the next target will be 3285.
Sell: 3338
Buy: 3302
Sell: 3300

XAUUSD 8/4/25 followupPrice closed strongly above Sunday's open so I am just looking for retracements to the upside from here.

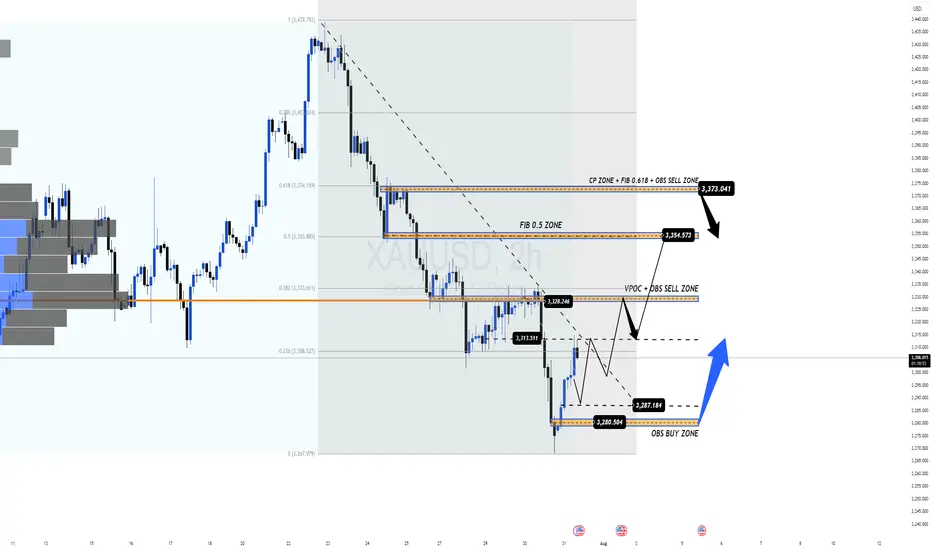
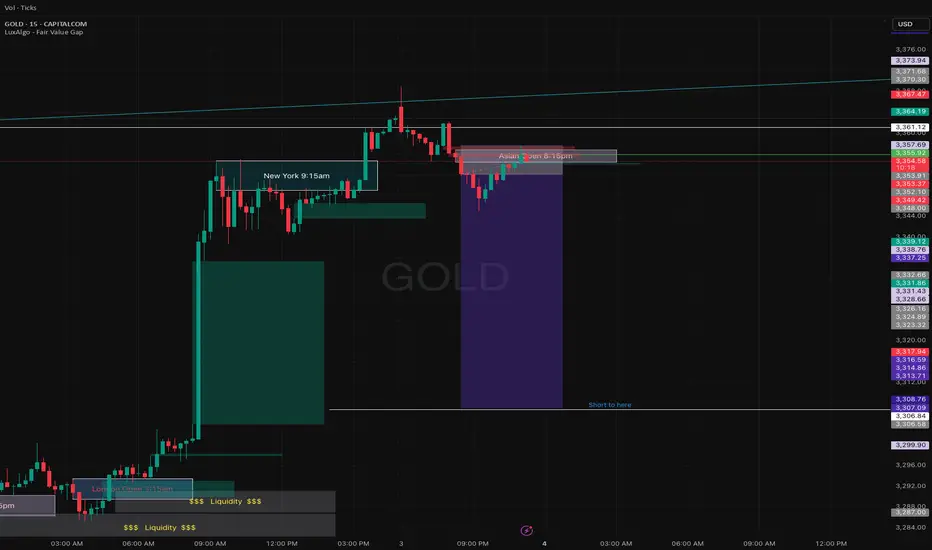
Bounce From Final Liquidity or Start of a Bullish Move? Bounce From Final Liquidity or Start of a Bullish Move?
After the FOMC event, gold completed a sweep of the final liquidity zone at 3269–3271 and rebounded strongly, in line with the broader bullish trend. The price has now recovered sharply and is gradually returning to the liquidity zones left behind after yesterday’s sharp drop.
📍 At the moment, gold is reacting around 3295, which aligns with a CP (Compression Point) Zone on the M30 chart. We're seeing a slight pullback here, and another retracement could occur before a strong upward continuation — potentially breaking out of the descending trendline that’s formed over recent days.
📊 Trading Plan & Key Levels
✅ BUY ZONE – Trend Continuation Setup
Entry: 3286–3284
Stop Loss: 3278
Take Profits:
3290 → 3294 → 3298 → 3304 → 3308 → 3312 → 3316 → 3320 → 3330 → …
💡 This is a prime area to look for re-entries into the dominant bullish move. Price action left a clean liquidity zone below after the aggressive upside reaction — ideal for riding the next wave.
❌ SELL ZONE – Only Valid Below VPOC
Entry: 3328–3330 (Volume Point of Control)
Stop Loss: 3335
Take Profits:
3324 → 3320 → 3315 → 3310 → 3305 → 3300
🔻 This is a high-probability short only if price stays below 3330. If gold closes above this VPOC region, the structure shifts to bullish and we should look for sells higher up — around 335x–337x zones.
📅 Monthly Candle Close – Watch for Indecision
As it’s the last trading day of the month, note that the past two monthly candles have printed doji-like wicks, signalling indecision and liquidity grabs. The market is still waiting for a clearer signal from the Fed on the first potential rate cut of the year.
🚫 Avoid emotional trading. This is a highly reactive environment, so careful risk management is key.
🧭 Final Thoughts
Gold continues to respect market structure and liquidity theory. The first major test lies at the 3313 resistance level — if broken, it opens the door to stronger bullish momentum toward the broader VPOC zone.
⏳ Be patient and only act when price confirms your bias.