Gold weekly chart with buy and sell entries plus swing trade ide1. Overall Chart Analysis
Timeframe and Trend: This 4-hour chart highlights a short-term downtrend with signs of exhaustion and consolidation. Gold peaked sharply on the left (possibly a local high around 2,400+), followed by a steep decline with lower highs and lower lows, forming what looks like a descending channel (diagonal trendlines connecting peaks and troughs). Recent candles show sideways ranging with smaller bodies and wicks, indicating indecision or a potential reversal setup. This could be a bear flag pattern or a base for accumulation.
Key Patterns:
Bearish Decline: Strong red candles early on suggest impulsive selling, possibly driven by external factors like USD strength or rising yields. However, the downtrend is losing steam, with recent bounces off lower levels.
Range-Bound Action: Price is trapped in a horizontal range (bounded by your marked lines), with dojis and spinning tops signaling buyer-seller balance. A breakout could lead to a volatile move.
Support and Resistance: Your green lines (lower) align with support zones where price has reversed upward multiple times. Red lines (upper) act as resistance caps, rejecting rallies.
Indicators (Inferred):
Moving Averages: Price is likely below key MAs (e.g., 50-period or 200-period EMA), confirming bearish bias. A golden cross (shorter MA crossing above longer) near green lines could validate buys.
RSI (Relative Strength Index): Potentially oversold (below 30) at green line tests, supporting buy entries. Neutral or overbought (above 70) near red lines would favor sells.
Volume and Momentum: Volume bars on the right show spikes on down moves but fading recently, hinting at bearish exhaustion. MACD might show narrowing histograms, indicating weakening momentum.
Volatility: If Bollinger Bands are applied, they're likely contracting, suggesting an imminent expansion (breakout).
Market Bias: Bearish in the short term due to the downtrend, but with bullish potential if support holds (gold's macro uptrend from inflation/geopolitical hedging). Watch for catalysts like US economic data or Fed announcements. The setup favors range trading (buy low, sell high) until a clear breakout.
Risk Considerations: Gold can move 50-100 pips per 4H candle; use tight stop-losses (SL) 1-2% away from entries. Risk no more than 1% of your account per trade. Multi-timeframe confirmation (e.g., daily chart) is recommended.
2. Analysis of Marked Levels and Entry Rationale
Your lines are horizontal, with green lines clustered at lower price levels (buy zones, e.g., around 2,300–2,320) and red lines at higher levels (sell zones, e.g., around 2,340–2,360). These appear to be based on prior price action (swing points). I'll group them by color and explain the technicals, drawing from support/resistance, patterns, Fibonacci, and momentum.
Green Lines: Potential Buy Entries (Bullish Setups)
These lower lines seem to mark strong support areas where price has bounced repeatedly, often with bullish candle formations. They could represent the floor of the descending channel or a demand zone.
Technicals Supporting Buys:
Support Zones: Green lines align with historical swing lows (e.g., visible double or triple bottoms in the chart's dips), where buyers have defended price. This creates a "value area" for accumulation, especially in gold's broader bullish context.
Candlestick Patterns: Bullish signals like hammers, bullish engulfing, or long lower wicks appear at these levels—indicating rejection of lower prices and potential reversal. For example, a green candle closing above the line after a touch would confirm entry.
Fibonacci Retracement: Drawing from the chart's high (left peak) to low, green lines likely hit key levels like 61.8% or 78.6% retracements—common for buying deep pullbacks in trending markets.
Momentum and Divergence: RSI bullish divergence (price lower lows, RSI higher lows) or an oversold reading supports upside. The downtrend's slowing pace (smaller red candles) suggests fading sellers.
Trend Context: These are counter-trend buys in a downtrend—ideal for scalps or reversals. Wait for confirmation, like a 4H close above the green line or increased volume.
Entry Strategy: Enter long on a retest of the green line with bullish confirmation (e.g., RSI >30 crossover). Place SL 20-30 pips below the line to account for wicks.
Suggested Take-Profit Levels:
TP1 (Conservative): Nearest minor resistance or 38.2% Fibonacci level—e.g., if entry at ~2,310, TP at 2,330 (1:1 risk-reward, ~20 pips profit for quick partial exit).
TP2 (Aggressive): Mid-range or next red line—e.g., 2,340–2,350 (1:2 ratio, scale out 50% of position).
Stretch TP3: If bullish breakout above the channel, target prior highs (e.g., 2,370–2,400). Trail stops using a 20-period MA or ATR-based levels for dynamic exits.
Red Lines: Potential Sell Entries (Bearish Setups)
These upper lines appear to cap price action, with rejections forming bearish patterns. They could be the ceiling of the channel or supply zones.
Technicals Supporting Sells:
Resistance Zones: Red lines correspond to prior swing highs (e.g., failed rallies in the mid-chart), round psychological numbers, or the upper channel boundary. Multiple touches with downside reversals confirm seller control.
Candlestick Patterns: Bearish indicators like shooting stars, bearish engulfing, or long upper wicks at red lines signal rally failures—sellers stepping in aggressively.
Fibonacci Extension/Retracement: From the downtrend's wave, red lines might align with 38.2% or 50% retracements—prime spots for selling into strength within a bearish structure.
Momentum Indicators: RSI overbought (above 70) or bearish divergence (price higher highs, RSI lower highs) at these levels reinforces downside. MACD line cross below signal line could trigger entries.
Trend Context: Aligns perfectly with the downtrend's "sell the rallies" mantra. The overall lower highs pattern suggests continuation unless broken.
Entry Strategy: Enter short on a rejection from the red line (e.g., red candle close below it with volume). Place SL 20-30 pips above the line.
Suggested Take-Profit Levels:
TP1 (Conservative): Nearest minor support or green line below—e.g., if entry at ~2,350, TP at 2,330 (1:1 ratio, ~20 pips for scalping).
TP2 (Aggressive): Lower range or channel support—e.g., 2,310–2,300 (1:2 ratio, partial close).
Stretch TP3: If bearish breakdown below green lines, target extended supports (e.g., 2,280–2,250 via 161.8% Fibonacci extension). Trail stops with a parabolic SAR or based on recent swing lows.
3. Additional Suggestions and Scenarios
Breakout Scenarios:
Bullish Breakout: A strong close above the highest red line (e.g., on high volume or positive news) invalidates sells—switch to longs targeting 2,400+ (macro resistance).
Bearish Breakdown: Close below the lowest green line accelerates downside to 2,250–2,280 (next major support, possibly a monthly low).
Risk-Reward and Position Management:
Prioritize 1:2+ RR (e.g., risk 20 pips to gain 40+). Use partial profits: Exit 50% at TP1, trail the rest.
Combine with oscillators: Avoid buys if RSI <20 (extreme oversold) or sells if >80 (overbought).
Time of Day: Gold volatility peaks in NY/London sessions; avoid thin markets.
Potential Biases or Warnings:
Gold's inverse correlation to USD (check DXY) or bonds could override technicals—e.g., a weak USD might break red lines upward.
The range is tightening; a false breakout is possible. If consolidation persists, consider straddle strategies.
This is a technical view only; fundamental shifts (e.g., Middle East tensions boosting gold) could alter dynamics.
XAUUSDG trade ideas

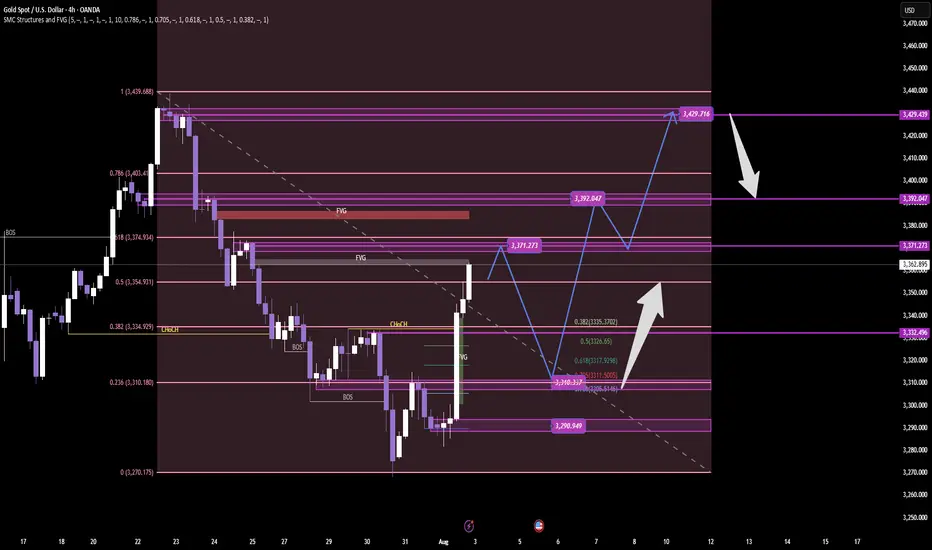
GOLD – SMC ProTrading Breakdown Plan Next WEEK GOLD – SMC ProTrading Breakdown | Clinton Scalper | 4H Timeframe
XAUUSD is currently displaying clear institutional order flow behavior after a deep liquidity sweep at the end of July. Here’s a full breakdown using advanced SMC (Smart Money Concepts) methodology:
🔍 1. Liquidity Sweep at the Low
Price maintained a series of lower highs and bearish structure until it executed a classic liquidity grab between 3,270 – 3,290. This is a textbook move by Smart Money: sweep retail stop orders before initiating a reversal.
This zone aligned with:
✅ Untapped Fair Value Gap (FVG)
✅ Reversal Order Block (OB)
✅ Fibo 0.236 of the mid-term bullish leg
After the sweep, the market printed a micro CHoCH, indicating early signs of smart money accumulation.
🧠 2. CHoCH → BOS → Reaccumulation Structure
CHoCH (Change of Character) marks the first break in the bearish microstructure – suggesting a possible shift.
Then, price delivered a BOS (Break of Structure) around the 3,334 zone, confirming bullish intent.
Buy-side is now:
Positioned from a deep discount zone
Mitigating key inefficiencies
Targeting higher liquidity zones above current price
Price is currently reacting to a previous supply OB around 3,362.
📐 3. Institutional Order Flow & Target Zones
Now that price is in a key reaction zone, we prepare for two high-probability scenarios:
🅰️ Continuation Scenario (Reaccumulation)
A retracement to the 3,317–3,311 zone (Fibo 0.5–0.618) could offer a premium re-entry
This area is stacked with:
FVG
Order Block
Equal lows liquidity
🔼 From there, potential targets include:
🎯 TP1: 3,371 – previous imbalance zone
🎯 TP2: 3,392 – minor liquidity cluster
🎯 TP3: 3,429 – premium OB and high-liquidity zone
🅱️ Distribution Scenario (Bearish Rejection)
If price fails to hold bullish structure and forms a bearish CHoCH around 3,392–3,429
This would signal a distribution zone, and potential reversal back toward 3,290 support
🔂 4. Smart Money Flow Logic
“Smart Money doesn’t follow price. They lead price to liquidity.”
This chart reflects the complete Sweep → CHoCH → BOS → Mitigation → Expansion sequence. A classic SMC Pro model where:
Liquidity is engineered and swept
Structure is shifted
Price returns to mitigate institutional entries
Price expands into external liquidity
📌 Clinton Scalper Outlook:
We don’t chase reversals – we track the footprints of capital. The real edge is understanding where smart money is positioned, and aligning with their narrative.
🔔 Stay tuned for continued updates using this precise and probability-driven Pro SMC framework.
GOLD Short From Resistance! Sell!
Hello, Traders!
GOLD surged up sharply
On Friday and is already
Retesting the horizontal
Resistance of 3377$
From where we will be
Expecting a local pullback
On Monday as Gold
Is locally overbought
Sell!
Comment and subscribe to help us grow!
Check out other forecasts below too!
Disclosure: I am part of Trade Nation's Influencer program and receive a monthly fee for using their TradingView charts in my analysis.

Gold Approaches Key Reversal Zone After Liquidity Sweep.Gold has recently broken out of a parallel channel during the New York session, followed by a strong upward move triggered by the NFP (Non-Farm Payroll) news event. Currently, the market is trading near a key trendline resistance zone. In this area, the price has also swept the liquidity residing above recent highs, indicating that potential buy-side liquidity has been taken out.
This level now becomes critical for observation. If the market forms a Market Structure Shift (MSS) or provides any valid bearish confirmation — such as a strong rejection candle, bearish engulfing, or a break of lower timeframe support — then there is a high probability that a downward move may follow from this zone.
As always, conduct your own research (DYOR) and wait for price action to confirm the bias before executing any trades. Acting on confirmation rather than assumptions protects both capital and strategy.

Gold continues to go long in the 3280-3300 range.Gold continues to go long in the 3280-3300 range.
Today, we remain firmly bullish on a bottom in the 3280-3300 range.
On August 1st, the Federal Reserve, while keeping interest rates unchanged, acknowledged slowing economic growth, triggering a repricing of expectations for a rate cut.
This led to a rebound in gold prices, but of course, this was just a pretext for the price increase.
Recently, gold prices experienced a four-day decline (July 23-28), falling from $3431 to $3268, as progress in trade negotiations and a rebound in the US dollar dampened safe-haven demand.
Non-farm Payrolls
Here are the key takeaways:
Today's US July non-farm payrolls data (expected to increase by 110,000, compared to 147,000 previously) will determine expectations for a September rate cut by the Federal Reserve.
A weak reading (e.g., below 100,000) could push gold prices back towards $3,400;
A strong reading (above 150,000) would remain bearish for gold. Gold prices continue to decline, and we are long in the 3280-3300 range.
Today, we remain firmly bullish on gold bottoming in the 3280-3300 range.
On August 1st, the Federal Reserve, while keeping interest rates unchanged, acknowledged slowing economic growth, triggering a repricing of rate cut expectations in the market.
This led to a rebound in gold prices, but of course, this was just a pretext for the price increase.
Recently, gold prices experienced a four-day decline (July 23-28), falling from $3431 to $3268, as progress in trade negotiations and a rebound in the US dollar dampened safe-haven demand.
Non-farm Payroll Data
Here are the key takeaways:
Today's US July non-farm payroll data (expected to increase by 110,000, compared to 147,000 previously) will determine expectations for a September rate cut by the Federal Reserve. A weak reading (e.g., below $100,000) could push gold back to $3,400.
A strong reading (above $150,000) would continue to be bearish for gold.
Technical Analysis and Trading Recommendations
Key Levels:
Support:
$3,270 (100-day moving average)
$3,248 (June low);
Resistance:
$3,300 psychological level
$3,340 (21-day/50-day moving average crossover).
Trading Strategy:
Short-term:
1: If the price holds above $3,300, initiate a long position with a target of $3,330-3,350.
2: If the price falls below $3,270, a drop to $3,248 is possible.
3: Focus on the key watershed at $3,300
4: Key Point:
As long as the gold price is above $3,300, I believe it's a good time to buy the dip. Following the upward trend in gold prices is a very wise choice.
As shown in Figure 4h:
The potential for gold prices to rebound is becoming increasingly clear.
The lower edge of the wide fluctuation range is slowly stabilizing.

BuyLondon Session
Daily Volume
Untapped Zone
Market Structure
NT:: Limit order must be tapped before the breach of the red line
GOLD BEARISH BIAS|SHORT|
✅GOLD broke the rising
Support line which is now
A resistance and the price
Is retesting the line now so
We are locally bearish biased
And we will be expecting a
Local move down
SHORT🔥
✅Like and subscribe to never miss a new idea!✅
Disclosure: I am part of Trade Nation's Influencer program and receive a monthly fee for using their TradingView charts in my analysis.

XAUUSD ShortI am a beginner trader! This is just an analysis for educational purposes. I don't provide signals for trading.

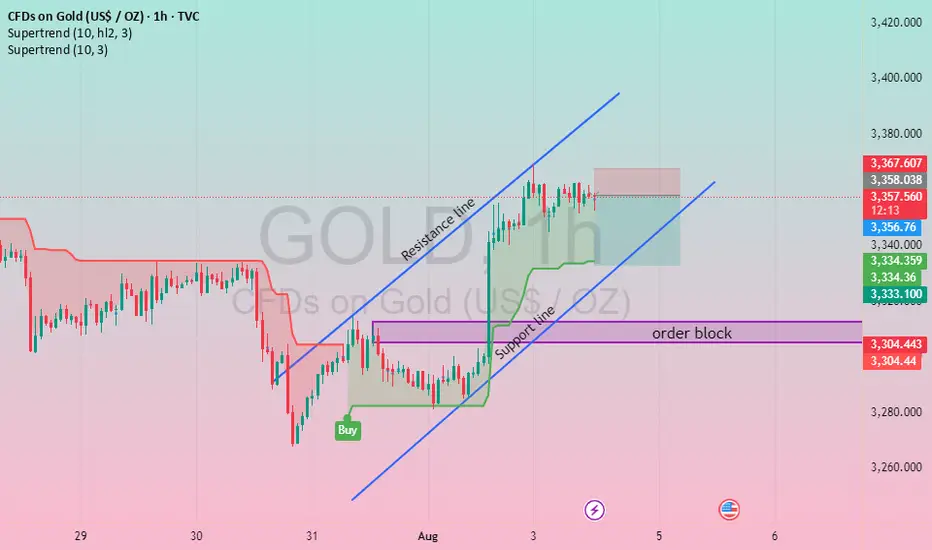
Bullish Breakout From Demand Zone – GOLD 1H Analysis📈 GOLD (XAU/USD) – 1H Chart Technical Analysis
Date: August 4, 2025 | Timeframe: 1-Hour
This chart presents a clear bullish structure on GOLD, indicating upward momentum following a significant reversal from a previous downtrend.
🔹 Key Technical Elements:
Ascending Channel:
The price is trading within an upward channel, bounded by a support line (lower blue trendline) and a resistance line (upper blue trendline).
This reflects a short-term bullish trend, with higher highs and higher lows.
Order Block Zone (Purple Box: $3,304 – $3,305):
This area represents a previous consolidation and institutional demand zone.
Price reacted strongly from this zone, confirming it as a valid support and buy zone.
Buy Entry Confirmation:
A buy label is placed at the breakout from the consolidation range, showing a bullish order flow initiation.
Supertrend Indicator:
The Supertrend is green, confirming bullish sentiment.
Current values: $3,334.36 and $3,334.359, acting as dynamic support.
Resistance Ahead:
The price is currently near a minor resistance (highlighted red zone), where a short-term pullback may occur before further continuation.
🔸 Possible Scenarios:
Bullish Continuation:
If price sustains above the support trendline and breaks the resistance zone near $3,367, we may see a move towards $3,400+.
Bearish Pullback:
If the price breaks below the support line and enters the order block, it could retest $3,304–$3,305 before rebounding or continuing down
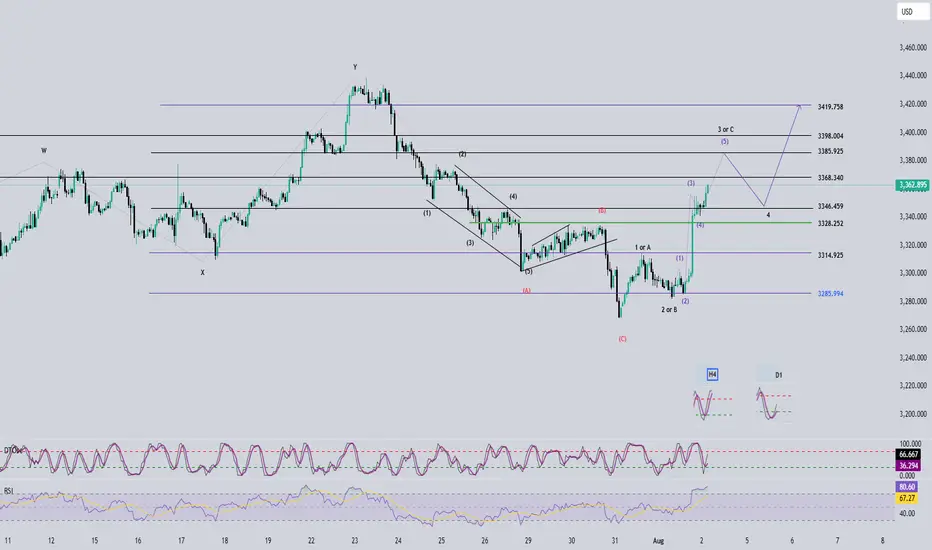
Elliott Wave Analysis – XAUUSD, August 4, 2025📊
🔍 Momentum Analysis:
D1 Timeframe: Momentum continues to rise strongly. It's expected that the price will keep rising for at least two more trading days, pushing the momentum indicator into the overbought territory, reinforcing the current bullish trend.
H4 Timeframe: Momentum is showing signs of a potential bearish reversal, indicating a possible corrective pullback during Monday’s trading session.
H1 Timeframe: Momentum is strongly bullish, especially evident from the powerful upward move on Friday. Price may continue rising at the open of the Asian session, potentially creating a Gap. However, caution is advised, as this Gap could signal exhaustion.
📌 Wave Pattern Analysis:
Given Friday's strong price action, the primary scenario currently favors wave 3 within the 5-wave bullish structure (12345 – black). However, we cannot entirely eliminate the possibility that this is wave C within an ABC corrective structure (black).
Presently, the price is forming a smaller 5-wave bullish structure (blue), likely in the final wave 5. Attention should be paid to two critical target zones:
🎯 Blue Wave 5 Targets:
• Target 1: 3368
• Target 2: 3385
⚠️ Next Scenario:
Upon completing the blue 5-wave structure, a corrective move downward will occur.
• If the correction does not break below 3315, the larger 5-wave bullish structure (12345 – black) is confirmed, and the price will continue upward to complete black wave 5.
• If the correction breaks below 3315, the structure shifts to an ABC corrective pattern (black), increasing the likelihood of a deeper decline to complete the larger corrective wave C (red).
🧩 Combining Momentum & Wave Analysis:
• D1 momentum strongly supports the continuation of the bullish trend.
• H4 momentum forecasts a short-term bearish correction on Monday, aligning with the formation of wave 4 correction.
• H1 momentum suggests the possibility of a Gap at Monday's Asian session open, marking the beginning of a corrective pullback as momentum reverses.
🎯 Short-term Trading Plan:
We will trade the current blue wave 5 with the following limit order plan:
✅ Sell Limit Zone: 3385 – 3387
⛔️ Stop Loss (SL): 3399
🎯 Take Profit (TP1): 3368
🎯 Take Profit (TP2): 3355
📌 Note:
The detailed trading plan for capturing the larger wave 4 correction (black) will be updated once sufficient evidence confirms the completion of the blue wave 5.
Happy trading, everyone! 🚀
XAUUSD Expecting bullish Movement Price respected the Strong Demand Zones at 3350 & 3340, showing clear signs of buyer strength. After forming a falling wedge pattern, a bullish breakout was observed — confirming potential upside momentum.
Zone Analysis
3350 Zone: Minor support confirmed with consolidation
3340 Zone: Stronger support with buying pressure visible
Current Price: 3362
First Target: 3380
Second Target: 3399
A clean move above the wedge resistance is now playing out, and as long as price holds above 3350, bullish momentum remains valid.
Monitoring price action around 3380 for partials, and watching for clean sweep into 3399

XAUUSD
XAUUSD Updated in H1 :
The gold signal is marked on the chart based on the latest price changes and the supply and demand in the market. These points include the entry point, stop loss, and take profit

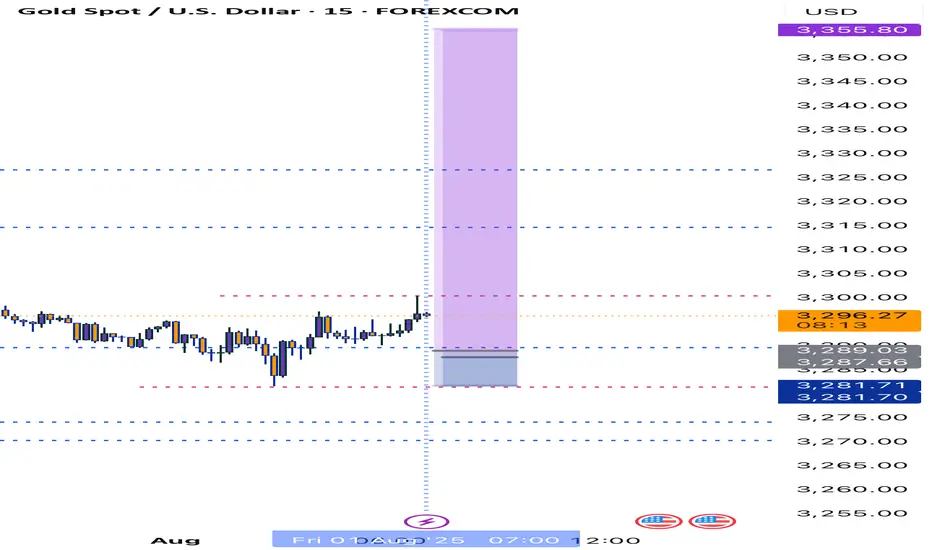
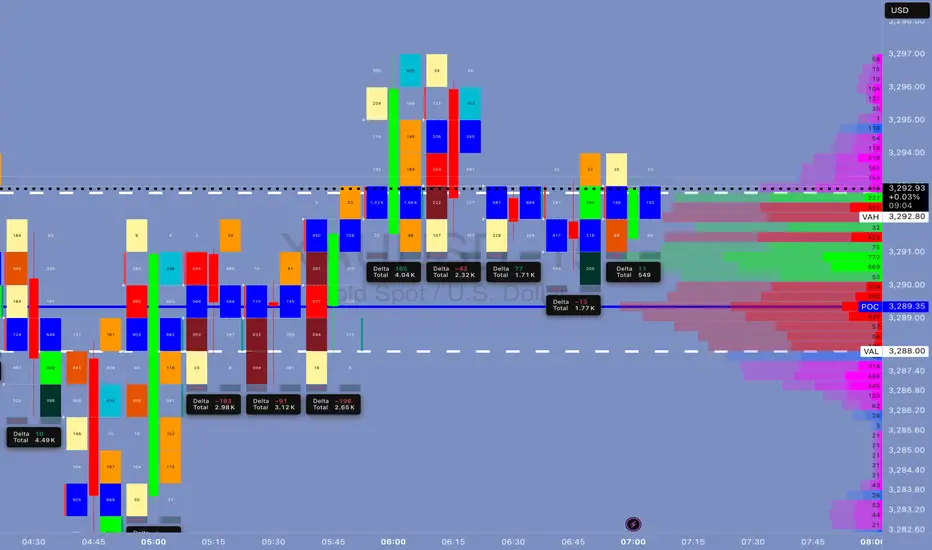
XAUMO XAUUSD (Gold Spot) ANALYSIS | AUG 01, 2025 | CAIRO TIME GMThis is a stealth bullish accumulation day. Market maker completed a fake drop and now prepping breakout. Play long bias from control zone with stop-hunt fade backup. Schabacker would call this a false breakdown spring + congestion base rally.
XAUUSD (Gold Spot) ANALYSIS | AUG 01, 2025 | CAIRO TIME GMT+3
🔍 Multi-Timeframe Technical Breakdown (Daily → 5m)
1️⃣ Price Action & Patterns
Daily: Bullish rejection tail forming (pin bar) off VAL (3,288). Strong buyer defense.
4H: Classic bullish engulfing off VAL support. High rejection wick to downside. Micro-structure shows market maker trap.
1H: V-shape recovery seen. Absorption bar confirmed via footprint delta spike.
15m: Buyers stepping in at POC (3,289.35), stealthy buying—confirmed by divergence between delta & price.
5m: Accumulation in box range between 3,289–3,292. High absorption on bid side, low offer lifting—sign of stealth long build.
2️⃣ Volume & Delta Footprint
POC Cluster across all TFs: 3,289.00–3,291.50 is the control zone.
Volume Node Rejection at 3,288 = confirmed buyer base.
Delta: Absorption → sellers hitting bids but no follow-through = market maker trap → bullish implication.
Volume Spike at 3,288 = fakeout move likely manipulated to hunt stops.
3️⃣ Support/Resistance
VAL: 3,288 🔥 Strong Demand Zone
POC: 3,289.35–3,291.75 🧠 Smart Money Zone
VAH: 3,292.80 🎯 Break above confirms momentum
Res. Extension: 3,296.20, 3,300
Fibonacci Confluence: 3,288 = 61.8% golden retracement from recent rally
5️⃣Volatility
Compression near VAH = Volatility Expansion imminent.
Expect Breakout in next 1–2 hours (likely post 09:00 Cairo Time – Kill Zone)
6️⃣ Market Maker Philosophy
Last 3 days show liquidity vacuum trap below 3,288.
MM has triggered stop hunts to shake weak longs.
Building long inventory stealthily under POC.
Expecting rally trap to suck in breakout buyers → then retrace → final breakout continuation.
🧨 JEWEL TRADE ENTRY (Highest Probability)
📈 Order: Buy Stop
🎯 Entry: 3,293.10
🛑 Stop Loss: 3,287.70
💰 Take Profit: 3,302.40
📊 Confidence: 87%
🧠 Justification: Breakout of VAH/Golden Zone + High Volume Node = Trend Shift Confirmed
This is for EDUCATIONAL PURPOSE ONLY, and not financial advise.
Direct Buy In Gold : Coming Currently gold is trading under falling wedge pattern which will explode soon once volume will come . Buying here is good idea imao

Where is GOLD going next?In the last four months, GOLD privided us a common pattern (for four times) that usually lead to an explosive moves. Where are we going next and what could be the target? In this case, time help us to understand better. The pattern is not complete yet and i expect the move to run in 24 hrs (maybe due to the high impact news will we have tomorrow, like the Initial Jobless Claim and CPE?). Now we just need to understand where the price will go to make profits, and to try to understand this we will check the RSI and the MACD. When this pattern occured, the RSI was rising and above 50 for three times with MACD on bullish cross (the three times that the price pumped) and was chopping and struggling close to 50 (but below it) with a bearish cross on MACD the single time it crushed. If we look at the actual situation, RSI is rising and MACD it's on bullish setup, but i will update you tomorrow (or when a breakout will occur). Now, for the possible target, we can easily aim to $100 move. So, price can touch $3420 for a long or $3240 for a short.
What do you think guys? Let me know in the comments!

Gold Intraday Trading Plan 7/31/2025Gold behaved as expected yesterday. It broke the channel and fell heavily, breaking both 3300 and 3280 supports. The bearish momentum is very strong right now.
I am looking for selling opportunity from 3300 and target 3255, which is my weekly target.

Gold May Dip Mildly Before US Data📊 Market Overview:
Spot gold is trading around $3,329/oz, up ~0.1%, supported by falling U.S. Treasury yields and a slightly weaker dollar, while investors await potential Fed dovish signals or rate cut in September . Meanwhile, easing U.S.–EU trade tensions weighed on safe-haven demand for gold.
📉 Technical Analysis:
• Key Resistance: ~$3,335–3,350 (recent highs and potential test zone)
• Nearest Support: ~$3,310 (previous stable support)
• EMA09 position: Price is above EMA9, indicating a mild bullish bias in the short term
• Momentum/Volume: RSI ~53 (neutral), MACD & StochRSI showing small buy signals. However, bullish momentum is fading, suggesting a possible mild pullback
📌 Conclusion:
Gold may dip modestly toward $3,310 if the dollar strengthens or if Fed rate-cut expectations recede. A break above $3,335–3,350 could pave the way for further gains, though current momentum remains insufficient to confirm a breakout.
💡 Suggested Trade Strategy:
SELL XAU/USD: $3,333–3,336
🎯 Take Profit: 40/80/200 pips
❌ Stop Loss: $3339
BUY XAU/USD: $3,310–3,308
🎯 Take Profit: 40/80/200 pips
❌ Stop Loss: $3305

Gold analysis by majidbabaeiasl My predictions for gold in previous years have been quite accurate and calculated. Right now, I think a wave 4 correction, which is a micro-wave, is taking place.

XAUUSD Outlook – July 29, 2025
Gold enters a high-risk environment starting today.
All eyes are on Jerome Powell's speech, which will signal whether the Fed remains firm on its hawkish stance or adopts a more dovish tone.
📈 That said, a broader look at the chart suggests the market has already aligned itself with the dominant trend.
🗓️ In addition to today’s speech, tariff-related news expected on Friday doesn’t seem likely to disrupt the ongoing bullish momentum in gold — or in crypto markets, for that matter.
🧠 That’s the general market read I'm sensing right now, but we’ll have to see how it unfolds.
🎯 Personally, I still view the $3290 level as a solid buy zone, with the potential to become one of gold’s historical bottoms.

The latest trend analysis and layout of the day,flexible adoptio#XAUUSD
⚠️News focus on the Sino-US trade talks, which may affect the gold trend.
Since the opening of the market today, gold has been fluctuating in a narrow range in the short term, without giving a clear trading direction🤔, and the short-term trend has not changed much.📊
🚦It remains constrained by resistance and a downward trend. In the short term, we need to pay attention to the 3300 mark below and the support of 3295-3285📈. On the upside, we should pay attention to the short-term suppression level of 3321-3333 and yesterday's high of 3345-3350.📉
In the short term, as long as it does not break through yesterday's high point, the volatile downward trend will not change. 🐂Once it breaks through, the short-term decline will stop, and the market will continue the bull rebound to test 3370~3380 or even 3400 before falling again.
Therefore, short-term trading focuses on the 3300 mark below and the long trading opportunities at 3295-3285. On the upside, defend the 3345-3350 highs and establish short positions.🎯
🚀 BUY 3310-3330
🚀 TP 3321-3333
🚀 BUY 3295-3285
🚀 TP 3310-3330
🚀 SELL 3320-3330
🚀 TP 3310-3300
🚀 SELL 3345-3350
🚀 TP 3330-3285

Gold Recovery Setup = Divergence + Support ClusterGold ( OANDA:XAUUSD ) fell to the lower line of the ascending channel and the Support zone($3,350-$3,326) , as I expected in my previous idea .
Gold is currently near a set of Supports .
Supports:
Support zone: $3,350-$3,326
Monthly Pivot Point: $3,333
Potential Reversal Zone(PRZ): $3,339-$3,329
Lower line of the ascending Channel
50_EMA(Daily)
Support lines
In terms of Elliott Wave theory , Gold appears to be completing a bearish wave 5 .
Also, we can see the Regular Divergence(RD+) between Consecutive Valleys .
I expect Gold to rise to at least $3,359 .
Second target: $3,367
Note: Stop Loss (SL) = $3,319
Do you think Gold can break the Support cluster by the end of trading hours?
Gold Analyze (XAUUSD), 1-hour time frame.
Be sure to follow the updated ideas.
Do not forget to put a Stop loss for your positions (For every position you want to open).
Please follow your strategy; this is just my idea, and I will gladly see your ideas in this post.
Please do not forget the ✅ ' like ' ✅ button 🙏😊 & Share it with your friends; thanks, and Trade safe.

Gold soaring with NFP debacle as an catalystQuick update: Gold is Trading on NFP fuelled relief rally and Bearish Technicals are invalidated once again (I announced lately that this might happen if NFP delivers downside surprise / debacle). The Hourly 4 chart's Ascending Channel increases it's gains towards Overbought levels as #3,352.80 benchmark is showcasing strong durability. Both Weekly chart (#1W) and Monthly (#1M) are on mild gains (# +0.65% and # +0.71% respectively) and with ranging candles (Gold consolidating above the Support for the fractal) I do not see any rebound (to the downside) possibility yet.
My position: As discussed above, I will keep Buying every dip on Gold and will not Sell Gold throughout today's session (if I do, will be aggressive in & out Scalp only). Gold remains very sensitive to every Bullish development while Bearish ones are still on second place.

Gold Continues Its Upward Momentum Despite Short-Term Pullback📊 Market Summary
• Spot gold slipped slightly by ~0.1% to around $3,354–$3,361/oz due to profit-taking after last week’s sharp rally following weaker-than-expected U.S. job data
• The U.S. added only 73,000 jobs in July, boosting expectations of a Federal Reserve rate cut in September, with a current market probability of around 81%
• Ongoing geopolitical risks, trade tensions, and robust central bank and ETF gold demand continue to support the long-term bullish outlook
________________________________________
📉 Technical Analysis
• Key resistance: ~$3,360–$3,370/oz (short-term highs, potential profit-taking zone).
• Nearest support: ~$3,330/oz (watch for buying interest on pullbacks).
• EMA09: Price is currently hovering around the short-term EMA (~EMA09), still below EMA50, indicating a mild sideways bias. According to Economies.com, gold hasn’t confirmed a stable uptrend above EMA50 yet
• Candlestick / volume / momentum:
o Today's candle shows mild profit-taking, but momentum remains bullish from the prior session. Volume shows light distribution, not strong selling.
________________________________________
📌 Outlook
• Gold may continue rising slightly in the short term if the upcoming U.S. inflation data (due August 12) remains soft, reinforcing the likelihood of a Fed rate cut
• Conversely, if the U.S. dollar strengthens unexpectedly or new data comes out more robust, gold could retreat back to the $3,330 zone.
________________________________________
💡 Suggested Trading Strategy
SELL XAU/USD : $3,370–$3,373
🎯 TP: 40/80/200 pips
❌ SL: $3,377
BUY XAU/USD : $3,330–$3,333
🎯 TP:40/80/200 pips
❌ SL: $3,327
