GOLD BUY SETUP • Premium Zone Rejection:
• Price has tapped into a higher-timeframe supply zone (~3,380–3,400), showing early signs of exhaustion.
• Bearish reaction here is consistent with smart money offloading positions.
• Equal Highs Liquidity Sweep:
• A sweep of engineered highs (₤₤₤) before the drop hints at a classic liquidity grab, possibly triggering sell-side momentum.
• Anticipated Pullback:
• Expecting a corrective move toward the demand zone (around 3,285–3,310), aligning with discounted entry pricing for long setups.
• Bullish Continuation Potential:
• If price respects the demand zone and forms a higher low, a bullish continuation toward new highs is likely.
XAUUSDG trade ideas

Gold Possible Retest of $3,365 Before Downside MoveGold is currently trading around $3,335, approaching a critical resistance level at $3,365, which has been marked as a “Main Resistance” on the chart. The recent price movement shows a strong bullish rebound from the $3,293–$3,300 support zone, breaking above two key trendlines labeled "Breakout."
The chart suggests a potential “retest” of the $3,365 resistance before another downward move, as marked by the annotation "Possible Retest and Then Down." This idea is reinforced by the broader descending channel pattern visible from late June, indicating that the larger structure still favors bearish continuation unless a strong breakout occurs above $3,365.
⚠️ Bearish Confluence
Price is inside a corrective channel, repeatedly failing to sustain above prior highs
$3,365 has held firm multiple times as resistance — a strong horizontal and trendline convergence zone
Price is still well below the swing high at $3,392
🟩 Bullish Scenario (If Invalidation Occurs)
If price breaks and closes above $3,365, it would invalidate the current bearish structure and open the door for upside targets like:
$3,392 (previous high)
$3,412
Possibly $3,434, which is a longer-term diagonal trendline resistance
At present, gold is in a corrective upward move within a broader bearish channel. The zone between $3,337–$3,365 will be key. A bearish rejection here would confirm downside continuation, with price potentially targeting $3,265–$3,220. However, a bullish breakout above $3,365 could invalidate the bearish view and suggest strength returning toward $3,392 and above.
Note
Please risk management in trading is a Key so use your money accordingly. If you like the idea then please like and boost. Thank you and Good Luck!

GOLD → Readiness to test the local bottomFX:XAUUSD is under pressure from the rising dollar and uncertainty, breaking through support levels, which opens up a corridor for the market to fall to 3255 - 3246
The price of gold is consolidating around $3300 after falling more than 1% amid expectations of the Fed minutes and news about tariffs.
Investors remain cautious: the dollar is supported by hopes for US trade deals, while the threat of new tariffs from August 1 is holding back gold's growth.
Weak inflation data in China did not support the metal, while expectations that the Fed will not rush to cut rates due to inflationary pressure from tariffs are also limiting interest in gold. Traders are waiting for the Fed minutes and new statements from Trump to determine the further direction.
Technically, the market looks weak (on D1, the price closed below the key level of 3300 on Tuesday) and there is a chance of a further decline.
Resistance levels: 3300, 3311
Support levels: 3295, 3255, 3246
Consolidation below 3295-3300 could trigger a further decline to 3255, from which the market could react with a correction.
Buying can be considered if gold reverses the short scenario, manages to strengthen to 3311, and consolidates above this level. At the moment, the price is in the selling zone...
Best regards, R. Linda!

GOLD remains stuck near 3365dGOLD remains stuck near 3365
Price faced a strong resistance zone in the bullish move near 3365
If we look at the left side of the chart, it shows that it could fall further. The structure zone near 3365 seems to be ver.y strong.
As long as the price has not risen above 3392 when Iran attacked the US, then it should not break this area under normal conditions.
There is a high chance that a larger bearish wave will resume, but again it is very risky.
Today the economic calendar is almost empty, so we could see gold take a break, as shown on the chart before falling to 3285 and 3250 first.
It will also be affected by the tariff topic this week, because the deadline is July 9th. Trump is expected to create another mess.
In my opinion, with the current data, ARI is rising, the chances of falling further.
You may find more details in the chart!
Thank you and Good Luck!
PS: Please support with a like or comment if you find this analysis useful for your trading day

9 Essential TIPS For Newbie Traders (Learn from my Mistakes!)
In the today's article, I will reveal trading secrets I wish I knew when I started trading.
1️⃣ Forget about becoming a pro quickly
Most of the traders believe, that you can learn how to trade easily and that it takes a very short period of time in order to master a profitable trading strategy.
The truth is, however, that trading is a long journey.
I spent more than 3 years, trying different strategies and looking for a profitable technique to trade. Once I found that, it took more than a year to polish a trading strategy and to learn how to apply that properly.
Be prepared to spend YEARS before you find a way to trade profitably.
2️⃣ Focus on One Strategy
While you are learning how to trade you will try different techniques, tools and strategies. And the thing is that newbies are trying multiple things simultaneously. The more strategies you try at once, the more setups you have on your chart. The more setups you have on your chart, the more complex and difficult is your trading.
Remember that in this game, your attention is the key.
You should meticulously study each and every trading setup.
For that reason, I highly recommend you to focus on one strategy, one approach, one technique. Test it, try it and look for a new one only when you realize that it doesn't work.
Here is the example how the same price chart can provide absolutely different trading opportunities depending on a trading strategy.
Price action pattern trader would recognize a lot of a patterns, while indicator based trader could spot absolutely different bullish and bearish signals.
Now, try to imagine how hard it would be to follow both strategies simultaneously.
3️⃣ Start with small capital that you can afford to lose
You will lose your first trading deposit and, probably, the second one and potentially the third one as well.
Losses are the only way to learn real trading. While you are on a demo account, you feel like a king, but once you start risking your savings, the perspective completely changes .
For that reason, make sure that you trade with an account that you can afford to lose. The fact of blowing such an account should be unpleasant, but that should not affect your daily life.
4️⃣ Use stop loss
I am doing trading coaching for more than 4 years.
What pisses me off is that the main reason of the substantial losses of my mentees is the absence of stop loss. Why can it be if naturally everyone: from your broker to Instagram trading gurus repeat that day after day.
Set stop loss, know in advance how much you risk per trade, and know the exact level on a price chart where you become wrong.
Imagine what could be your loss, if you shorted USDJPY and hold the trade while the market kept going against you.
5️⃣ Forget about getting rich quick
That is the iconic fallacy. I believe that around 90% of people who come in this game want to get rich quick , want easy money.
And no surprise, when I share a trading setup in my free telegram channel, and it loses I receive dozens of messages that I am a scammer.
People truly believe that professional trading implies 100% win rate and quick and easy money.
The truth is, traders, that trading is a very tough game. And with a good trading strategy, you have just a little statistical edge that will give you the profits that would slightly overcome your losses.
6️⃣ Train your eyes
Professional trading implies pattern recognition: it can be some technical indicators pattern, the price action or candlestick formation, etc.
Your main goal as a trader is to learn to identify these patterns.
Pattern recognition is a hard skill to acquire.
You should spend dozens of hours in front of the screen in order to train your eyes to identify certain patterns.
Here is how many patterns you would spot on GBPUSD chart, paying close attention.
7️⃣ Track and analyze your trades
Study all the trades that you take, especially the losing ones.
Look for mistakes, look for the reasons why a certain setup played out and why a certain one didn't. Journal your trades and make notes.
8️⃣ Don't use technical indicators
Newbies believe that technical indicators should do the work for them.
They are constantly looking for one or a bunch that will accurately show where the market will go.
However, I always say to my mentees that technical indicators make the chart messy and distract.
If you just started trading, focus on a naked chart, learn to analyze the market trend, key levels, classic price action patterns.
Learn to make accurate predictions relying on a price chart alone.
Only then add some technical indicators on your chart.
They won't do the work for you, but will help you to slightly increase the accuracy of a certain setup.
Above is the classic chart of a newbie trader.
A lot of indicators and a complete mess
The same chart would look much better without technical indicators.
9️⃣ Find a Mentor
There are hundreds of trading mentors on Instagram, YouTube, TradingView. Find the one with a trading style that you like.
Follow him, learn from his trading experience, listen to his trading recommendations.
11 years ago I found a guy on YouTube, his name was Jason.
I really liked his free teachings, and they were meaningful to me.
I decided to purchase his premium coaching program.
It was 200$ monthly - a huge amount of money for me at that time.
However, with his knowledge I saved a lot, I learned a lot of profitable techniques and tricks that helped me to become a professional forex trader.
Of course, this list could be much bigger.
The more I think about different subjects in trading, the more important tips come to my mind. However, I believe that the tips above are essential and I truly wish I knew all that before I started.
I hope that info will help you in your trading journey!
Good luck to you.
❤️Please, support my work with like, thank you!❤️
I am part of Trade Nation's Influencer program and receive a monthly fee for using their TradingView charts in my analysis.

Gold delivering excellent Scalp opportunitiesGold has tested #3,330.80 Resistance and got rejected many times as I firstly Bought Gold from #3,322.80 towards #3,330.80 Resistance zone in extension. Later on, I have added Selling order on #3,327.80 to the downside and closed it on #3,320.80. I have engaged Buying order on #3,318.80 Support once again and added more Buying orders on #3,321.80 / closed all before #3,327.80 and ultimately Sold again on #3,327.80 towards #3,318.80. Excellent Scalping opportunities throughout yesterday's session.
Technical analysis: Since the #3,318.80 breakout point was not compromised, the Price-action Naturally spiked to the #3,327.80 - #3,330.80 Resistance zone mentioned on the previous commentary. Based on the #5-session Higher High’s sequence, this zone is the new local High’s (very possible that Price-action is pricing a Top here, temporary or not) and as both the Hourly 4 chart and Daily chart are Neutral to a very great extent and does not look so good for Buyers (Gold is already critically Overbought within #3,340's, I should Naturally expect a correction within #1 - #3 session horizon. The Technical answer is the Hourly 1 chart’s Support near #3,327.80, which has been always touched after every Higher High’s rejection and holding as flood gate towards #3,322.80 and #3,318.80 wall of Support zones. Gold is kept Higher on pure Fundamental gradient and weak DX (on a parabolic downtrend) but this state has to end sooner or later and Gold should continue it’s Bearish trend and connect with the fair Technical Price around #3,300.80 mark or less. The turmoil with the Inflation in U.S. causing Investors turn to capital from riskier assets for protection (safe-havens in High demand such as Gold), thus causing Gold to gain value. Regardless, DX is the strongest correlation driving Gold at the moment. Fundamentally though Gold is Bullish and cannot overcome such patterns as it is overreacting to every DX and Bond Yields movements.
My position: I am currently Buying #3,332.80 Bottom (third Scalp this morning all closed on #3,335.80) and holding last one until #3,340.80 ideally and with that regardless what happens on U.S. opening, I will call it for the session and comfortably take early weekend break since I am Highly satisfied with my returns. Enjoy the Profits and have a great weekend!

Gold price surge, today will have a decline✏️ OANDA:XAUUSD The recovery of the D1 candle and the closing candle above 3313 means that the market's downtrend has almost been broken.
The reaction at the current trendline 3284 is still very strong. The price is strongly supported by the buyers, causing gold to return to trading in a wide range.
The 3328 zone will be important in the near future. If it does not break, there will be a decline to the Gap price zone this morning. Trading according to the top-bottom method is suitable for the current market.
Support: 3312-3295-3279
Resistance: 3328-3339-3349-3363
Sell trigger: rejection from 3328–3,340 resistance block
Target: 3295 Support zone, followed by 3279 lower zone
Leave your comments on the idea. I am happy to read your views.

Gold Setup for longs and shorts This video covers gold on the local range whereby I expect price to eventually complete the move to the downside and clear the equal lows from MAy and June as well as take care of the poor lows and fill Quart Pivots .
I talk also about the Tradingview session volume profile chart and how this feature can really be a simple yet powerful guide for taking scalp trades off of specific levels and I show a couple of examples of the respect PA has for hitting those daily POC .
I Welcome any questions you may have

Gold on the Move – Major Resistance Levels to Watch AheadThe current price action looks strong, and if the bullish momentum continues, we have three main target levels in mind.
The first target is $3,380. This is an important level we expect gold to reach soon if the trend continues upward.
If the price breaks above $3,380, the next target is $3,433. This level is likely to act as a strong resistance, meaning the price might slow down or pull back here. But if gold can push through it with strength, that’s a strong signal of continued upside.
After that, the third target is $3,495, which would mark a strong extension of the current bullish trend.
As long as gold stays above key support levels, we believe the bullish outlook remains valid, and these targets are possible in the coming days or weeks.

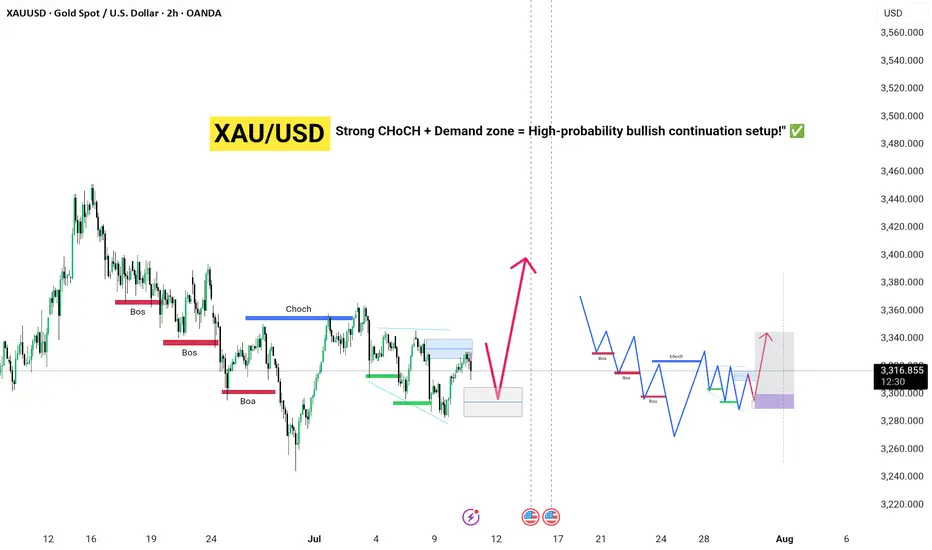
Bullish move , gold money Strong CHoCH + Demand zone = High-probability bullish continuation setup!" ✅
Key Highlights:
🔴 Multiple BOS confirm bearish trend continuation up to late June.
🔵 CHoCH on early July marks a potential bullish reversal zone.
📉 Price currently retracing into a demand zone (highlighted blue box) for potential long entries.
🔮 Expected bullish leg targeting the 3,350–3,400 zone before another possible correction.
🧠 Projected schematic aligns with Wyckoff accumulation + SMC concepts—anticipating further BOS and CHoCH as price unfolds.
📅 Watch for upcoming U.S. economic events that may influence volatility (shown with news icons).
📌 Bias: Bullish above demand zone | Invalidation: Clean break below demand and failure to hold above recent BOS.
Report - 10 jully, 2025Nvidia Becomes First $4 Trillion Company: AI Euphoria Drives Tech Boom
Key Highlights
Nvidia surged 40% since May, reaching a $4 trillion market cap, surpassing Apple and cementing its leadership in the AI chip space.
Drivers:
Thawing US-China trade tensions in early May boosted market sentiment.
Major sovereign AI infrastructure deals in Europe and Middle East.
Continuous demand from Big Tech (OpenAI, Microsoft, Google).
Nvidia’s projected 2025 revenue: ~$200bn (+55% YoY), net income ~$105bn, gross margin >70%.
Strategic Analysis
Nvidia’s success highlights the dominant role of AI infrastructure as a "new digital oil". It also underscores the increasing gap between top-tier AI firms and the rest of the semiconductor sector.
The "AI flywheel effect" is evident: Nvidia’s chips enable AI growth → Big Tech scales → Nvidia sells even more, creating a compounding loop.
Risks & Watchpoints
Export restrictions to China remain a ceiling on growth.
Rising competition from domestic Chinese players like DeepSeek.
Potential regulatory pushbacks or tech sovereignty initiatives in key markets.
Market Implications
Supports strong flows into US Tech ETFs and growth factor strategies.
Reinforces demand for high-performance computing infrastructure investments.
Spillover benefit to data center REITs, cloud infrastructure providers, and advanced memory suppliers.
European Airlines Face Worst Delays Ever
Key Highlights
Severe staff shortages, record post-COVID demand, and extreme weather events (wildfires) expected to create "worst ever" delays.
Critical air traffic control capacity constraints in major hubs: France, Germany, Greece, Spain.
Strikes further disrupt operations, impacting airlines financially (e.g., Air France-KLM).
Strategic Analysis
Operational risk for European carriers is increasing sharply.
Near-term margin pressure due to reroutings, cancellations, and compensations.
Possible reputational harm and longer-term adjustments to travel insurance premiums.
Market Implications
Negative near-term for airline stocks, potential hedge opportunity via short positions.
Supports defensive consumer stocks and travel insurers.
Potential boost to domestic tourism and alternative transport sectors (rail).
EU Removes UAE and Gibraltar From AML Grey List
Key Highlights
EU parliament voted to delist UAE and Gibraltar, facilitating smoother transactions and trade negotiations.
Move strategically driven by EU trade talks with Abu Dhabi.
Strategic Analysis
Improves transaction flows and reduces compliance costs for EU-based banks and corporates engaging with UAE.
Enhances UAE’s reputation as a credible financial hub, possibly attracting more institutional capital flows.
Market Implications
Positive for European banks with Middle East exposure.
Supports UAE sovereign and quasi-sovereign bond demand.
Brain Aging Identified as Top Predictor of Longevity
Key Highlights
Stanford research: brain aging is the single most important determinant of lifespan, more than other organ systems.
Opens new frontiers for diagnostics and personalized medicine.
Strategic Analysis
Potential shift in longevity biotech investments toward neuro-focused therapies and diagnostics.
Emerging new segment in consumer health testing (bio-age clocks).
Market Implications
Positive for neurodegenerative research-focused biotech (e.g., companies working on Alzheimer’s, brain rejuvenation).
Creates thematic investment opportunities in longevity ETFs and specialized VC.
US Space Safety System Faces Funding Cuts
Key Highlights
Proposed 85% funding cut to Office of Space Commerce’s collision-avoidance system (Tracss).
Industry concerns: increased collision risk, higher operational costs, and potential insurance implications.
Strategic Analysis
Rising risks in orbital operations may accelerate private solutions and partnerships.
Could indirectly benefit specialized private space tracking firms and insurance providers.
Market Implications
Near-term negative sentiment for US-based satellite operators.
Supports consolidation or premium valuation of private orbital tracking players.
FSB Proposes Leveraged Limits for Hedge Funds
Key Highlights
New proposals to limit non-bank leverage and improve transparency.
Aims to mitigate systemic risk amplified by strategies like Treasury basis trades.
Strategic Analysis
Could compress returns in highly leveraged strategies, particularly macro and relative-value hedge funds.
May shift flows toward lower-leverage, higher-transparency structures.
Market Implications
Increased scrutiny likely benefits regulated fixed-income and public credit markets.
Hedge fund sector might see short-term outflows or strategy shifts.
Trump’s “Big Beautiful Bill”: Winners & Losers
Winners
Private equity & fossil fuels (carried interest loophole preserved, tax breaks).
Coal & nuclear (additional incentives).
Defense contractors (additional $150bn budget).
Certain retail segments (tariff exemptions phased out benefiting domestic).
Losers
Renewables (wind, solar incentives cut).
AI firms (lack of national regulation moratorium).
EV sector (credits scrapped).
Top universities (endowment taxes).
Strategic Analysis
Supports US traditional energy transition back toward fossil fuels.
Encourages private equity capital inflows.
Defensive healthcare positioning validated, but long-term funding risks persist.
Market Implications
Rotation into energy and defense stocks.
Potential pullback in renewable energy and select tech.
Beneficial for defense ETFs, private equity-exposed indices.
Chinese Bank Stocks Surge in Hong Kong
Key Highlights
Driven by strong dividend yields (4.6%–5.7%) vs 1.65% in local debt.
Backed by Chinese insurance giants like Ping An.
Strategic Analysis
Shows investor pivot to "quasi-fixed income" attributes of big banks.
Reflects stabilizing credit conditions and support from state capital injections.
Market Implications
Supports bank-heavy indices like Hang Seng Financials.
Reinforces China yield-hunting narrative.
Copper Market Shaken by US Tariff Threat
Key Highlights
US threatens 50% tariff on global copper imports.
Potential reduction in global copper demand, investment hesitation.
Strategic Analysis
Long-term supply chain risk for US green energy and electrification.
May lead to regional trade distortions, price volatility.
Market Implications
Bearish pressure on global copper prices despite short-term US price premiums.
Chilean and Zambian miners may face margin squeezes.
Temasek Turns Bearish on Europe
Key Highlights
Shifts focus due to US tariff uncertainty and weaker European domestic outlook.
Increased Middle East and US exposure.
Strategic Analysis
Illustrates global capital reallocation away from EU toward more "policy-stable" regions.
Encourages European corporates to further diversify geographic revenue streams.
Market Implications
Could slow inflows into European equities and private markets.
Supports Middle East infrastructure and US tech/consumer exposure.
Markets Recap
Global equities at record highs; Nvidia leads tech euphoria.
US Dollar slightly higher; Euro weaker.
Government bonds strong, yields decline on flight-to-quality and rate cut hopes.
Copper volatile; oil and gold remain firm.

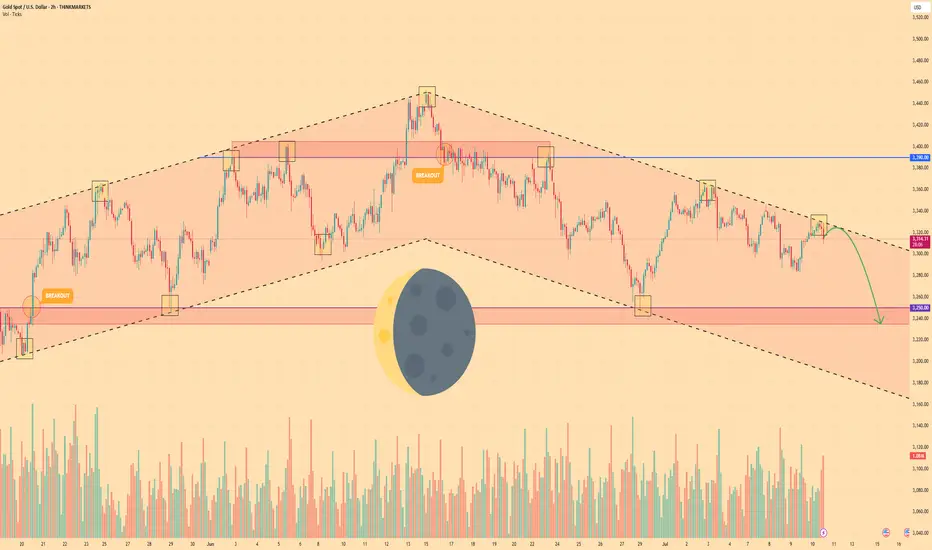
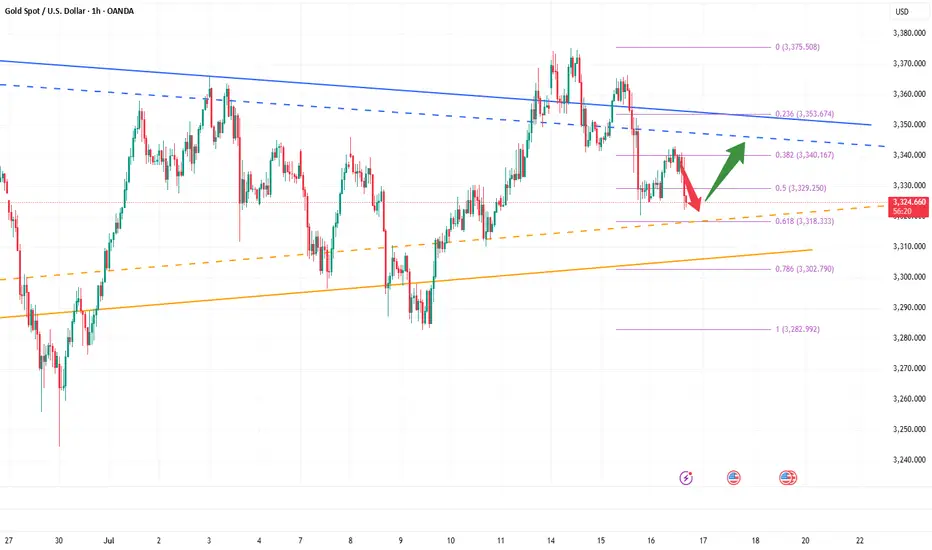
GOLD - Price can bounce down from resistance line of channelHi guys, this is my overview for XAUUSD, feel free to check it and write your feedback in comments👊
Gold broke out of its long-term rising channel and hit $3390 resistance level before momentum definitively stalled.
That failure marked a shift in control, as sellers forced price into a falling channel, establishing lower highs and lower lows.
Price fell to support level, after whcih it turned around and bounced up to resistance line of falling channel.
Now, Gold tests the upper boundary of the falling channel near $3318, where each bounce has been capped by declining volume.
Key support lies in the $3250 - $3235 area, aligned with multiple prior demand tests and the former rising-channel floor.
I expect Gold to reverse from the channel resistance and slide toward $3235, decisively breaking below the $3250 level.
If this post is useful to you, you can support me with like/boost and advice in comments❤️
Disclaimer: As part of ThinkMarkets’ Influencer Program, I am sponsored to share and publish their charts in my analysis.
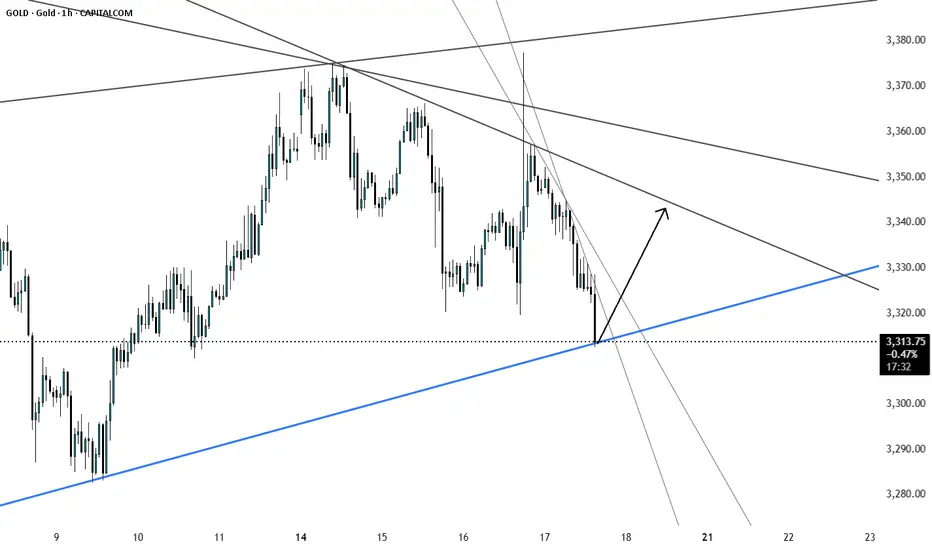
GOLD (XAUUSD): Important Decision Ahead
As I predicted, Gold went up from a trend line yesterday.
The price is now testing another trend line - a falling resistance
of a bullish flag pattern.
The next reliable bullish signal that you can look for is its
bullish breakout and a daily candle close above that.
A bullish move is going to follow then.
❤️Please, support my work with like, thank you!❤️
I am part of Trade Nation's Influencer program and receive a monthly fee for using their TradingView charts in my analysis.

GOLD at support Gold price has reached the support level from where price has pulled up several time and price will soon may go up. Liq grab. SL3300.
Gold CPI shocks and fallsThe hourly chart shows that the gold price fluctuated and consolidated at the bottom after a continuous correction, continuing the rebound trend. The key pressure level is the top and bottom conversion position. The current gold rebound is only a secondary confirmation of the top structure at the 30-minute level. After reaching 3365, the short-term has shown signs of pressure. In the volatile market, if the price begins to consolidate horizontally, it may indicate the end of this round of volatile upward trend, and it will enter a downward phase later. Considering the market sensitivity before the release of CPI data, it is recommended to focus on the volatile decline trend. After today's rebound, it is necessary to focus on the 3363-3368 area as a short-selling range, and the long and short defense position is set at yesterday's intraday high of 3375. In terms of operation, it is recommended to maintain the idea of rebounding and shorting, and pay attention to the 3340-3335 range for support below.
Operation strategy:
1. It is recommended to short gold near the rebound of 3363-3368, with a stop loss at 3375 and a target of 3350-3340.

Gold begins bullish recoveryGold posted a slight gain during Monday's Asian session, driven by renewed safe-haven demand amid escalating trade tensions between the United States and several key economies, as well as rising geopolitical uncertainty surrounding Russia and Ukraine.
The initial uptick in gold was supported by the announcement of 30% tariffs by Donald Trump on Mexico and the European Union, in addition to harsher levies on Japan, South Korea, and Brazil. The prospect of a renewed wave of protectionism has raised concerns over global economic stability, boosting gold's appeal as a safe-haven asset. Added to this is geopolitical tension following reports that Trump is planning to send offensive weapons to Ukraine, potentially escalating the conflict with Russia. These factors have reinforced risk-off sentiment in the markets.
However, the strength of the US dollar (DXY +0.1%) and anticipation ahead of the US CPI data, due Tuesday, are capping gold’s upside. Higher-than-expected inflation could reinforce expectations of a tighter monetary policy from the Federal Reserve, which would weigh on precious metals.
After reaching an intraday high of $3,361.42 per ounce, the Asian market closed lower, leaving gold at $3,356.66 per ounce, a level at which it has since consolidated ahead of the European open. This behavior reflects a technical pause in the initial bullish momentum, with the current point of control aligning with that same price zone, suggesting a temporary neutralization of buying pressure. The RSI at 54% confirms a lack of strength, while the MACD indicates a potential upward directional shift with a signal line crossover and a modestly green histogram to start the week. Moving average crossovers show the 50 and 100 SMAs supporting the bullish push that began last Wednesday. Gold’s next decisive move may depend on upcoming US inflation data and developments in geopolitical tensions.
Silver, meanwhile, stood out with a sharp 1.4% surge to $39.493 per ounce, its highest level since 2011, while platinum and copper delivered mixed performances.
This week, gold prices could be driven by the confirmation of elevated US inflation data, which would strengthen the metal's role as a hedge against purchasing power loss, especially if doubts persist regarding the Fed’s policy stance. Added to this are rising geopolitical tensions due to Trump’s potential delivery of offensive weapons to Ukraine, further protectionist measures that could worsen the global trade war, and increased risk aversion should equity markets react negatively. In this context, gold is positioned as one of the main beneficiaries amid growing economic and political uncertainty.

X1: GOLD/XAUUSD Long Trades Risking 1% to make 1.68%OANDA:XAUUSD / TVC:GOLD Long Trade, with my back testing of this strategy, it hits multiple possible take profits, manage your position accordingly.
Risking 1% to make 1.68%
Note: Manage your risk yourself, its risky trade, see how much your can risk yourself on this trade.
Use proper risk management
Looks like good trade.
Lets monitor.
Use proper risk management.
Disclaimer: only idea, not advice

Today’s main strategy: bulls take the lead, followed by bears!Yesterday, gold maintained a range of fluctuations. The game between bulls and bears was fierce but failed to break the current structure. The overall trend is not clear for the time being. From a fundamental perspective, risk aversion still dominates market expectations, which makes the gold trend lack a directional breakthrough. However, we need to be vigilant that the main funds may force the gold price to fall through extreme suppression in the future. From the 4-hour cycle, gold has been under pressure near the upper track of 3377 and has fallen continuously. It has fallen below the middle track support and touched the lower track. The current price is temporarily supported near the lower track, but the overall situation is still in a wide range of fluctuations. The trend has not yet formed. The short-term strength of the US dollar also suppresses the gold rebound. The current bulls and bears are anxious, and the key support and resistance have not been effectively broken. Currently, pay attention to the effectiveness of the support in the 3325-3320 area. If it pulls back to this area, you can consider a short-term long layout, and the target is the 3340-3350 range above. If it rebounds to this area, you can choose to stop profit and go short at the right time, and the target is the lower track area. If the downward momentum is strong, it may fall below yesterday's low to form a continuous decline.

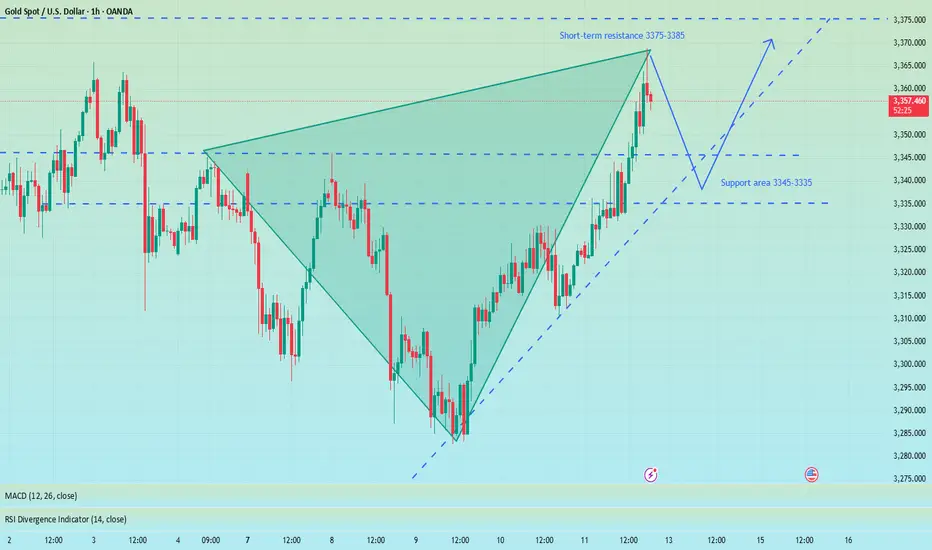
Precisely look at 3365 and pay attention to the pullback chanceAt present, gold has risen as expected and reached the highest level near 3368. The upper 3375-3385 constitutes a short-term resistance level. At present, the bullish momentum is still relatively strong, and the short-term support structure below has been formed. I still maintain the views of the previous transaction and wait for a second trading opportunity when it pulls back below. Although the 1H chart shows that the current trend remains strong and the retracement is small, it is necessary to remain cautious - even if the market is strong, it is not recommended to chase long easily, and the risk of a deep correction in the gold price must be guarded against. First, pay attention to the support area of 3345-3335 below. If it falls back to this level, you can consider going long with a light position.
OANDA:XAUUSD
Gold Rejected Post-CPI – Bearish Momentum Building Below $3,365Gold is currently trading near $3,338, continuing to show signs of rejection after testing the key $3,365–$3,392 resistance zone. The market has reacted to the July 15 U.S. CPI release, and despite initial volatility, gold failed to break above its major diagonal trendline, forming a lower high, a strong technical sign of weakening bullish momentum.
If price breaks below $3,330, it could trigger a wave of selling pressure down to $3,303 and $3,248 in the coming days. Traders should monitor price behavior around these zones for short-term entry opportunities.
📌 Technical Breakdown
Resistance Zone:
- $3,365–$3,392 remains the critical ceiling where gold got rejected for the third time in recent sessions.
- This zone aligns with the top of the descending wedge, long-term black trendline.
Bearish Structure Forming:
- After multiple attempts, gold could not sustain above the resistance.
- A series of lower highs and a weakening bullish push suggest a bearish continuation is likely.
Support Levels to Watch:
- Immediate: $3,337
- Mid: $3,320
- Strong: $3,303 (0.382 Fib) and $3,293
- Final Target: $3,248 → $3,220 → $3,193
🔺 Bullish Invalidation Scenario
If gold manages a clean breakout and close above $3,392, this bearish setup will be invalidated. In that case, upside targets would include:
- $3,412
- $3,434
- $3,490 (macro trendline)
But at the moment, that seems unlikely unless driven by unexpected fundamentals.
Note
Please risk management in trading is a Key so use your money accordingly. If you like the idea then please like and boost. Thank you and Good Luck!
3325–3315: Potential Bullish Reversal ZoneGold maintained a volatile trend today, but the highest intraday price only touched 3343. Overall, gold is still weak, but the bulls have not completely given up, and there is still a certain amount of energy, which limits the retracement space of gold. The current short-term support is in the 3325-3315 area. If gold cannot fall below this area in such a weak situation, the market may reach a consensus that 3325-3315 is the support area, thereby attracting a large amount of buying funds to flow into the gold market, thereby boosting gold to regain the bullish trend again and is expected to hit the 3350-3360 area.
So for short-term trading, I currently prefer to start long gold with the 3325-3315 area as support, first expecting gold to recover some of its lost ground and return to the 3350-3360 area!
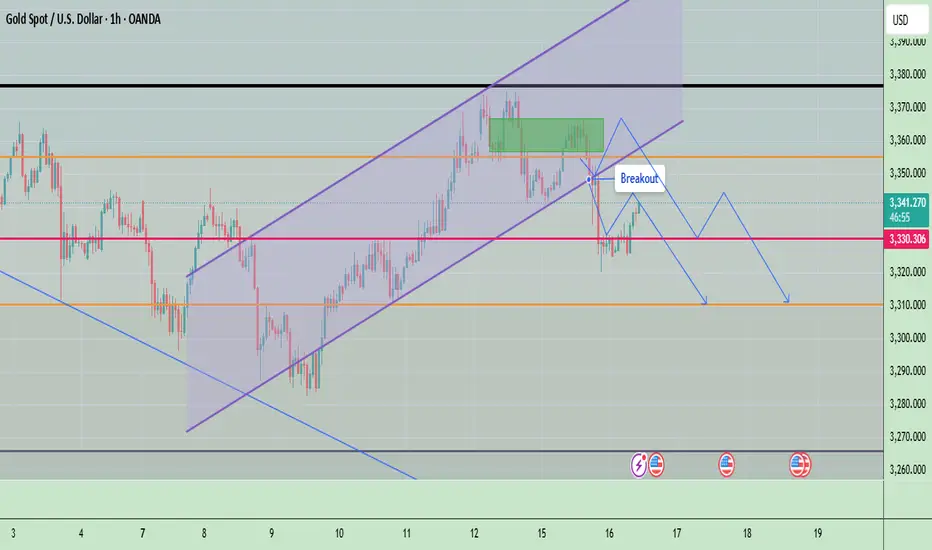
Gold Faces Strong Rejection Below $3,365 – Bearish Wave Ahead?Gold is currently trading around $3,359, showing signs of exhaustion after climbing from the $3,248 low. The chart illustrates a textbook scenario of channel rejection after testing the upper boundary of the descending wedge and failing to break above the $3,365–$3,392 resistance zone. Price is now hovering just below the diagonal black trendline, indicating a potential lower high formation and setting up for another bearish wave.
📌 Key Technical Highlights
Resistance Zone: $3,365–$3,392
This area marks the confluence of the black long-term trendline, the top of the descending purple channel, and the previous high at $3,392.
Price attempted a "Possible Retest" as annotated on the chart and is now starting to pull back—showing signs of bearish rejection.
Bearish Scenario (Blue Arrows):
Multiple downward arrows show likely bearish paths if the current resistance holds.
Key short-term targets:
$3,337, $3,320, $3,303, Strong support at $3,293–$3,248
Further downside may test extension levels toward $3,220–$3,200 by early August if momentum builds.
⚠️ Bearish Confirmation Criteria
Failure to close above $3,365 (black trendline)
Breakdown below $3,337 followed by $3,320
Strong selling pressure supported by fundamentals (e.g. USD strength, Fed hawkish stance)
✅ Invalidation / Bullish Outlook
A decisive breakout and close above $3,392.73 would invalidate the bearish structure.
In that case, targets would shift toward:
$3,412, $3,434, $3,490 (long-term trendline intersection)
However, today's U.S. CPI (Consumer Price Index) release adds a layer of volatility and potential trend disruption, making this a high-risk trading day.
📊 CPI News Impact – What to Watch
High CPI (Stronger than forecast):
- Increases expectations of further Fed tightening → strengthens USD → bearish for gold
- Likely scenario: sharp drop toward $3,337 → $3,320 → $3,293
Low CPI (Weaker than forecast):
- Signals disinflation → weakens USD → bullish for gold
- Possible breakout above $3,365 → retest of $3,392 → if broken, target $3,412 and $3,434
Neutral or as expected CPI:
- Likely leads to whipsaw — fakeout on both sides
- Caution advised — wait for candle close confirmations post-news
Note
Please risk management in trading is a Key so use your money accordingly. If you like the idea then please like and boost. Thank you and Good Luck!

Gold elliot wave. a new one at the making.Could this be the case for the next weeK? if this is the case then its bullish and will break above 400.
