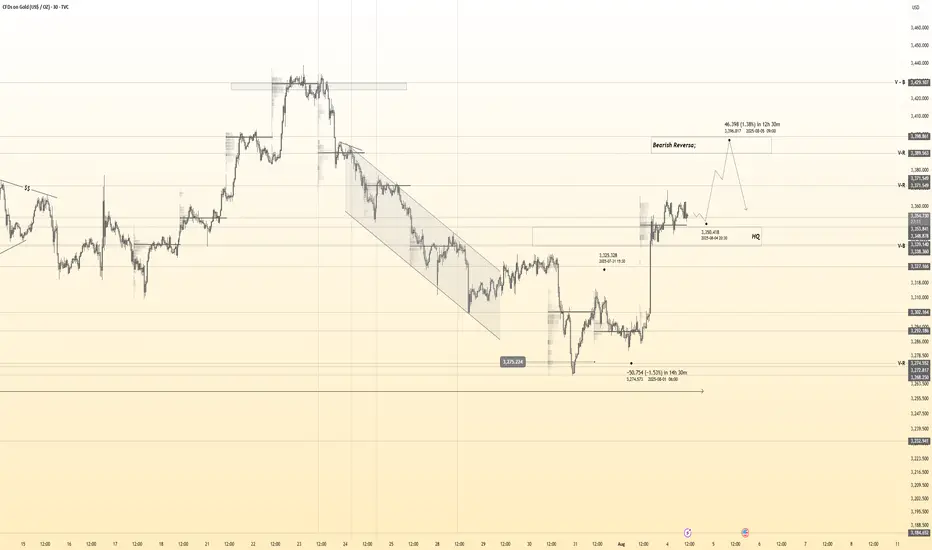
GOLD → Consolidation after the rally...FX:XAUUSD is not falling back after a strong rally, but is consolidating against resistance at 3362.8. Continued high demand could allow the market to strengthen...
The price of gold halted its two-day rally, trading around $3362.8 on Monday morning after weak US employment data. This heightened concerns about the US economy and increased the likelihood of a Fed rate cut in September to 80%.
Additional pressure on the dollar came from the dismissal of BLS chief Erika McAntfer, which raised suspicions of statistics manipulation. Market attention is also focused on US-Canada trade talks, which could affect investor sentiment. Gold is consolidating for now, but its further growth will depend on the dynamics of the dollar and macroeconomic data.
Resistance levels: 3362.8, 3383, 3433
Support levels: 3345, 3334
As the market has now entered a consolidation phase, MM may form a retest of support before a possible rise in order to accumulate liquidity. However, a breakout of resistance at 3362.8 could trigger further growth.
Best regards, Linda!
XAUUSDG trade ideas

Gold Crashing After Hot U.S. Data – More Pain Ahead?Minutes ago, important indices were released from the US , which catalyzed the continuation of gold's downward trend .
Key U.S. Economic Data Just Dropped!
ADP Employment: 104K
GDP q/q: 3.0%
Both came in stronger than expected , signaling that the U.S. economy is holding up better than many thought!
Strong job growth
Solid economic expansion
The result? A stronger U.S. dollar ( TVC:DXY ) and potential downward pressure on Gold .
All eyes are now on FOMC meeting .
Will the Fed still hint at future rate cuts despite the solid data? Or is the easing cycle officially on hold? What is your idea!?
----------------------
Gold ( OANDA:XAUUSD ) has already managed to break the Support zone($3,350-$3,326) , Monthly Pivot Point , 50_EMA(Daily) , Support lines , and the lower line of the ascending channel . Also, Gold trading below $3,333 plays an important role for me, which can increase the possibility of a continuation of the downtrend .
I expect Gold to drop to at least the Potential Reversal Zone(PRZ) before the FOMO meeting and if the Support zone($3,307-$3,272) is broken, we can expect further declines to $3,253(Second Target) .
--------------------------------
Information we need to know:
How should the Federal Funds Rate be announced to cause a deeper drop in Gold ?
The Fed needs to take a hawkish stance — meaning:
They keep rates unchanged, but make it clear they intend to keep them elevated for a prolonged period.
They emphasize strong economic data like today's solid ADP and GDP numbers .
They express concern that inflationary risks remain, and cutting rates isn’t on the table anytime soon.
In this case, markets get disappointed, rate cut hopes fade, and gold drops as real yields( TVC:US10Y ) rise and the U.S. dollar strengthens.
--------------------------------
Note: Stop Loss (SL) = $3,340
Gold Analyze (XAUUSD), 4-hour time frame.
Be sure to follow the updated ideas.
Do not forget to put a Stop loss for your positions (For every position you want to open).
Please follow your strategy; this is just my idea, and I will gladly see your ideas in this post.
Please do not forget the ✅ ' like ' ✅ button 🙏😊 & Share it with your friends; thanks, and Trade safe.

XAU/USD Bullish Setup Building MomentumGold has reclaimed bullish momentum after a strong bounce from the recent demand zone around 3319–3322. The chart shows a clear Change of Character (CHOCH) and subsequent Break of Structure (BOS), suggesting buyers are regaining control. Price is now trading above the Ichimoku cloud, further confirming bullish pressure. The upward arrow highlights the potential path toward the next key resistance area near 3380–3400. As long as price sustains above the previous structural break and the cloud base, continuation toward the upside remains likely. Market structure favours buying opportunities on dips, with bulls targeting a higher move in the short term.
Entry Buy: 3334
Target Point: 3404
If you found this analysis helpful, don’t forget to drop a like and comment . Your support keeps quality ideas flowing—let’s grow and win together! 💪

Gold 30Min Engaged ( Bullish & Bearish Entry Detected )Time Frame: 30-Minute Warfare
Entry Protocol: Only after volume-verified breakout
🩸Bullish From now Price - 3354
🩸Bearish Reversal : 3400
➗ Hanzo Protocol: Volume-Tiered Entry Authority
➕ Zone Activated: Dynamic market pressure detected.
The level isn’t just price — it’s a memory of where they moved size.
Volume is rising beneath the surface — not noise, but preparation.
🔥 Tactical Note:
We wait for the energy signature — when volume betrays intention.
The trap gets set. The weak follow. We execute.
#XAUUSD: Gold is likely to create a record highGold will be bullish since the US and Russia tension rises, creating uncertainty within the global investors. As of now gold rejected nicely due to negative NFP data affected the US Dollar. We have now two strong fundamentals views that is supporting our view. Please use accurate risk management while trading gold.
Good luck and trade safe. Please like and share for more
Team Setupsfx

XAUUSDHello Traders! 👋
What are your thoughts on GOLD?
Gold saw a strong rally on Friday following the U.S. Non-Farm Payrolls (NFP) report and is now trading near a key resistance zone.
At this resistance, a short-term pullback is likely as traders lock in profits.
We expect the correction to be contained within key support levels, and if price holds in that zone, the uptrend is likely to resume, targeting new highs.
Will gold resume its rally after the correction? Share your view below! 👇
Don’t forget to like and share your thoughts in the comments! ❤️

Gold Showing Signs of Reversal After Hitting Key ResistanceHello Guys.
Gold has reached a major resistance zone around 3439–3425, which has already acted as a strong ceiling in the past. The price tapped into this area again, forming a clear divergence, and failed to break higher.
Here’s what stands out:
Divergence signals a weakening bullish momentum at the top.
The price rejected the resistance and is now breaking structure to the downside.
A minor pullback may occur before continuation, as shown in the projected moves.
First target: 3259.792
Second target (if support breaks): 3136.869, a deeper zone for potential bounce or further drop.
This setup hints at a bearish trend building up. Stay cautious on longs unless the price structure changes again.

GOLD (XAUUSD): Massive BreakoutGOLD has fallen significantly and closed below an important support level.
The broken structure has now become a strong resistance.
I anticipate further downward movement, with the next support level at 3262.

GOLD ROUTE MAP UPDATEHey Everyone,
Great start to the week with our chart idea playing out, as analysed.
We got our Bullish target 3370 hit and now waiting for ema5 lock to confirm gap to 3392. Failure to lock will see lower Goldturns tested for suport and bounce, inline with our plans to buy dips.
We will keep the above in mind when taking buys from dips. Our updated levels and weighted levels will allow us to track the movement down and then catch bounces up.
We will continue to buy dips using our support levels taking 20 to 40 pips. As stated before each of our level structures give 20 to 40 pip bounces, which is enough for a nice entry and exit. If you back test the levels we shared every week for the past 24 months, you can see how effectively they were used to trade with or against short/mid term swings and trends.
The swing range give bigger bounces then our weighted levels that's the difference between weighted levels and swing ranges.
BULLISH TARGET
3370 - DONE
EMA5 CROSS AND LOCK ABOVE 3370 WILL OPEN THE FOLLOWING BULLISH TARGETS
3392
EMA5 CROSS AND LOCK ABOVE 3392 WILL OPEN THE FOLLOWING BULLISH TARGET
3416
EMA5 CROSS AND LOCK ABOVE 3416 WILL OPEN THE FOLLOWING BULLISH TARGET
3429
EMA5 CROSS AND LOCK ABOVE 3429 WILL OPEN THE FOLLOWING BULLISH TARGET
3439
BEARISH TARGETS
3348
EMA5 CROSS AND LOCK BELOW 3348 WILL OPEN THE FOLLOWING BEARISH TARGET
3328
EMA5 CROSS AND LOCK BELOW 3328 WILL OPEN THE FOLLOWING BEARISH TARGET
3313
EMA5 CROSS AND LOCK BELOW 3313 WILL OPEN THE SWING RANGE
3296
3281
As always, we will keep you all updated with regular updates throughout the week and how we manage the active ideas and setups. Thank you all for your likes, comments and follows, we really appreciate it!
Mr Gold
GoldViewFX

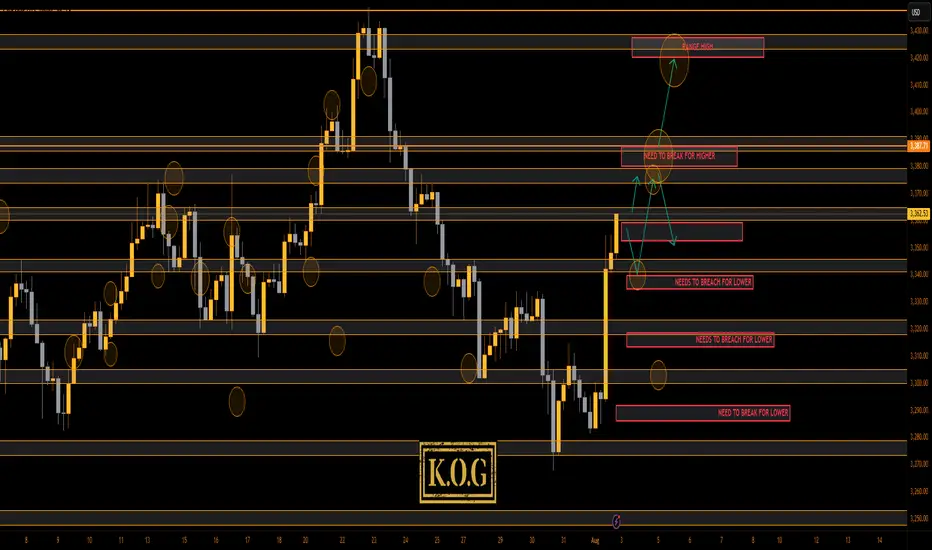
THE KOG REPORT - NFP UPDATE 1H 1H:
This is the chart we used last week for the FOMC and NFP KOG Reports. From the chart we can see the low was captured for FOMC and NFP didn’t give us an undercut low. We’ve kept the potential target box from the Report and for now we’ll stick with it. Red box defence is active below at the 3340-5 level and the ideal target stands above in the oval as long as we remain above the 3340 bias level.
KOG’s bias for the week:
Bullish above 3340 with targets above 3370, 3373, 3379 and above that 3384
Bearish on break of 3340 with targets below 3330, 3320 and below that 3310
RED BOXES:
Break above 3365 for 3372, 3375, 3379, 3384 and 3390 in extension of the move
Break below 3350 for 3346, 3340, 3335 and 3330 in extension of the move
Please do support us by hitting the like button, leaving a comment, and giving us a follow. We’ve been doing this for a long time now providing traders with in-depth free analysis on Gold, so your likes and comments are very much appreciated.
As always, trade safe.
KOG

GOLD (XAUUSD): Important BreakoutsI've identified two significant breakouts on 📉GOLD.
The price violated a crucial intraday horizontal support and a major rising trend line.
These broken levels now form a contracting supply zone, suggesting that the price could continue to decline.
Target levels are 3314 and 3289.

THE KOG REPORT THE KOG REPORT:
Due to there being no KOG Report last week so we won’t reference it, however, we did post the FOMC and NFP reports for the wider community to help them navigate the moves, which as you can see from the pinned ideas worked well.
So, what can we expect in the week ahead?
After the move we observed for NFP on Friday we would like to see some retracement in the sessions ahead. Looking at the 4H chart we have a reversal in play, but we still have no break out of this range! We’re simply playing the highs and the lows while price chops and whipsaws within it, which could be causing some new traders confusion and frustration.
We have a support level below 3350 and below that 3340 which will be the bias level for this week as bullish above. We then have the intra-day resistance level 3365-70 while there is an extension of the move into the 3385 level. Ideally, what we want to see here is support levels hold or a quick continuation on the open into the higher red box levels and the a potential for a RIP. That RIP however is most likely going to be a scalp unless we come down and break below that 3345-50 level.
We want to see how this reacts at these higher levels and if we do get a break of the boxes, otherwise, there is a chance we see another curveball like we suggested a couple of weeks ago, and we correct this whole move back downside with the first hurdle being 3340-35 on the flip.
We’re going to keep it simple here for now and usual we’ll update during the week once we have a clearer understanding of whether this wants to attempt a new all time high or not.
Please note, our liquidity indicator is suggesting a little higher but a pullback is on the way.
We’ll keep you updated.
KOG’s bias for the week:
Bullish above 3340 with targets above 3370, 3373, 3379 and above that 3384
Bearish on break of 3340 with targets below 3330, 3320 and below that 3310
RED BOXES:
Break above 3365 for 3372, 3375, 3379, 3384 and 3390 in extension of the move
Break below 3350 for 3346, 3340, 3335 and 3330 in extension of the move
Please do support us by hitting the like button, leaving a comment, and giving us a follow. We’ve been doing this for a long time now providing traders with in-depth free analysis on Gold, so your likes and comments are very much appreciated.
As always, trade safe.
KOG
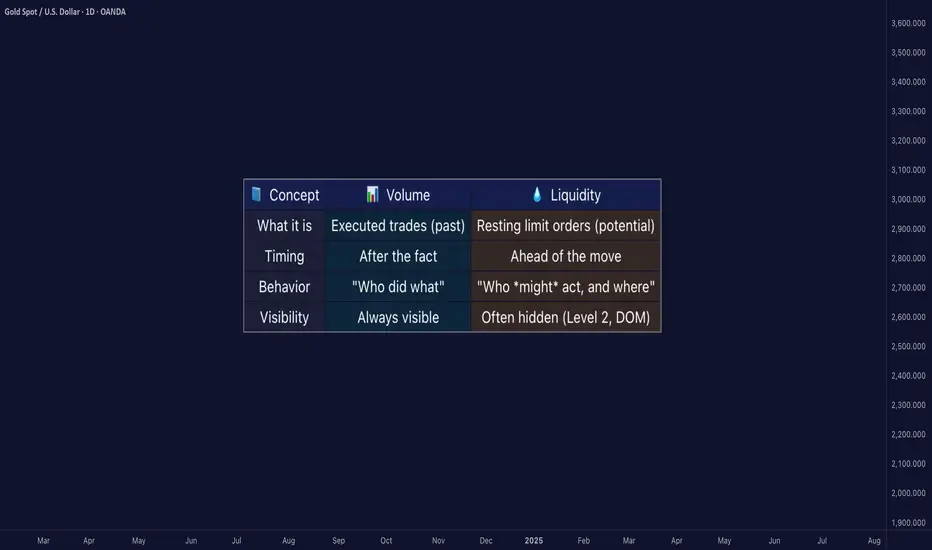
Liquidity ≠ Volume: The Truth Most Traders Never Learn█ Liquidity ≠ Volume: The Truth Most Traders Never Learn
Most traders obsess over volume bars, but volume is the footprint, not the path forward.
If you’ve ever seen price explode with no volume or fail despite strong volume, you’ve witnessed liquidity in action.
█ Here’s what you need to know
⚪ Volume Is Reactive — Liquidity Is Predictive
Volume tells you what happened.
Liquidity tells you what can happen.
█ Scenario 1: Price Jumps on Low Volume
❝ A price can jump on low volume if no liquidity exists above.❞
⚪ What’s happening?
The order book is thin above the current price (i.e., few or no sellers).
Even a small market buy order clears out available asks and pushes price up multiple levels.
Volume is low, but the impact is high because there’s no resistance.
⚪ Implication:
This is called a liquidity vacuum.
It can happen before news, during rebalancing, before session openings, on illiquid instruments, or during off-hours.
Traders often overestimate the strength of the move because they only see the candle, not the absence of offers behind it.
█ Scenario 2: Move Fails on High Volume
❝ A move can fail on high volume if it runs into a wall of offers or bids.❞
⚪ What’s happening?
There’s a strong surge of aggressive buying or selling (high volume).
But the order book has deep liquidity at that level — large resting limit orders.
The aggressive traders can’t chew through the liquidity wall, and price stalls or reverses.
⚪ Implication:
This is called liquidity absorption.
Market makers or institutions may intentionally absorb flow to stop a breakout.
Many retail traders mistake this for “fakeouts,” but it’s really liquidity defending a level.
⚪ What the Research Says
Cont, Stoikov, Talreja (2014): Price responds more to order book imbalance than trade volume.
Bouchaud et al. (2009): Liquidity gaps, not trade size, are what truly move markets.
Hasbrouck (1991): Trades only impact price if they consume liquidity.
Institutions don’t chase candles — they model depth, imbalance, and liquidity resilience.
⚪ Where the Alpha Lives
Liquidity tells you where the market is weak, strong, or vulnerable — before price moves.
Fakeouts happen in thin books.
Reversals occur at hidden walls of liquidity.
Breakouts sustain when liquidity follows the price, not pulls away.
If you understand this, you can:
Enter before volume shows up
Avoid chasing dead breakouts
Fade failed moves into empty space
█ Final Truth
Volume is the echo. Liquidity is the terrain. Alpha is in reading the terrain. You want to study the structure, because price moves toward weakness and away from strength. Learn to see where liquidity is, or where it’s missing, and you’ll see trading with new eyes.
-----------------
Disclaimer
The content provided in my scripts, indicators, ideas, algorithms, and systems is for educational and informational purposes only. It does not constitute financial advice, investment recommendations, or a solicitation to buy or sell any financial instruments. I will not accept liability for any loss or damage, including without limitation any loss of profit, which may arise directly or indirectly from the use of or reliance on such information.
All investments involve risk, and the past performance of a security, industry, sector, market, financial product, trading strategy, backtest, or individual's trading does not guarantee future results or returns. Investors are fully responsible for any investment decisions they make. Such decisions should be based solely on an evaluation of their financial circumstances, investment objectives, risk tolerance, and liquidity needs.
The correction is quite surprise. What direction for GOLD price?✏️Quite surprised with the adjustment of gold at the end of the previous trading week. The rising price channel is still holding around the lower border of the price channel around 3316. A liquidity sweep and candle wick removal in this area is considered a good buying opportunity.
If h1 closes below this border, limit trading BUY signals until the bottom support of 3286. When the price can close the candle below 3316, gold will trade in a wide range and there is no main trend dominating the market.
📉 Key Levels
Support: 3316-3286
Resistance: 3372-3400-3418
Buy trigger: Reject and Trading above 3316
BUY DCA Break 3372
Target: 3400
SELL Trigger: Break bellow and Retest 3416
Leave your comments on the idea. I am happy to read your views.
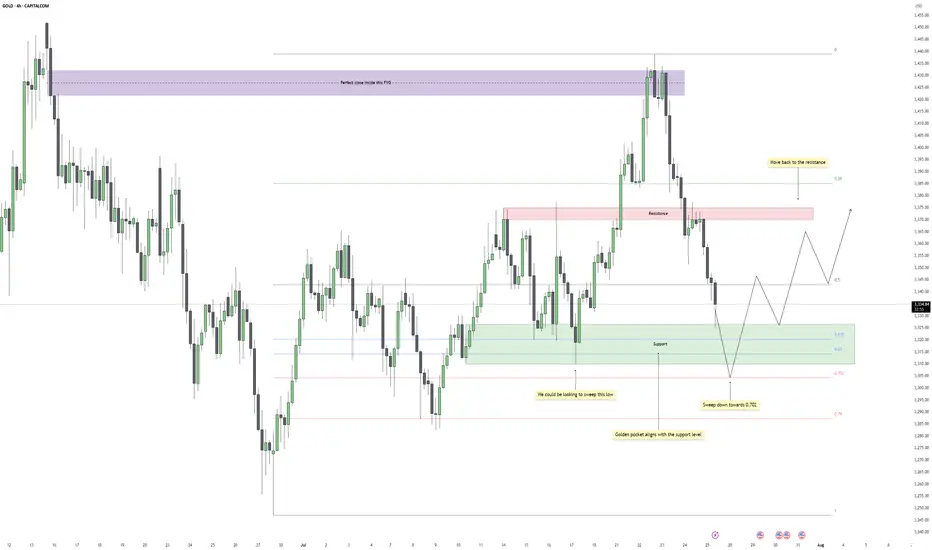
Gold - Eyes on the Final Flush Before ReclaimGold recently dropped after reacting perfectly inside a higher time frame fair value gap. That zone acted as clean supply, offering a precise close within the imbalance and initiating a strong bearish leg. The move confirmed that buyers were overwhelmed at that level, and price began its descent back into a broader consolidation range.
Support Cluster and Fibonacci Alignment
The current zone being tested holds significant weight. Price has tapped into a clear support region, one that has already caused multiple strong bounces in recent sessions. What adds further confluence is the alignment of this zone with the golden pocket region of the entire upward leg. This kind of technical overlap increases the chances of responsive buying once liquidity is cleared below.
Liquidity Target and Inducement Setup
Just below current price action, there's a clean low that hasn't been taken out yet. This low acts as the inducement, sitting right above deeper Fibonacci levels, especially the 0.702. If price continues lower in the short term, a sweep of that low into the golden pocket would provide the ideal liquidity grab before a reversal. The market often rewards those who wait for that final flush.
Bullish Recovery Path
Once the liquidity is taken and price stabilizes at the golden pocket zone, the path is open for a recovery move back into the midrange and potentially higher. The most likely magnet for price after a successful bounce would be the previous resistance zone, which coincides with the 0.5 retracement of the recent drop. That area should act as the next decision point and could either cap the rally or provide the base for a continuation if buyers show strength.
What I’m Watching
The cleanest scenario would be a sweep of the low just below support, ideally pushing into the lower green box near the 0.702 level, followed by a strong bullish reaction. I’ll be watching for a market structure shift on the lower timeframes at that point to confirm the entry. If that happens, the trade has room to develop back into the prior resistance zone, offering a solid range for intraday or swing setups.
Conclusion
Gold remains in a broader range for now, but the technicals suggest one more drop to clear late long positions before a recovery. The reaction at the support cluster will be crucial. If bulls step in after the sweep, there’s a high-probability path back toward resistance, with the move likely supported by the golden pocket confluence.
___________________________________
Thanks for your support!
If you found this idea helpful or learned something new, drop a like 👍 and leave a comment, I’d love to hear your thoughts! 🚀
GOLD ROUTE MAP UPDATEHey Everyone,
What a PIPTASTIC finish to the week! 🚀. We tracked the move down with precision durung the week and then rode the momentum right back up.
Yesterday, we confirmed the swing range activation and bounce, and that bullish follow through carried beautifully into today, completing our Bullish Target at 3348. Just perfect execution all around.
BULLISH TARGET
3348 - DONE
BEARISH TARGETS
3328 - DONE
EMA5 CROSS AND LOCK BELOW 3328 WILL OPEN THE FOLLOWING BEARISH TARGET
3305 - DONE
EMA5 CROSS AND LOCK BELOW 3305 WILL OPEN THE SWING RANGE
3289 - DONE
3267 - DONE
We will now come back Sunday with a full multi timeframe analysis to prepare for next week’s setups, including updated views on the higher timeframes, EMA alignments, and structure expectations going forward.
Thanks again for all your likes, comments, and follows.
Wishing you all a fantastic weekend!!
Mr Gold
GoldViewFX

GOLD ROUTE MAP UPDATEHey Everyone,
Please see update on our 1H chart route map.
Gold continued its bearish momentum into today, hitting our bearish target at 3238, while leaving the 3348 bullish gap still open.
After a break below 3328, price followed through and hit 3305, entering our key retracement range, which gave the bounce to manage any premature positions on the top. We’re now watching closely for a reaction at this level.
A clean EMA5 cross and lock below 3305 will open the path toward the swing range.
However, failure to lock below this level could trigger a bounce from here.
This is a pivotal area for the next directional move.
We will keep the above in mind when taking buys from dips. Our updated levels and weighted levels will allow us to track the movement down and then catch bounces up.
We will continue to buy dips using our support levels taking 20 to 40 pips. As stated before each of our level structures give 20 to 40 pip bounces, which is enough for a nice entry and exit. If you back test the levels we shared every week for the past 24 months, you can see how effectively they were used to trade with or against short/mid term swings and trends.
The swing range give bigger bounces then our weighted levels that's the difference between weighted levels and swing ranges.
BULLISH TARGET
3348
EMA5 CROSS AND LOCK ABOVE 3348 WILL OPEN THE FOLLOWING BULLISH TARGETS
3369
EMA5 CROSS AND LOCK ABOVE 3369 WILL OPEN THE FOLLOWING BULLISH TARGET
3397
EMA5 CROSS AND LOCK ABOVE 3397 WILL OPEN THE FOLLOWING BULLISH TARGET
3422
BEARISH TARGETS
3328 - DONE
EMA5 CROSS AND LOCK BELOW 3328 WILL OPEN THE FOLLOWING BEARISH TARGET
3305 - DONE
EMA5 CROSS AND LOCK BELOW 3305 WILL OPEN THE SWING RANGE
3289
3267
As always, we will keep you all updated with regular updates throughout the week and how we manage the active ideas and setups. Thank you all for your likes, comments and follows, we really appreciate it!
Mr Gold
GoldViewFX

Gold is about to experience a correction!Gold after breaking the support, now again reached the support level which will be its resistance now, will it break it or get rejected form here. Enter the long only on breakout and retest till then its bearish trend.
Bullish Sentiment Returns to Gold?Hello everyone, what are your thoughts on XAUUSD?
From a technical perspective, XAUUSD has just retested its long-term ascending trendline and formed a bullish reaction candle, suggesting that buying pressure may be returning.
Recently, a survey of 206 investors revealed that market sentiment remains optimistic, with 66% expecting gold prices to continue rising, 19% predicting a decline, and 15% anticipating a sideways market.
What do you think? Share your opinion in the comments!

Bullish Rejection from Support, Upside in FocusMarket Overview: On the M15 timeframe, XAUUSD shows signs of a short-term bullish reversal after a prolonged sideways range around the key support zone of 3,286 – 3,289 USD. Price faked out below this support but quickly recovered, forming a V-shape reversal, suggesting strong buying interest has returned.
Key Levels to Watch:
Support Zones:
- 3,286 – 3,289: Strong intraday support, tested multiple times with sharp rejections
- 3,274: Next significant support if the above zone fails
Resistance Zones:
- 3,300 – 3,304: First resistance target aligned with the recent high
- 3,308 – 3,312: Higher resistance area where supply may emerge
Technical Indicators:
EMA: Price has reclaimed the short-term EMAs, indicating bullish momentum on lower timeframes
RSI: Rising above 50 but not yet overbought – there’s room for further upside
Volume: Increasing volume during the bounce confirms buying strength
Trading Strategy:
- Bullish Scenario (Preferred): Entry Zone: Watch for pullback toward 3,290 – 3,292
Stop Loss: Below 3,285
Take Profit 1: 3,300
Take Profit 2: 3,304
Extended Target: 3,308 – 3,312 (if bullish momentum continues beyond breakout zone)
- Bearish Scenario (Alternate): Only valid if price breaks and closes strongly below 3,286
Short Target: 3,274 – 3,270
Note: Counter-trend strategy – higher risk, requires strong confirmation
Conclusion: Gold is showing a bullish price structure on the 15-minute chart. As long as price holds above the 3,286 – 3,289 support zone, the path of least resistance appears to be upward, with 3,300 and 3,304 as the next logical targets. Monitor price action closely during the U.S. session for a potential long setup.
- Follow for more real-time gold trading strategies and save this idea if you find it helpful!
XAUUSD – Downtrend Continues as USD StrengthensGold remains under significant pressure as the U.S. dollar continues to gain strength following a series of positive economic data from the U.S. Specifically, GDP grew by 2.5%, beating expectations, while ADP Non-Farm Employment data also came in strong. This suggests the U.S. economy remains resilient, supporting the Fed's hawkish stance and keeping the dollar strong.
On the 4H chart, XAUUSD has broken below the previous ascending price channel and is now trading under the 3,340.400 resistance zone – an area packed with unfilled FVGs. The current price structure leans bearish, with any rebounds likely to be temporary pullbacks.
If USD strength continues, gold could drop further toward the support zone at 3,279.200 or even lower near 3,240.
Trading Strategy: Focus on SELL
Entry: Around 3,325 – 3,340.400 upon price rejection signals.
Target: 3,279.200 or lower.
Stop-loss: Above 3,342.459

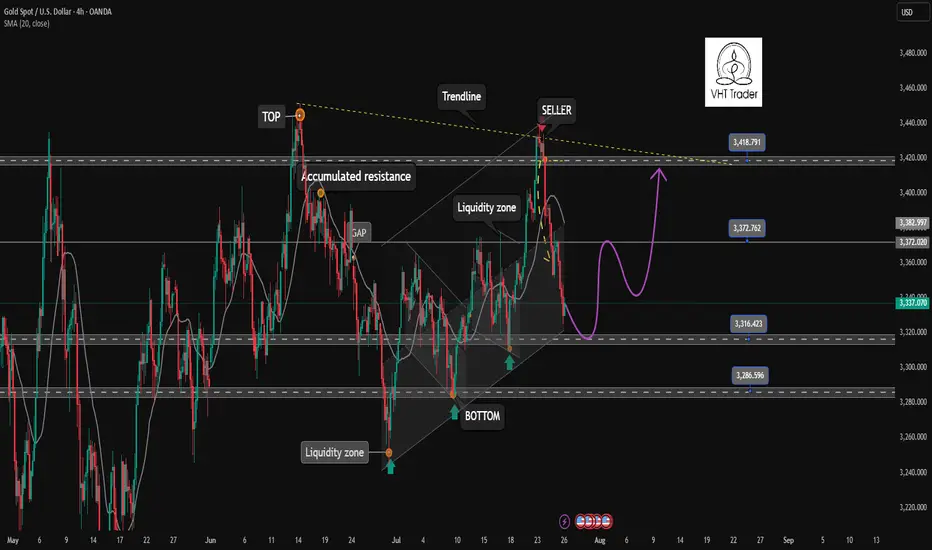
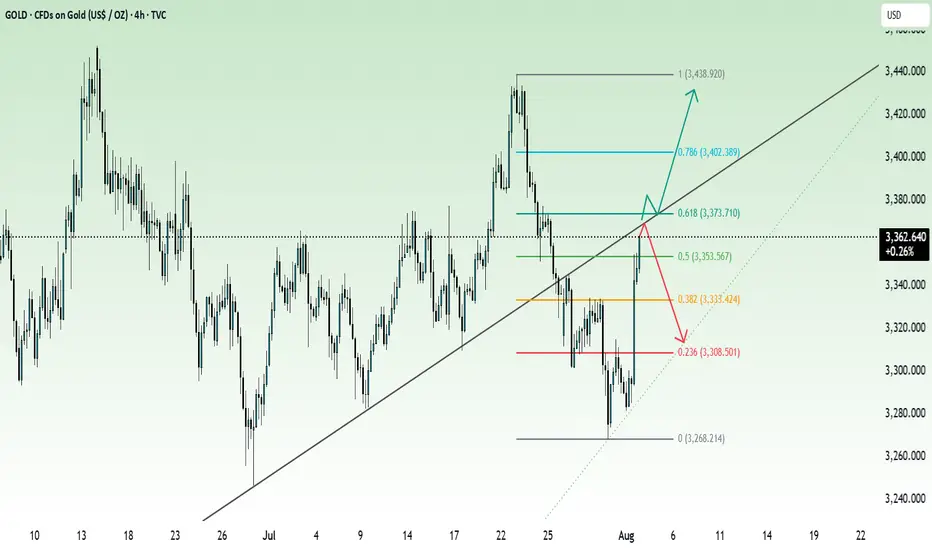
Gold Eyes Rebound Toward $3,438 TargetGold (XAU/USD) is trading near $3,314, approaching support along the rising trend line. A potential bounce could target the $3,438 resistance area, as marked in the chart.

Gold - The diligent top formation!🏆Gold ( TVC:GOLD ) finished the bullrun:
🔎Analysis summary:
For the past 10 years, Gold has been trading in a very strong expected bullrun. Just like we witnessed it in 2011, a 10 year bullrun is followed by a shorter term bearmarket. Gold is starting to lose its strength, which is a clear sign of weakness and the beginning of a bearish reversal.
📝Levels to watch:
$2.800
SwingTraderPhil
SwingTrading.Simplified. | Investing.Simplified. | #LONGTERMVISION
