Gold Market Shorts to 3370's, Eyes Pullback to 3400'sGold market initiates a short move down to 3370's, reacting to short-term resistance.
A pullback stance is now forming, targeting a potential retracement back through to the 3400's, follow for more insights , comment and boost idea
XAUUSDG trade ideas

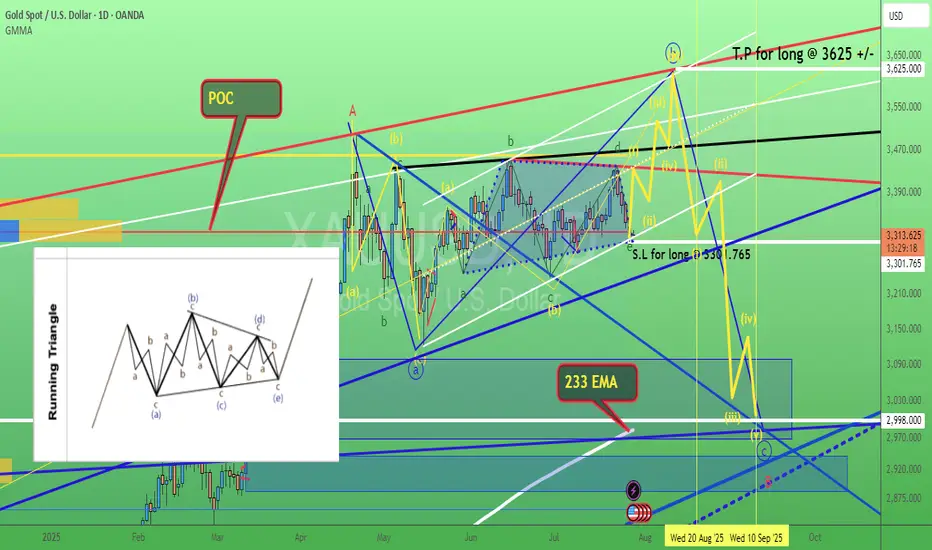
XAU/USD – Elliott Wave Update | Wave (2) in Progress)OANDA:XAUUSD
🔍 Wave Structure Overview
We’re currently in a
Prior impulse (likely 1-2-3-4-5) completed, forming (Circle) wave ①
Current correction unfolding as (A)-(B)-(C) in yellow
↳ Presently in wave (A) or transitioning into (B)
↳ Within (B), structure is forming as A-B-C
↳ Currently tracking 5-wave move from 4 to 5
📐 Fibonacci & Key Levels
Watching 61.8% retracement as a critical support zone ✅
This level also marks a high-probability TP area for short positions
Strong confluence:
🔹 Fibonacci retracement
🔹 Extension alignment (e.g. yellow fib extension to ~4403)
🔹 Trendline reaction expected
🧠 Trade Setup (Scenario-Based)
🔸 Scenario A – Early Entry:
Enter small long near 61.8% Fib zone
SL: Below last swing low
TP: To be refined once C-wave completes
🔸 Scenario B – Confirmation Entry:
Wait for break above red trendline
Add position
SL below Fib zone low
TP around Fibonacci extension / structure resistance (~4403)
⚠️ Key Considerations
Many positions will close in this zone → increase in selling pressure
Possible reversal zone → watch for confirmation (impulse or ABC)
Once wave (C) completes, we’ll likely see entry into a larger bearish move
📎 Conclusion
This is a high-probability reversal zone, supported by Elliott structure and Fib levels. I’m planning to scale in based on price action and confirmation.
📈 Stay flexible, manage risk, and watch the structure evolve.

Gold 1H Intra-Day Chart 28.07.2025We saw a perfect move towards our $3,310 target, hitting our TP. What's next?
Option 1: Gold now moves higher into the $3,385 area, before we can determine the next major move.
Option 2: Gold drops lower towards $3,265 next.
Which scenario do you find more likely?

Gold: ascending triangle sets up big opportunityGold has traded sideways for 93 days, but breakout traders should take note. A clear ascending triangle is forming, offering a high reward-to-risk setup. I walk through the key levels, breakout zone, and why this could lead to a 6x return. Bulls may be frustrated, but momentum is building. Are you ready?
This content is not directed to residents of the EU or UK. Any opinions, news, research, analyses, prices or other information contained on this website is provided as general market commentary and does not constitute investment advice. ThinkMarkets will not accept liability for any loss or damage including, without limitation, to any loss of profit which may arise directly or indirectly from use of or reliance on such information.

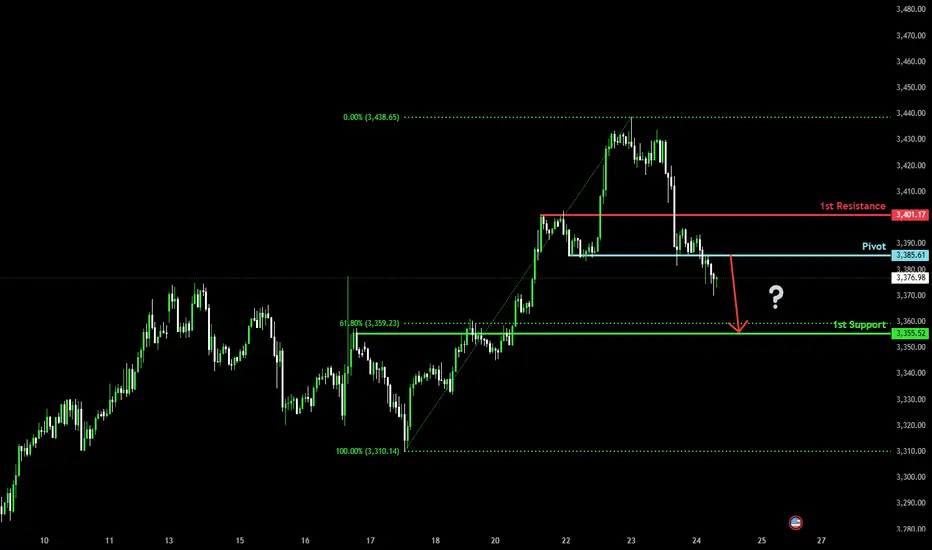
Bearish drop?The Gold (XAU/USD) has reacted off the pivot and could potentially drop to the 1st support, which is a pullback support that is slightly below the 61.8% Fibonacci retracement.
Pivot: 3,385.61
1st Support: 3,355.52
1st Resistance: 3,401.17
Risk Warning:
Trading Forex and CFDs carries a high level of risk to your capital and you should only trade with money you can afford to lose. Trading Forex and CFDs may not be suitable for all investors, so please ensure that you fully understand the risks involved and seek independent advice if necessary.
Disclaimer:
The above opinions given constitute general market commentary, and do not constitute the opinion or advice of IC Markets or any form of personal or investment advice.
Any opinions, news, research, analyses, prices, other information, or links to third-party sites contained on this website are provided on an "as-is" basis, are intended only to be informative, is not an advice nor a recommendation, nor research, or a record of our trading prices, or an offer of, or solicitation for a transaction in any financial instrument and thus should not be treated as such. The information provided does not involve any specific investment objectives, financial situation and needs of any specific person who may receive it. Please be aware, that past performance is not a reliable indicator of future performance and/or results. Past Performance or Forward-looking scenarios based upon the reasonable beliefs of the third-party provider are not a guarantee of future performance. Actual results may differ materially from those anticipated in forward-looking or past performance statements. IC Markets makes no representation or warranty and assumes no liability as to the accuracy or completeness of the information provided, nor any loss arising from any investment based on a recommendation, forecast or any information supplied by any third-party.
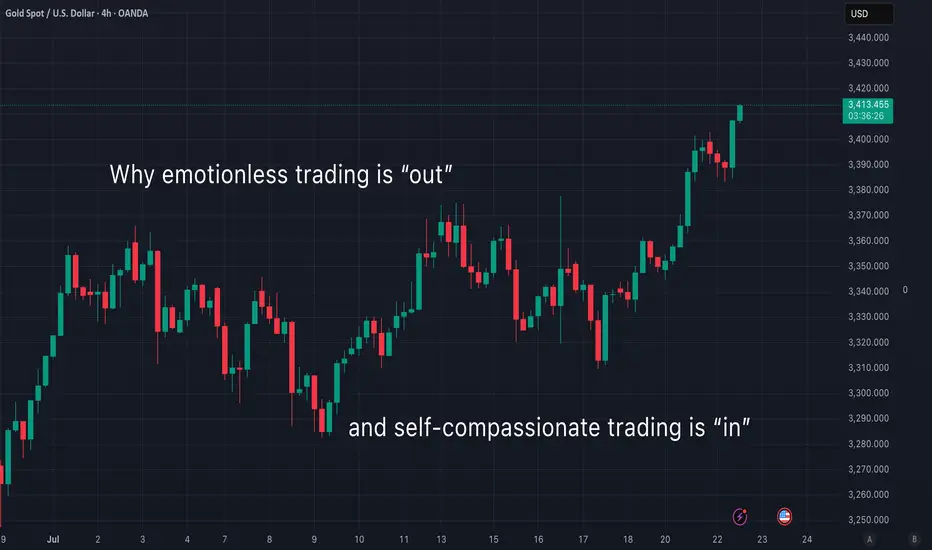
Why emotionless trading is out (and what to do instead)Curious about what self-compassionate trading really means?
Let’s do a little thought experiment together. Imagine you just closed a losing trade. You’re feeling disappointed and unmotivated. You invite two friends over to your home and tell them what happened. Which friend would you rather talk to?
🙋🏽♀️ Friend 1 says:
"What a failure you are. Why were you even stressed out? That’s so silly. Couldn’t you see this trade was going to be a loss? You should just give up—what’s the point of trying? I don’t understand how you could mess up the way you did. Let’s spend the afternoon going through everything you did wrong."
...Or would you prefer:
🙋🏽♀️ Friend 2 who says:
"I can see you’re feeling sad and disappointed about that last trade. I’m really sorry it didn’t go your way. But you know what? Losses are a part of trading—we all go through them. You’ll have another chance tomorrow. I can tell you’re doing your best. Let’s do something kind for ourselves today, and tomorrow you’ll get back to it. Don’t give up—I’m proud of you for chasing your dreams."
🤔 So, who would you choose?
I know this little experiment might sound a bit dramatic—but be honest, wouldn’t we all prefer Friend 2 ? And isn’t Friend 1 sounding suspiciously like that inner critic of yours?
For the longest time, trading advice has told us to "get rid of emotions" and stay completely “stress-free.” I wish it were that simple…
The truth is, trying to trade without emotions is like talking to yourself like Friend 1 . Not only is it impossible —it also builds a harsh, critical inner dialogue that damages both your confidence and motivation.
The reality is: we don’t have full control over our thoughts and emotions. They show up whether we want them to or not. If we could choose our emotional state, we’d all stay calm and focused every time we trade. But that’s not how the human mind works.
Instead of fighting our emotions, we can learn to open up to them—without judgment.
Self-compassionate trading means treating yourself like Friend 2 . It’s about acknowledging when things are tough, and being kind to yourself when stress or anxiety shows up. It’s about replacing harsh self-talk with encouragement, warmth and understanding.
👩🏽🔬 Some people think self-compassion is soft, ”girly”, or even “too emotional.” But guess what? It’s backed by tons of solid research. Studies show that self-compassion helps reduce self-criticism and improve motivation. It’s also an effective tool for managing tough emotions and reducing stress and anxiety.
Self-compassionate trading is a win-win approach—it helps you stay grounded and resilient while building a meaningful trading journey. So why not give it a try? 👇
💡 Pro Tip:
Next time you close a losing trade, find yourself in a losing streak, or just feel anxious about your performance—ask yourself:
“What would I say to a good friend who’s going through the same thing?”
Then offer that same kindness and support to yourself.
Happy (self-compassionate) trading! 💙
/ Tina the Trading Psychologist
Gold Market Completes Bullish Wedge at 3439Gold market lures to 3439, completing the bullish wedge formation as anticipated.
A retracement is now setting in, with price action expected to sweep through 3391—a key zone that may determine the next leg of the trend.
Watch closely for confirmation at this level for a potential bullish continuation or deeper correction. follow for more insight , comment and boost idea
Gold Outlook- My BiasAlways know I do not own the market, I only predict what i think ,May happen and I may be wrong, but I have followed my set of rules.

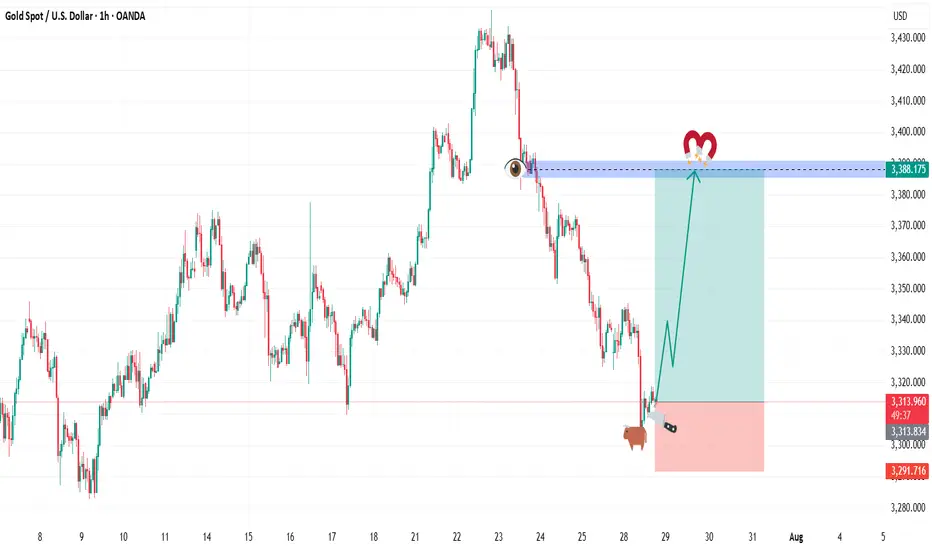
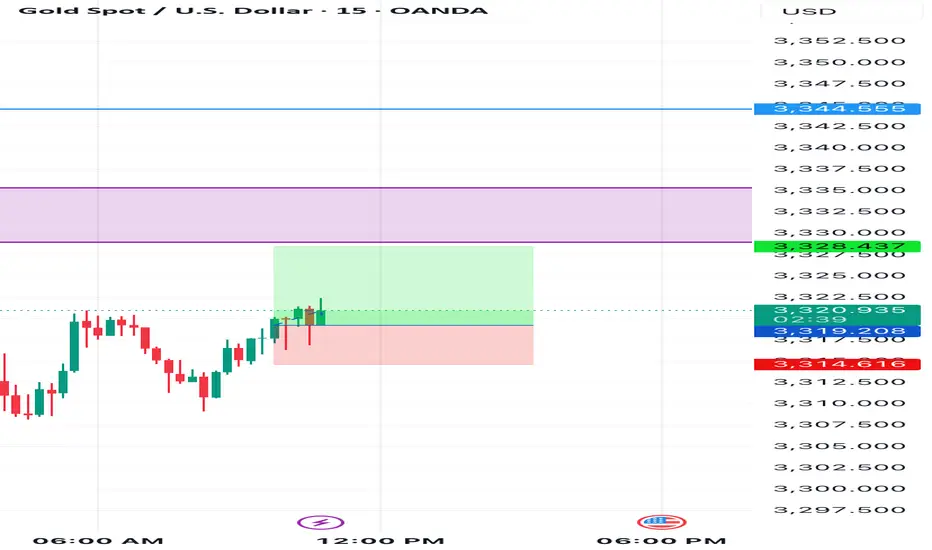
BUY GOLDIn todays session we are monitoring GOLD for buy opportunities. We have out entry at 3313.600 and stops below 3291 our target is at 3388.175 and higher. Use proper risk management. Cheers to you all.
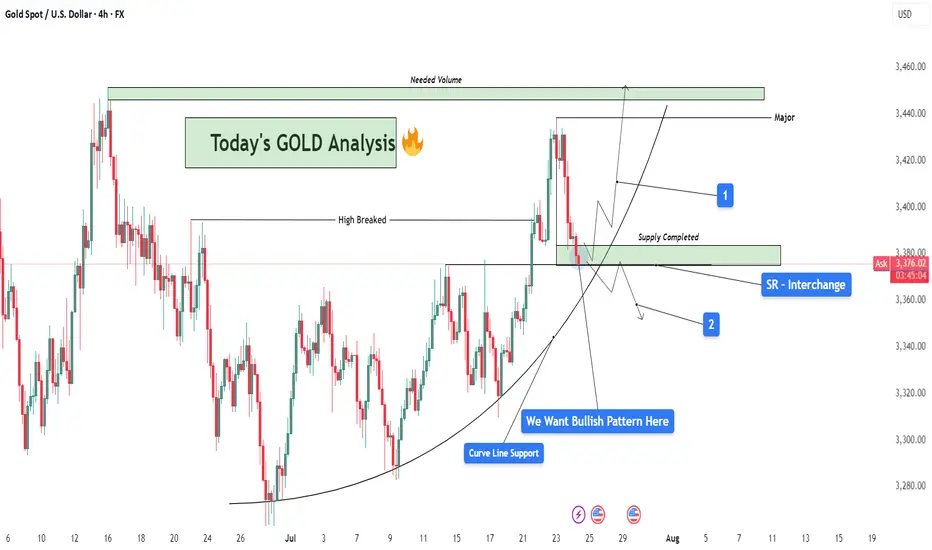
GOLD Analysis : SR Interchange , Reversal Zone + High Break🧠 Market Context & Structural Overview:
Gold has been trading within a clearly defined bullish structure after forming a rounded base pattern in early July, indicating accumulation by smart money. The market recently broke through a key horizontal resistance (previous swing high), marking a potential bullish continuation phase. However, we are now witnessing a pullback — a healthy corrective phase — that is currently testing multiple high-probability confluences.
🧱 Key Technical Zones Explained:
🔹 1. SR Interchange Zone – High Probability Reversal Area:
This area (roughly between $3,360 and $3,380) acted as previous resistance (supply) and has now flipped into support.
This is a textbook Support-Resistance Interchange (SR Flip) — a concept where prior resistance becomes new support.
Traders often look for entries here, especially when it aligns with other technical factors.
🔹 2. Curve Line Support – Dynamic Buyer Strength Indicator:
A curved trendline, often referred to as a parabolic support, has been respecting price structure for over two weeks.
Price is now sitting exactly on this support, signaling potential for another impulsive bullish leg if momentum builds.
🔹 3. Supply Zone Completed – Correction Phase Active:
The supply zone above (approx. $3,420–$3,440) has already been tapped and respected by the market.
This “completed” supply may now act as resistance unless broken with strong volume — we now watch how price reacts at the current pullback zone.
📊 What the Candles Are Telling Us:
The latest candles show some hesitation from sellers — wick rejections and smaller body candles hint at buyer interest at this level. However, confirmation is crucial. We want to see a bullish reversal pattern such as:
Bullish engulfing
Morning star
Pin bar (hammer)
Break and retest of minor resistance inside the SR zone
🔮 Scenarios to Watch:
✅ Scenario 1 – Bullish Continuation (Ideal Setup):
If a bullish reversal forms at this support zone:
Expect a potential rally back to the $3,420–$3,440 resistance area.
If this zone breaks with high volume, price could target the major supply zone near $3,465+, where we’ll need “Needed Volume” for a decisive break.
⚠️ Scenario 2 – Bearish Breakdown (Alternative View):
If the curve support and SR zone fail to hold:
Expect a drop towards $3,345 – $3,320 — where next structural support lies.
This would suggest a deeper retracement or range formation before bulls can regroup.
🧩 Strategy & Psychology:
“We want bullish pattern here.”
You’ve highlighted the importance of not entering impulsively. This is about trading with confirmation, not prediction. Waiting for a valid bullish pattern reduces risk and increases probability.
This is where smart traders win — waiting patiently for confirmation at a zone of confluence.
🧠 Learning Mindset – Why This Zone Matters:
Combines horizontal support, curved trendline, and broken structure retest.
This zone is the battleground between bulls and bears — whoever wins here will likely control short-term momentum.
Newer traders can study this as a classic example of multi-confluence trading, which combines price action, market structure, and dynamic trendlines.
XAUUSD SELL SHORTXAUUSD SELL SHORT
- In Daily TF H4 TF Market is bearish
Selling from H4 SIBI In LTF Valid MSS then our entry

XAU/USD – Current Wave Count & Potential ScenariosOANDA:XAUUSD
We are currently moving from (white) wave 3 to (white) wave 4.
So far, I am leaning towards the white count where the waves labeled (A), (B), (C) form a larger corrective wave A, which leads to wave B, and then to (white) wave 4.
Up to now, we have only completed (A) and (B).
Now, in the yellow bracket, we can interpret a 1-2-3-4-5 structure leading to (white) wave C 🟡.
Alternatively, one could interpret a triangle pattern (pink count):
Waves A, B, C, D, E, which would then form our wave 4.
In that case, we would expect bullish targets afterwards 🚀.
We need to watch closely if the price reverses or breaks through our yellow Fibonacci zone 🟡.
For now, we are primarily looking for upside potential 🔼.
From our yellow wave 2, we saw a downward push, which could theoretically be our yellow wave 1 leading into yellow wave 2 and the yellow Fibonacci zone — essentially a five-wave move from wave 2 to wave 3.

XAUUSD Analysis TodayHello traders, this is a complete multiple timeframe analysis of this pair. We see could find significant trading opportunities as per analysis upon price action confirmation we may take this trade. Smash the like button if you find value in this analysis and drop a comment if you have any questions or let me know which pair to cover in my next analysis

GOLD gartely , XAUUSD ShortLooks like a perfect gartely pattern here on 4h frame , gold might go bearish to 3260

Gold short-term bearish
From the Bollinger daily line, as shown in the figure below, the gold price should still test the lower track of $3,280 in the future. The short-term upward trend line has also been broken, and this yellow line has now become a pressure.
From the moving average system, the daily line is chaotic, and the gold price goes up and down without order and rules to cross the moving average, so the daily moving average system has no reference significance. From the weekly line, the gold price has the need to step back on the 20-week moving average of $3,277 to $3,280.
So, if I look at the bearish, I can only see $3,277 to $3,280. No deeper decline can be seen, and no more signals appear. Therefore, shorting is relatively short. Or it is short within the daily Bollinger track, not structural short or trend short. Everything has a law, just oscillation.
So, I think that even if there is a short in the future, it is the end of the short. It is the right way to stop when you see good results. Even though the current gold price has fallen due to the short-term positive tariff negotiations between Trump, Japan and the European Union, the tariff level is still much higher than before, which will undoubtedly bring more uncertainty to future economic growth. Many other factors are not conducive to a sharp drop in gold prices. The overall situation is that the basic trend of gold price increases is intact.
Therefore, the high point of $3345.30 has become the watershed between long and short positions. You can use this as the dividing line for long and short operations. There is nothing wrong with setting a loss above $3345.30 to short in batches. There is nothing wrong with placing a long position at 3346. The market trend is very uncertain, so it all depends on what order you want to make.

Daily gold analysisDaily gold analysis
A long position with the target and stop loss as shown in the chart
The trend is up, we may see more upside
All the best, I hope for your participation in the analysis, and for any inquiries, please send in the comments.
He gave a signal from the strongest areas of entry, special recommendations, with a success rate of 95%, for any inquiry or request for analysis, contact me
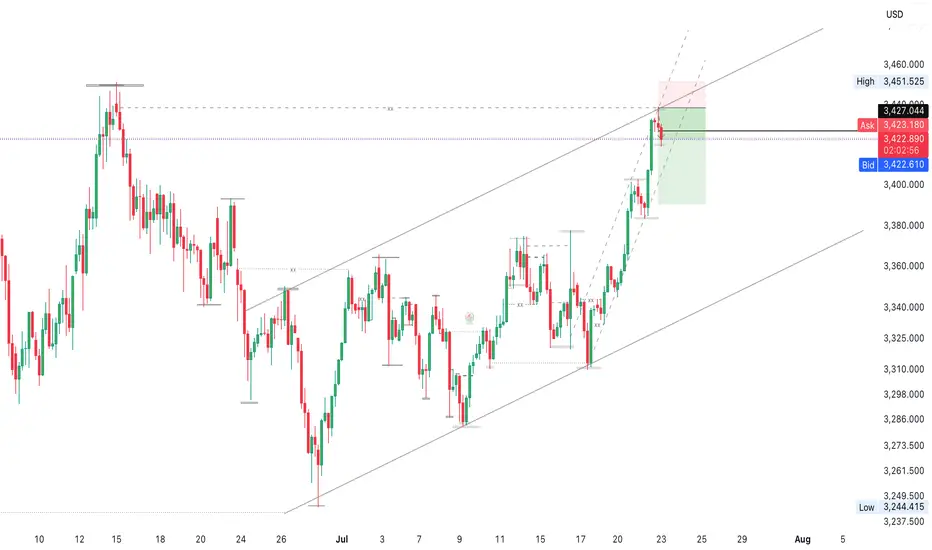
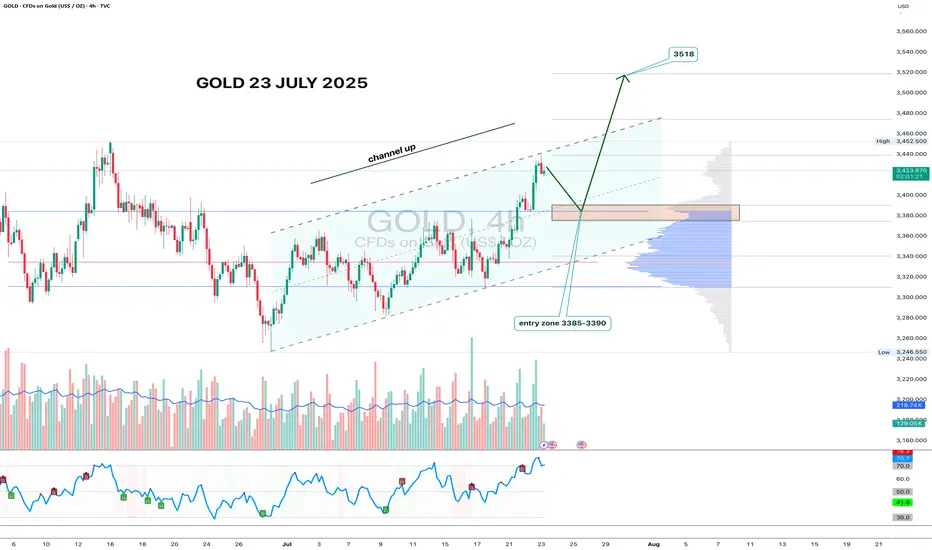
Gold 4H - channel breakout, looking for 3518 nextGold has formed a clean ascending channel on the 4H chart, broke out above resistance, and is now pulling back into the 3385–3390 zone. This area aligns with volume clusters - a perfect entry zone for bulls waiting on the sidelines.
If price holds this zone and prints a reversal candle with volume, the upside target remains at 3518 - the 1.618 Fibonacci extension and historical resistance. Volume increased during the breakout move, confirming interest. RSI still has room to go higher, supporting the bullish continuation.
Fundamentally, gold remains a safe-haven asset amid geopolitical tension, USD weakness, and potential Fed easing. Central bank accumulation further supports the bullish case.
Tactical setup:
— Entry zone: 3385–3390
— Trigger: candle confirmation + volume
— Target: 3518
— Invalidation: break below 3360 without buyer volume
If the plan plays out — gold might shine bright while bears squint in disbelief.
DeGRAM | GOLD will retest the channel boundary📊 Technical Analysis
● Fresh rejection at the blue resistance line (~3 435) pushed XAU back to the 3 355 mid-band, yet successive higher-lows (green arrows) keep price inside the May-origin rising channel.
● The pullback is probing 3 328-3 355 — confluence of the former flag roof and triangle top; holding this zone should launch another test of 3 400/3 435, with the channel crest targeting 3 500.
💡 Fundamental Analysis
● U-S S&P-Global PMIs softened, nudging 2-yr real yields to three-week lows, while cautious ECB rhetoric limits dollar gains — both supportive for gold.
✨ Summary
Long 3 328-3 355; above that aims 3 400 ➜ 3 435, stretch 3 500. Invalidate on an H4 close below 3 293.
-------------------
Share your opinion in the comments and support the idea with a like. Thanks for your support!

XAUUSD - Parabolic move ahead in GOLD.Gold currently at 3339 is retesting its trendline breakout, setting the stage for a potential move to $4,000 as momentum builds. I expect all metals, particularly precious ones, to perform strongly moving forward.
If you like this idea, do boost and share :)

GOLD Weekly Idea💡Why Gold Pulled Back
- Gold pulled back today after hitting $3439.04, just below resistance at $3451.53. Traders took profits ahead of key Fed and trade headlines. Right now, it’s trading around $3414.48, down 0.50%.
- The dip came after the U.S.-Japan trade deal eased geopolitical tension, cutting safe-haven demand. Plus, U.S. bond yields are climbing (10-year at 4.384%), which adds pressure on gold.
Support is building at $3374.42, with stronger buying interest expected around $3347.97 and the 50-day moving average at $3336.40 — a key level bulls want to defend.
Short-term looks a bit weak, but as long as gold holds above the 50-day MA, the bullish trend remains intact. Longer-term, weakness in the dollar, central bank gold buying, and concerns about Fed independence could push prices higher.
🔍Watching the Fed’s July 29–30 meeting next
Gold. wave e (green) of triangle possible reached. 29/July/25XAUUSD based on speed of chart + confluence zone 1) Channel Support 2) POC of volume profile 3) Trendline support. Gold probably completed its wave e (green) of triangle.
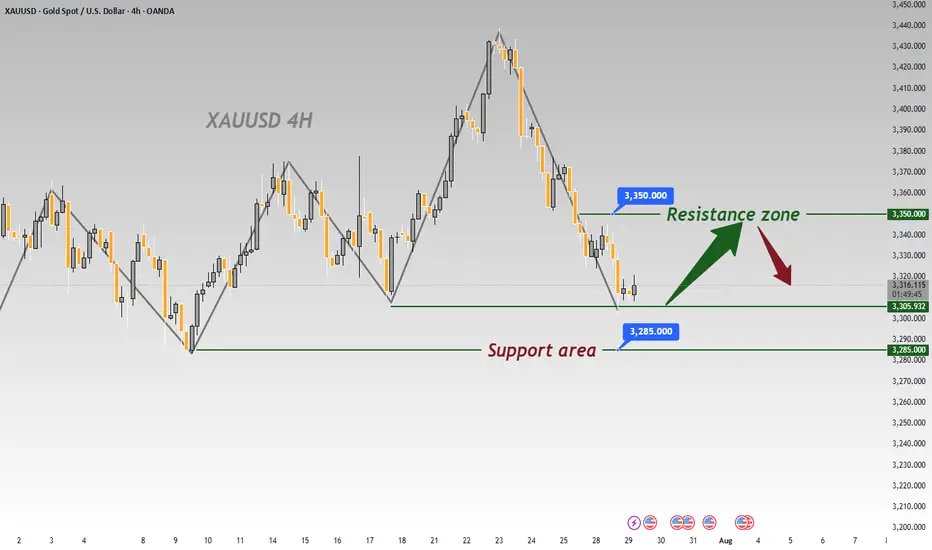
Gold: This Week's Analysis & StrategyThis week, the fluctuations have clearly moderated📉. Focus on a strategy of buying at lows and selling at highs as much as possible📈. Currently, the resistance around 3350 is prominent🚧, and 3300 acts as support below🛡️. If the decline continues, it may reach around 3285👇
We successfully took short positions last week 📉, and this week I recommend going long at lower levels 📈. Over the long term, gold remains in a bull market 🐂, but it will not repeat the frenzy seen in April; instead, it will maintain a steady upward pace ⬆️.
Market expectations for Fed rate cuts have been volatile so far this year 📊. At the start of the year, as Trump-related developments unfolded, market optimism faded 😐. Meanwhile, the de-dollarization trend fueled growing expectations of Fed rate cuts 💹. By early April, Trump’s reciprocal tariff measures—far more aggressive than expected—roiled global financial markets 🌍, triggering a surge in concerns about a U.S. recession ⚠️. Markets thus anticipated that the Fed would cut rates quickly to shore up the economy, with expectations for rate cuts within the year once exceeding 100 basis points 📉. However, shortly after, Trump announced a 90-day extension of the reciprocal tariffs, easing market pessimism 😌 and driving a strong rebound in U.S. stocks 📈. At this point, markets began worrying that his tariff policies could spark an inflation rebound 🔥, leading to a steady decline in rate cut expectations—currently, expectations for rate cuts this year have dropped to fewer than two 🔄.
Risk Warning ⚠️
Event Sensitivity: Outcomes of China-U.S. trade talks 🤝, the Fed’s statements , and nonfarm payroll data 📊 may trigger one-sided volatility. Positions should be adjusted promptly to avoid risks 🛡️
⚡️⚡️⚡️ XAUUSD ⚡️⚡️⚡️
🚀 Buy@ 3300 -3310
🚀 TP 3320 - 3330 - 3340
🚀 Sell@ 3350 -3340
🚀 TP 3330 - 3320 - 3310
Daily updates bring you precise trading signals 📊 When you hit a snag in trading, these signals stand as your trustworthy compass 🧭 Don’t hesitate to take a look—sincerely hoping they’ll be a huge help to you 🌟 👇
XAUUSD--SHORT--second shoulder of "head and shoulder" pattern is about to form.
--next week, pullback to near to crossection point o two orange line, between levels 3369 and 3355
--then downward movement to the level 3283
