XAUUSD - market structureXAUUSD - market structure, XAUUSD - market structure , use risk and trade managment, this is not FULL analysis
XAUUSDG trade ideas
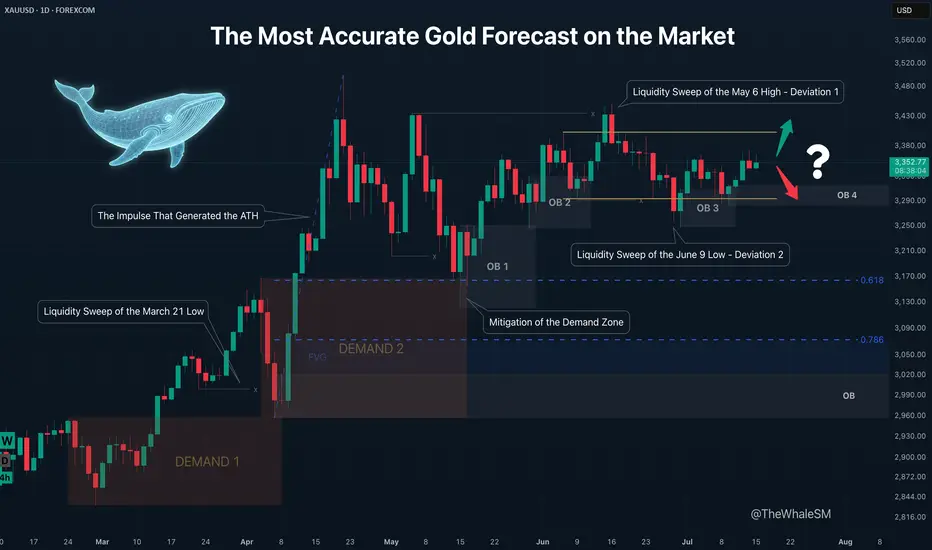
The Most Accurate Gold Forecast on the MarketThis is a continuation of sorts of my educational article that received an "Editor's Pick" from TradingView and a large number of positive reactions from this amazing trading community. However, unlike that post, this is a trade idea that outlines clear entry conditions for when the price reaches a relevant manipulation zone and shows a reversal reaction. If you don't want to get into the details and trace the entire chain of events through which large capital brought the price to its current levels, feel free to skip the intro and go straight to the 4H chart with the long setup conditions.
To better understand the logic of "smart money," let's revisit the Gold daily timeframe from my educational article:
We will approach this analysis like detectives, following the facts and footprints in the style of Sherlock Holmes and Hercule Poirot.
So, let's begin our investigation. On the daily structure, we see a clear order flow confirming the intention of large capital to lead the price in continuation of the uptrend. After the latest impulse that began on February 28th and ended on April 3rd, the price corrected and mitigated the DEMAND1 manipulation zone. The "Whale" refueled with liquidity, eliminated some competitors, closed its losing short positions used for the manipulation, and gained energy for the next impulse that set a new ATH. The correction that mitigated the DEMAND1 zone was nothing other than the next manipulation, also in the form of a DEMAND zone, within which there is a still-valid daily order block. How can we assert that DEMAND 2 is a manipulation and not just a correction?
Firstly, the sharp nature of the move swept liquidity from the March 21st low. Secondly, the sharp upward impulse accompanied by a series of FVGs showed the Whale's true intention. And thirdly, the reversal from this DEMAND 2 zone, combined with the 61.8% Fib retracement level, resulted in the formation of the next manipulation in the form of the OB 1 order block. Further, we see the continuation of the order flow on this daily structure; the price reacts to OB1, forming another order block, OB2 . The impulse from OB2 sweeps liquidity from the May 6th high. Many might have expected a continuation of the impulse and a new ATH instead of a sweep of this high, but as often happens when too many participants pile into one direction, the price sharply reverses and liquidates their positions. This intense decline after sweeping the high looked something like a local trend change from bullish to bearish, but the sharp recovery after sweeping the liquidity from the June 9th low and forming a new order block, OB 3 , finally revealed what was really happening: it turned out to be a range . It's impossible to identify a range until it is fully formed. A range is another type of manipulation where internal and external liquidity is swept from both sides. In our case, there was first a deviation above (Deviation 1 on the chart), then a deviation below (Deviation 2), after which the price swept some internal liquidity and got stuck exactly in the middle of the range.
And finally, after all our investigations and deductions, we can say with absolute certainty, practically with 100% confidence divided by two, that ABSOLUTELY NO ONE KNOWS where the price will go from the current levels. Because the center of a range is a state of complete uncertainty. Moreover, I dare to suggest that even the Whales don't know where the price will go right now. They certainly have enormous funds to sharply move prices at the right moments to capture liquidity and conduct manipulations. At other times, they can nudge the market to create a trend and direct it like a chain reaction of falling dominoes. But the entire market is much larger, and if its sentiment changes drastically due to external factors, smart money won't waste its resources fighting it. Their goal is to make more money, nothing personal. Why else is the price stuck in the middle right now? Inflation data is coming out soon, which could push the price in an unpredictable direction. The Whales will wait to use this news-driven impulse to their advantage.
So, what have we concluded from this investigation? Was it all in vain since we can't even say with 51% probability where the price will go next? Of course not. We simply need to wait for the price to reach an area where the probability of it moving in a certain direction is significantly higher than 50% — that's all you need to be profitable in the long run. This probability will never be close to 100% because we don't know what's really happening in the depths of the market. Are the Whales accumulating positions in this range now, or are they selling off at high prices after the ATH? Unless you are one of the few direct participants in large capital, you can't know this. Moreover, you don't need to know it to make a consistent profit in the market. It is enough for us to predict the next move of smart money with high probability at certain moments, join their movement, and take our profit. It's like a weather forecast: the further from the current date, the lower the probability of it being accurate. It's the same with the market; a completely unpredictable combination of factors, news, and hidden internal processes can lead the price on a unique path, but always accompanied by smart money. It doesn't matter where the gold market goes next, whether to a new ATH or down to the next correction level. When the Whale reveals itself again by leaving a trail in the form of a manipulation, we can lie in wait near it and join its next move. Why is it generally a good idea to enter from manipulation zones? You are essentially stepping onto a field where the Whale has already cleared the liquidity, and it has returned to that place for other business — to close its losing positions. That is, a mitigated manipulation zone is a safer place to enter the market; there's a much lower chance the Whale will absorb your position. Right now, we have such a manipulation in the form of the OB 4 order block, and we can switch to the 4H timeframe to look at a potential entry zone in more detail.
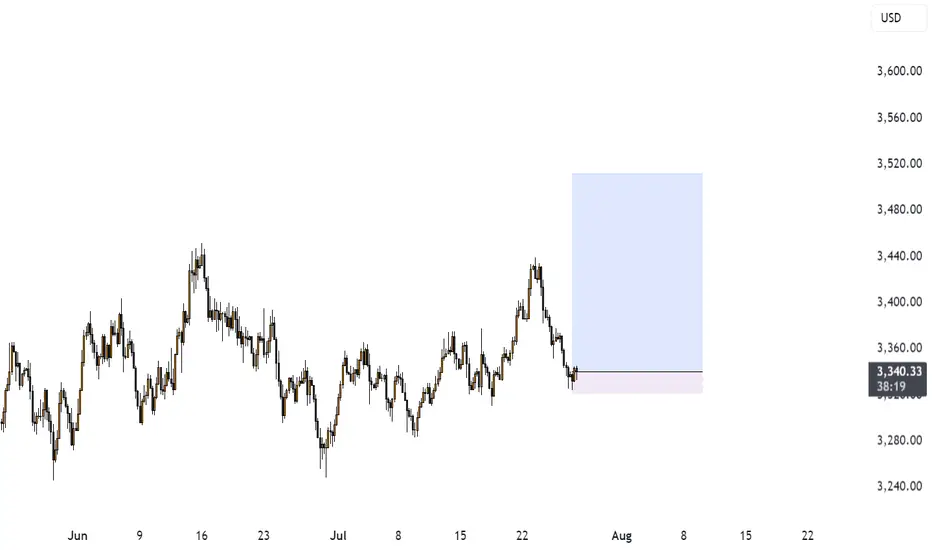
4H CHART - SETUP CONDITIONS
So, we already know the general context: the price is inside a range. After the second deviation, it has already reacted to the order block formed after it, and we are waiting for the mitigation of the next one, OB 4 , which will serve as a pivot point for a potential setup. A reversal from this order block will confirm the order flow for the price to move at least to the upper boundary of the range. The presence of a manipulation zone alone is not enough to open a position; additional confirming conditions are always needed. As one such condition here, we can take the combination of mitigation with one of the Fibonacci retracement levels — 61.8% or 78.6%. Upon reaching each level, the price must hold (not be broken by the bodies of 1-4H candles) and show a reversal reaction. The final confirmation for entry will be an LTF confirm in the form of a break of structure (BOS) or the beginning of order flow on a lower timeframe. An important part of the context is that important US inflation news is coming out soon, and positions should not be opened right before it or for some time after (at least an hour).
Invalidation of the long scenario would be a break below the 78.6% level and OB 4.
~~~~~~~~~~~~~~~~~~~~~~~~~~~~~~~~~~~~~~~~~~~~~~~~~~~~~~~~~~~~~~~~~
If you found this analysis helpful, support it with a Boost! 🚀
Have a question or your own view on this idea? Share it in the comments! I read every single one. 💬
► Follow me on TradingView for more educational content like this and to not miss my next detailed trade idea .
~~~~~~~~~~~~~~~~~~~~~~~~~~~~~~~~~~~~~~~~~~~~~~~~~~~~~~~~~~~~~~~~~
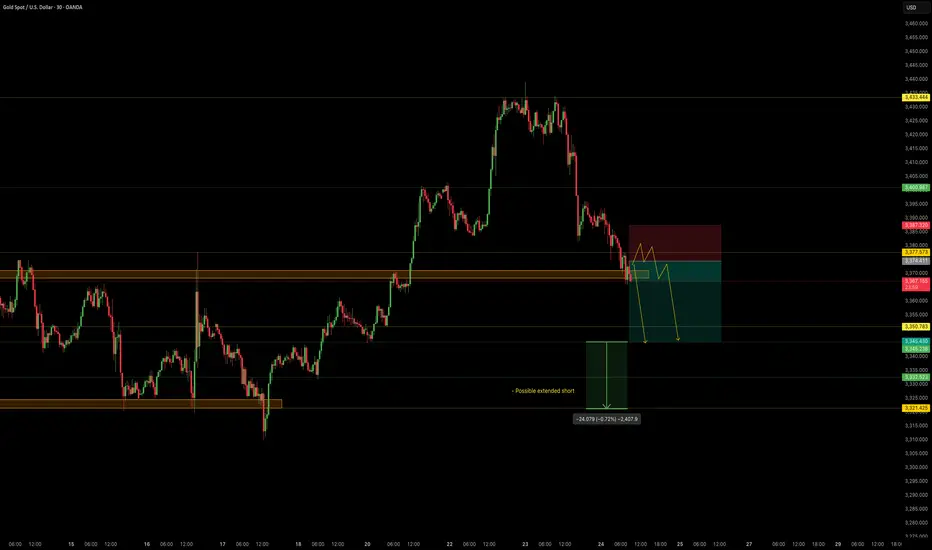
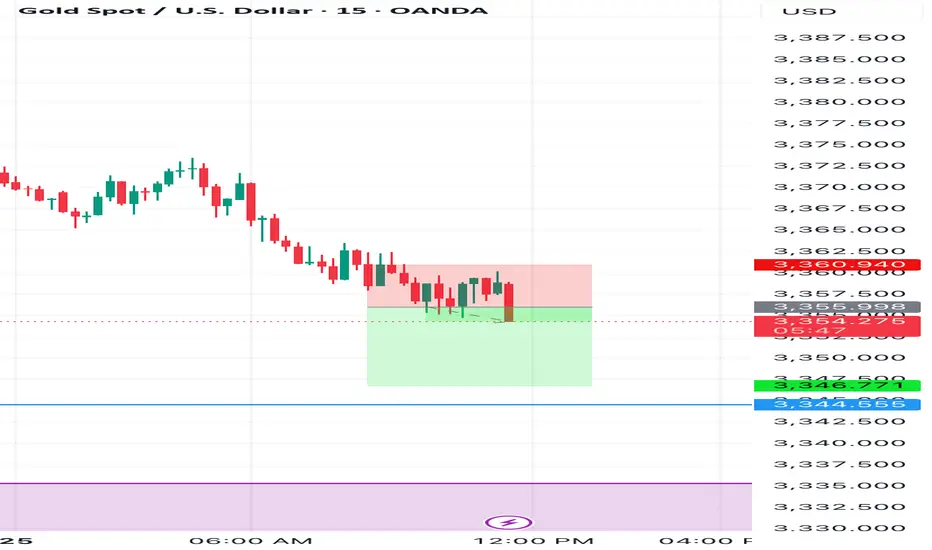
NordKern - XAUUSD InsightNordKern | Simplified Insight OANDA:XAUUSD – Short Opportunity Ahead
Gold is now near our important level at 3370, offering a shorting opportunity considering recent events and technical action.
Gold Price Decline – What's Behind It?
In the last two sessions (July 23–24), gold has retreated strongly owing to a set of global as well as market-specific circumstances:
1. Trade Deal Optimism
Advances in U.S.–Japan and U.S.–EU trade discussions lessened worldwide uncertainty, decreasing demand for gold as a safe-haven.
2. Higher U.S. Yields
Higher Treasury yields are rendering non-yielding assets such as gold less appealing, adding to downward pressure.
3. Technical & Profit-Taking
Following a recent rally, gold was exposed to selling. Stop-loss and profit-taking triggers hastened the fall.
Summary of Key Drivers
U.S. Trade Deals: Reduced geopolitical risk
Higher Treasury Yields: Decreased gold's relative attractiveness
Technical Selling: Enhanced the downward trend
Trade Setup – Bearish Bias
Entry : 3374.4
Stop Loss : 3387.3
Take Profit : 3345.4
Extended Target : 3322
Key Notes:
- Trade Deal Optimism: U.S.–Japan and U.S.–EU agreements eased global tensions, reducing demand for gold as a safe-haven asset.
- Yield Pressure: Rising U.S. Treasury yields made gold less attractive compared to interest-bearing alternatives.
- Technical Selling: Profit-taking and stop-loss triggers accelerated the decline after gold’s recent rally.
This setup remains tactically driven. Manage risk carefully and monitor for any renewed political shifts.
Short XAUUSDElite Analysis
Price Hit a 6H BOS
Price rejected the OB
Detected a bearish BOS, confirmed it a second time.
Executed in 5m, targeting a lower liquidity pool.
Bullish or Bear trapHello Traders 👋
What are your thoughts on XAUUSD
Looking at the daily timeframe I anticipate manipulation by market players on gold.
Is likely that market players will stop Hunt Traders who have their stop losses at the different lows which is indicated with a red circle.
For every buyer there must be a seller and for every seller there must be a buyer.Where they are no sellers in the market the institutions will want to trigger stop losses in order to buy,which is known as stop hunting.That is to takeout previous buyers in the market and generate liquidity to buy.
And this stop hunting usually happens in a ranging market.
Looking at the structure of gold we can see that gold is ranging,
We can see a low or support of the range which was previously resistance and turned support for the ranging market.
I see the market using sell liquidity to liquidate buyers and react at the support or low of the range and move up to the range of the resistance

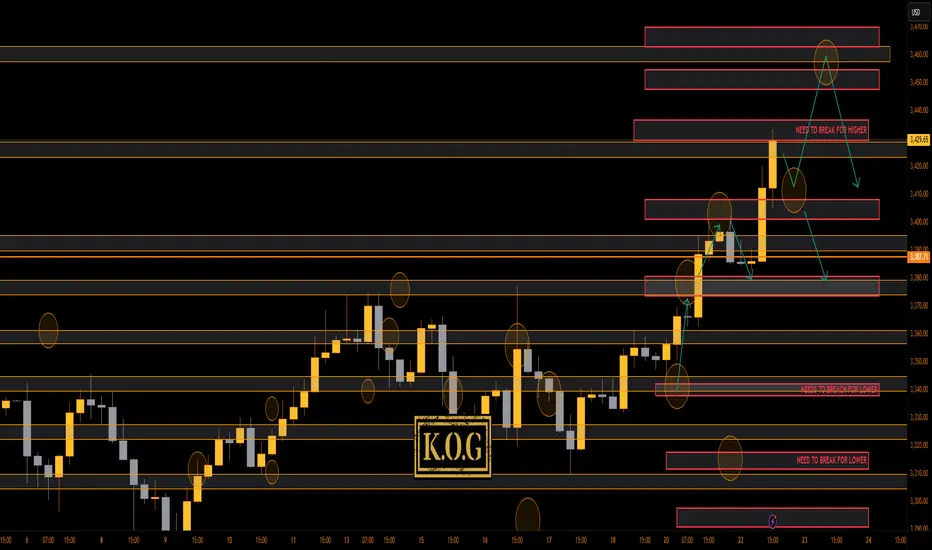
THE KOG REPORT - UpdateA rare day for us today even though we got the level for the short from above, we activated again, and due to everything lining up confirming the short into the lower order region where we wanted to bounce, we took it. Gold, had other plans, engulfing upside resulting in us having to SL the trade. It then went on to break above and complete our daily targets.
You win some, you lose some!
Now, we have support below at the 3410 region which will need to break to change short-term structure, while there is the order region above 3430-35 which could hold price and accumulate. All our bullish targets for the day are completed, we just wanted lower to then go higher.
If lower support can be targeted and held, we could see a move higher into the 3345-50 region before then a reaction in price. I'm still not happy with this move, something doesn't quite look right, so let's play it day by day.
RED BOXES:
Break above 3395 for 3404✅, 3410✅ and 3420✅ in extension of the move
Break below 3375 for 3368 and 3355 in extension of the move
As always, trade safe.
KOG
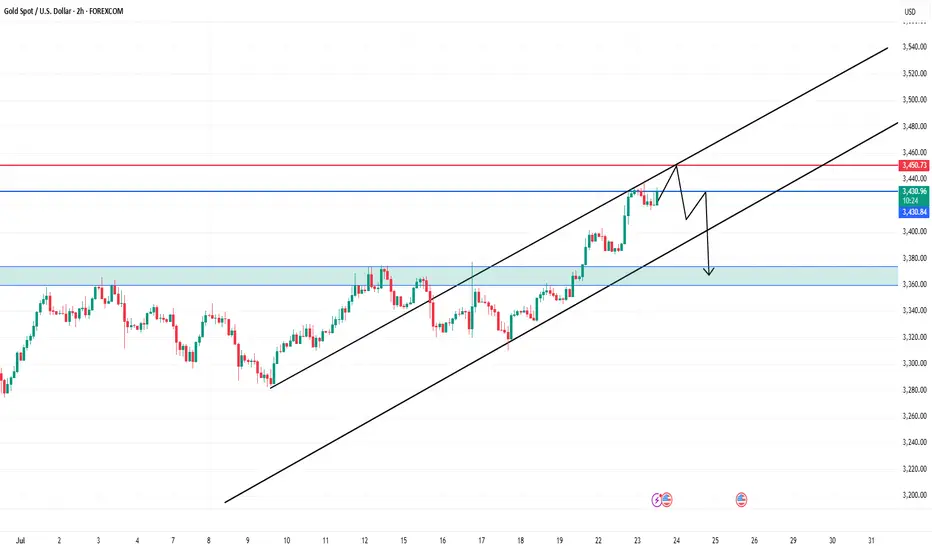
Gold at Key Resistance – Bearish Pullback Ahead?Technical Analysis (2H Chart)
1. Trend Structure:
Price is moving in a clear ascending channel (black trend lines).
Currently testing the upper boundary of the channel, which may act as resistance.
2. Resistance Zones:
$3,431–$3,450: Strong resistance zone.
Horizontal resistance at $3,450.73 (marked in red).
Price may form a lower high before reversal, as the black arrow suggests.
3. Support Zones:
$3,374 – $3,360: Previous structure and demand zone (highlighted green).
Strong potential bounce zone if price drops.
4. Price Action Expectation:
Possible fakeout or retest near $3,450 → followed by a rejection and drop toward the $3,360 area.
Bearish bias indicated by the projected path.
Daily gold analysisDaily gold analysis
Sell trade with target and stop loss as shown in the chart
The trend is down and we may see more drop in the coming period in the medium term
All the best, I hope for your participation in the analysis, and for any inquiries, please send in the comments.
He gave a signal from the strongest areas of entry, special recommendations, with a success rate of 95%, for any inquiry or request for analysis, contact me

GOLD BUY TRADE IDEA • Price Action Context:
• Recent bearish leg shows a clear shift from premium to discount territory.
• Market is approaching a higher timeframe demand zone around $3,277 – $3,299 (highlighted red zone).
• Notable inducement below recent lows suggests engineered liquidity to fuel a potential reversal.
• Current Market Structure:
• After a deep retracement, price is expected to tap into the discount zone, where institutional buy orders may be resting.
• Anticipated bullish reaction following a liquidity sweep of the lows and demand mitigation.
• Smart Money Flow:
• Inducement ➝ Liquidity Grab ➝ Demand Tap ➝ Bullish Reaction setup in play.
• Internal structure likely to shift bullish after a sweep, potentially forming a higher low and aiming for a BOS (Break of Structure) on the upside.
• Upside Target:
• Short-term target area: $3,360 – $3,380.
• Possible continuation toward premium if internal structure confirms strength.
🧠 Smart Money Narrative:
1. Induced sell-off below structure for liquidity collection.
2. Approaching major POI (Point of Interest) in discount.
3. Anticipated entry point for institutions to buy gold at value.
4. Reversal expected toward premium imbalance areas.

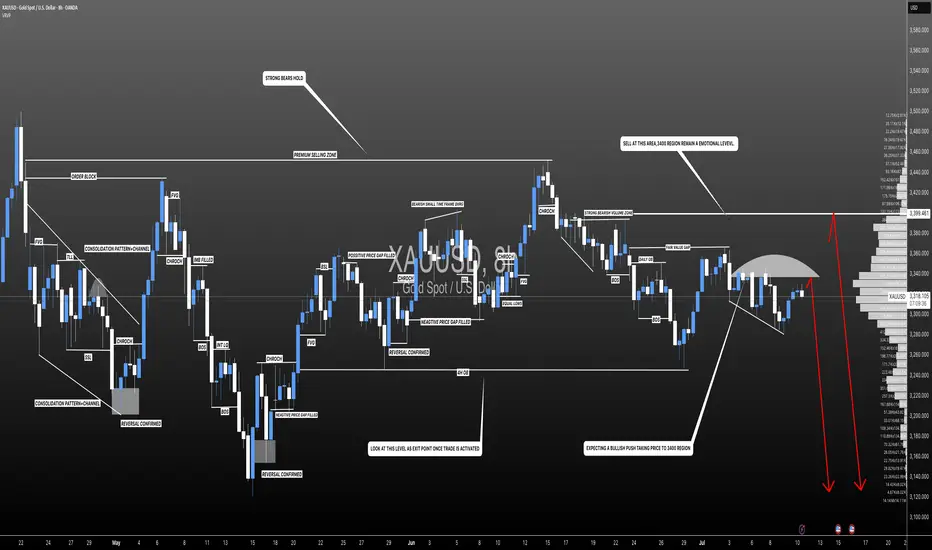
Gold – Bear-to-Bull Transition in Motion?🧠 MJTrading:
TVC:GOLD – 8H Chart: Bulls, It’s Your Move.
📸 Viewing Tip:
🛠️ Some layout elements may shift depending on your screen size.
🔗 View the fixed high-resolution chart here:
The impulsive move from 3000 to 3500 wasn’t just a trend — it was a statement of strength.
That rally carved the ATH, then left behind weeks of digestion and structural compression.
Now, the market may be setting up for its next decision.
Notice how each bearish leg has been shrinking — a classic behavioral signal that sellers are losing momentum — possibly a shift in control underway.
We’re also pressing above the downtrend line from the ATH (3500), while the uptrend from 3000 remains clean and respected.
We’re now testing the 3400 zone — a key battleground.
📍 If bulls want to reclaim the momentum and show dominance, this is the moment to act.
🔹 1st Support: 3363–3377
🔹 2nd Support: Rising trendline
🎯 Target Zone: 3455–3500+ (Liquidity Pool & ATH proximity)
⚠️ Break back inside the triangle could delay the breakout narrative.
⚠️ If momentum fails to increase from here, and bulls can’t break out with conviction, the market is likely to remain range-bound for longer — extending the sideways phase between 3250–3500.
💭 If you’re watching for a new ATH… stay sharp, stay structured — the market rewards patience and readiness.
“If the structure speaks to you, let it echo, boost it.”
📐 MJTrading 🚀
What do you think?
#GoldAnalysis #XAUUSD #MarketStructure #LiquiditySweep #AnythingCanHappen
#MJTrading
#ChartDesigner
Psychology Always Matters:
Click on them for the caption...

Bullish continuation?The Gold (XAU/USD) is falling towards the pivot and could bounce to the 1st resistance.
Pivot: 3,390.13
1st Support: 3,356.66
1st Resistance: 3,491.05
Risk Warning:
Trading Forex and CFDs carries a high level of risk to your capital and you should only trade with money you can afford to lose. Trading Forex and CFDs may not be suitable for all investors, so please ensure that you fully understand the risks involved and seek independent advice if necessary.
Disclaimer:
The above opinions given constitute general market commentary, and do not constitute the opinion or advice of IC Markets or any form of personal or investment advice.
Any opinions, news, research, analyses, prices, other information, or links to third-party sites contained on this website are provided on an "as-is" basis, are intended only to be informative, is not an advice nor a recommendation, nor research, or a record of our trading prices, or an offer of, or solicitation for a transaction in any financial instrument and thus should not be treated as such. The information provided does not involve any specific investment objectives, financial situation and needs of any specific person who may receive it. Please be aware, that past performance is not a reliable indicator of future performance and/or results. Past Performance or Forward-looking scenarios based upon the reasonable beliefs of the third-party provider are not a guarantee of future performance. Actual results may differ materially from those anticipated in forward-looking or past performance statements. IC Markets makes no representation or warranty and assumes no liability as to the accuracy or completeness of the information provided, nor any loss arising from any investment based on a recommendation, forecast or any information supplied by any third-party.

$XAUUSD: Macro InterconnectionsResearch Notes
Linking historic surface area and coordinates of consistent geometric expressions to document and learn more about the "texture" of self-organizing processes. The topology assumes that current price is a result of all history together that took to make the price end up where it is.
The fastest shortcut to figure out fractal hierarchy of waves and general direction is through Fractal wave marker .
Since angle of highs cycle is broken and price stayed above it for long time. That means it would be better to strip the chart starting from the lower levels, in order to get better coordinates for structural basis.
FWM helps to spot that distinctive part of broken waves that enables visual orientation in the rhythm. They manifest in its closest formative across cycles.
The angle that links the pattern through the time can have deterministic property, therefore we can use that direction for fibonacci channels to fill the gaps.
The fact that on log scale the bits from bullish phase of cycles contracted on price scale, I'd orientate with thin fibonacci channels (that is based on angle of lows of macro-cycle applied to previous ATH.
There are some other interconnection that are being tested.

It still looks like a Triangle on goldHi traders,
Last week gold made an impulsive wave up but after that it dropped very hard.
If gold is still in a Triangle we could see a correction up and one more move down for wave E. But if price closes below (orange) wave C then the pattern is changed.
Let's see what price does and react.
Trade idea: Wait for the pattern to finish. Then wait for an impulsive move up and a small correction down on a lower timeframe and a change in orderflow to bullish to trade longs.
NOTE: The next three weeks I'm on holiday so I will not post any outlooks publicly.
If you want to learn more about trading FVG's & liquidity sweeps with wave analysis, please make sure to follow me.
This shared post is only my point of view on what could be the next move in this pair based on my technical analysis.
Don't be emotional, just trade your plan!
Eduwave

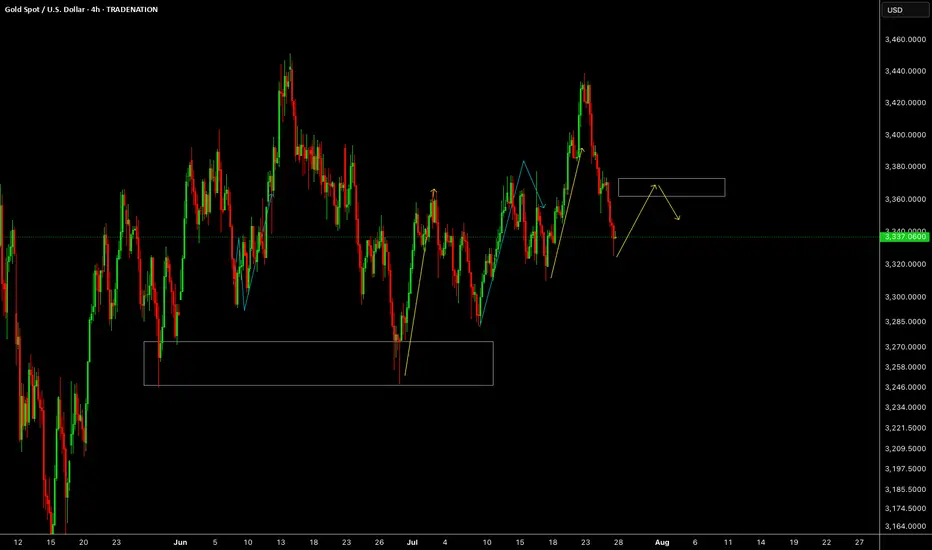
GOLDGOLD looks like it will be giving us correction or impulse up early part of this week. Reaction will be above 3360.
Disclosure: We are part of Trade Nation's Influencer program and receive a monthly fee for using their TradingView charts in our analysis.
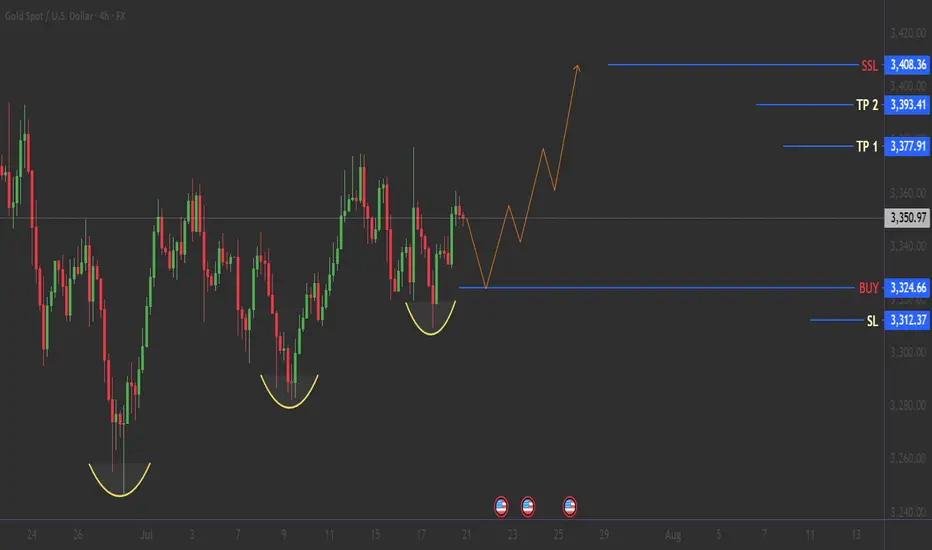
GOLD: Bullish Reversal Pattern Activated! 21/07/2025THE GOLDEN SETUP: Triple Bottom Masterpiece :
🟢 BULLISH BREAKOUT SETUP
🎯 BUY ZONE: $3,324 (Neckline Break)
🚀 TP1: $3,377
🚀 TP2: $3,393
🚀 LAST TP : $3,408
Stop Loss: $3,312 (Below recent low) 🚨
🌟 Before You Trade:
✅Wait for neckline break ($3,325+)🔥
✅Confirm with volume surge
✅Set stop loss below pattern ($3,312)
✅Calculate position size (max 2% risk)
--------------- N O T E ----------------
🚨 RISK MANAGEMENT 💡DYOR
Follow for more high-probability setups! 📊✨

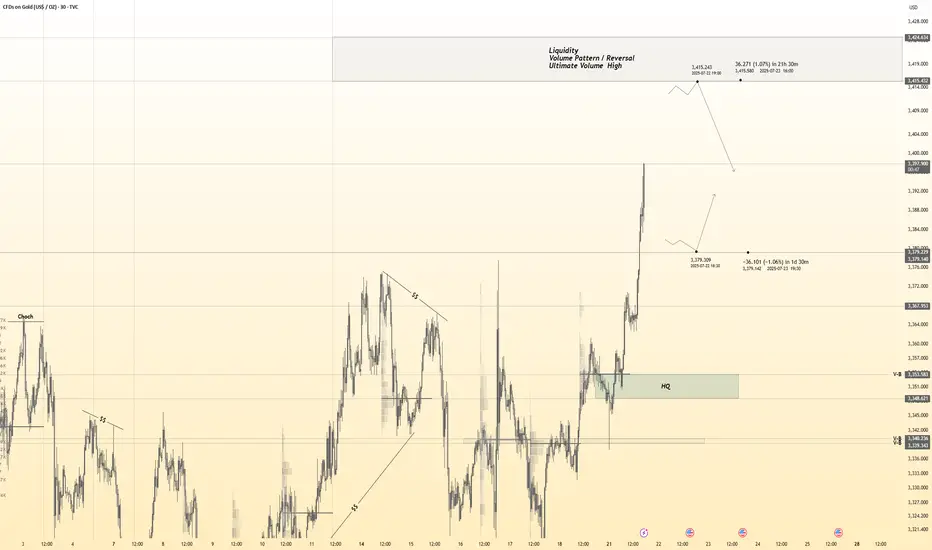
Gold 30Min Engaged ( Bullish & Bearish Reversal Entry Detected )————-
➕ Objective: Precision Volume Execution
Time Frame: 30-Minute Warfare
Entry Protocol: Only after volume-verified breakout
🩸 Accurate Bullish Reversal : 3380
🩸 Accurate Bearish Reversal : 3314.5
➗ Hanzo Protocol: Volume-Tiered Entry Authority
➕ Zone Activated: Dynamic market pressure detected.
The level isn’t just price — it’s a memory of where they moved size.
Volume is rising beneath the surface — not noise, but preparation.
🔥 Tactical Note:
We wait for the energy signature — when volume betrays intention.
The trap gets set. The weak follow. We execute.
XAUUSD:Swing Sell Is Highly Likely! Get ReadyWe expect a smooth drop in gold prices, with prices potentially dropping around the 3250 area. Use Accurate Risk Management.
Please like and comment!
Team Setupsfx_
XAUUSD long day trade idea hello
day trading idea long up to 3372-3383 price zone
fibonaci levels , maybe 3390

July 29, 2025 - XAUUSD GOLD Analysis and Potential OpportunitySummary:
The downtrend continues, but a technical rebound is possible today.
Keep a close eye on the 3310 level — if price holds, bulls may fight back and we look for long setups on pullbacks.
If 3310 is broken, the bearish momentum is likely to extend, and we shift to selling on failed rallies. The next significant support lies at 3283.
🔍 Key Levels to Watch:
• 3384 – Resistance
• 3375 – Key resistance
• 3365 – Resistance
• 3345 – Resistance
• 3320–3325 – Key resistance zone
• 3310 – Critical support
• 3300 – Psychological level
• 3283 – Major support
• 3275 – Support
• 3265 – Support
📈 Intraday Strategy:
• SELL if price breaks below 3310 → target 3305, then 3300, 3290, 3283
• BUY if price holds above 3320 → target 3325, then 3336, 3345, 3350
👉 If you find this helpful or traded using this plan, a like would mean a lot and keep me motivated. Thanks for the support!
Disclaimer: This is my personal view, not financial advice. Always use proper risk control.
Analysis for the next week (XAUUSD) Hello Traders, Happy Weekend.
The market is going to open tonight, As you see the down trend is running, the price is falling like a waterfall.
Now the market is on the support area according to H1 & H4 TimeFrame.
The market is respecting the support area and there is a Trend line support according to D1 TimeFrame.
The market is respecting the Trend line and support area.
According to my analysis gold will drop till 3287 to 3271.
If gold fly, it can fly till 3350 then it will fall.
Stay tune for update.
Kindly share your views and leave positive comments here, Thanks.

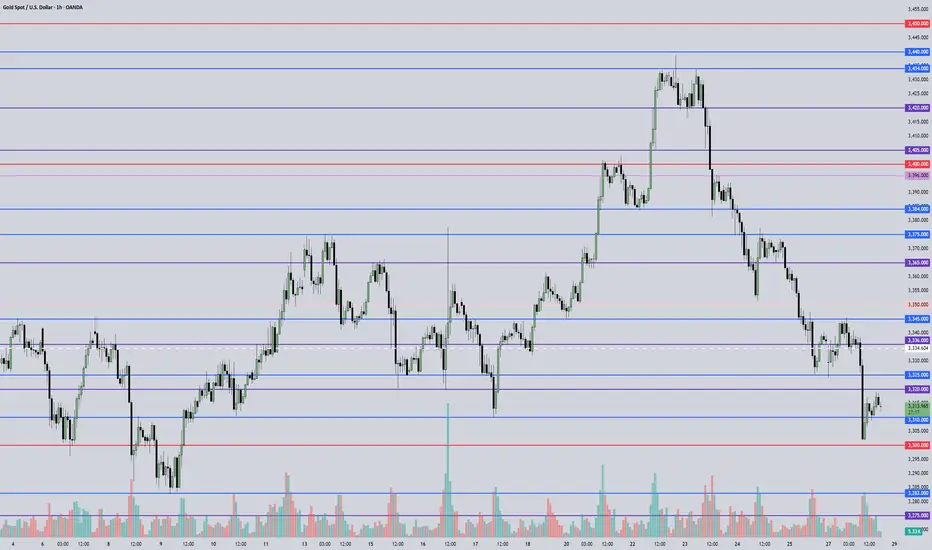
Is Smart Money Selling Gold? A VSA LookHey Traders,
Let's take a look at the Gold (XAU/USD) 1-hour chart using Volume Spread Analysis (VSA). The price made a strong run-up to a new high around $3,438, but the volume is telling us a story of potential weakness.
Here’s a simple breakdown of what I'm seeing.
The Trap at the Top (Signs of Weakness)
Think of the market as being moved by "smart money" (professionals) and "herd money" (the crowd).
Climax Volume: See that huge volume spike right at the peak on July 23rd? While it looks like strong buying, this is often a classic sign of a Buying Climax. This is where smart money starts selling their positions to the excited crowd who are buying at the top, fearing they'll miss out.
No Real Buyers Left: After the peak, notice how the price tried to push higher a few times but on much lower volume? This is a "No Demand" signal. It’s like a car trying to rev its engine, but it's out of gas. It shows there isn't enough buying power to push the price any higher.
Sellers Take Control: As the price started to fall from the top, look at the volume on the down bars. It got bigger. This tells us that supply (selling pressure) is now in control, and they are pushing the price down with force.
Where Are We Now?
The price has dropped and is now hovering around the $3,330 area. The volume has dried up for now, which means the market is taking a pause and deciding where to go next.
What to Watch For Next
Based on the VSA story, here are two possible scenarios:
Scenario 1 (Bearish 📉): The weakness continues. If we see the price try to rally from here but the volume is very low, it would be another major red flag. It would suggest sellers are still in control, and we could see a break below the recent low of $3,320 for another leg down.
Scenario 2 (Bullish 📈): This is a bear trap. For this to happen, we would need to see a strong sign of buying returning. For example, a sharp drop on massive volume that is quickly bought back up. This would signal that the sellers have been absorbed and smart money is starting to buy again.
Conclusion:
For now, the evidence points more towards weakness. The action at the top suggests that smart money was distributing (selling) their gold.
Key Takeaway: Be cautious of any weak-looking bounces. The sellers appear to have the upper hand until we see a clear sign of strength with high buying volume.
This is not financial advice. This is just my interpretation of the chart using VSA. Always do your own research and manage your risk. Good luck trading!
