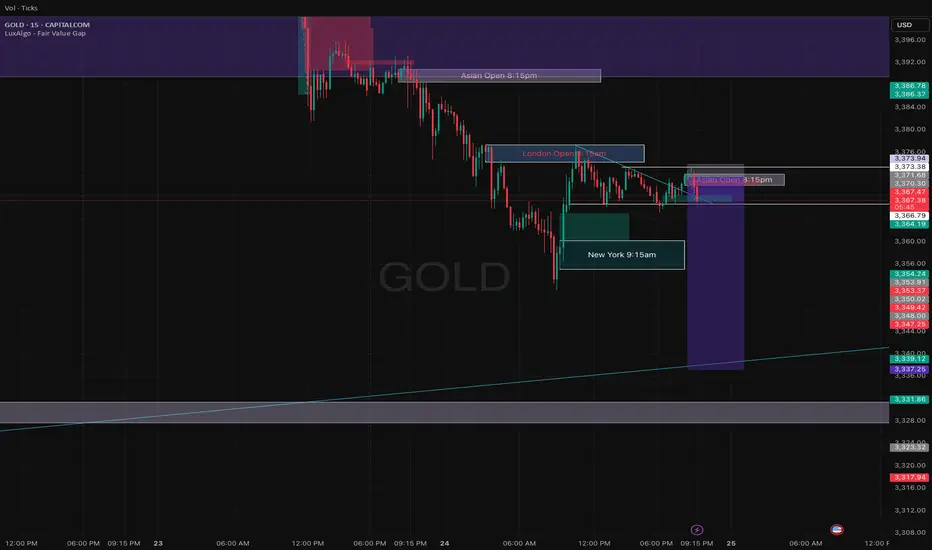
Institutional Footprint Detected Gold Hits FVG + Breaker Block.GOLD has now entered a significant confluence zone, aligning with both a bullish Fair Value Gap (FVG) and a breaker block areas commonly respected by institutional algorithms. In the process, it has also swept sell-side liquidity resting below recent lows, which often serves as fuel for a reversal. This combination of technical factors suggests a high-probability scenario for a bullish bounce from this region.
Traders should closely monitor price behavior around the marked Equal Relative Liquidity (ERL) zone for additional confirmation before executing any trades.
Always conduct your own analysis (DYOR) and manage risk accordingly.
XAUUSDG trade ideas

XAU/USD | Get Ready for Another Bullrun, $3500 is Coming!By analyzing the gold chart on the 4-hour timeframe, we can see that on Friday, the price finally closed at $3350. After the market opened today, we saw an initial correction down to $3339 (exactly as expected), followed by another strong bullish wave, pushing gold above $3400 just moments ago. If the price stabilizes below $3398 within the next 4 hours, I expect a potential rejection toward $3388 and $3377. However, if gold holds above $3400, the next target will be $3409. Key demand zones are $3365–$3375, and levels $3355, $3344, and $3336.
Please support me with your likes and comments to motivate me to share more analysis with you and share your opinion about the possible trend of this chart with me !
Best Regards , Arman Shaban

Monday market forecast and analysis ideas#XAUUSD
There will be a lot of data next week, such as the 8.1 tariff deadline that I have repeatedly emphasized, the Federal Reserve decision, NFP data, etc. It can be said that it is relatively difficult to analyze purely from a technical perspective, because there is uncertainty in many data, the data results are often non-linearly correlated with market reactions (good news does not necessarily lead to a rise, and bad news does not necessarily lead to a fall), and large fluctuations can easily form oscillating K-lines with long upper and lower shadows. Therefore, the first arrangement for next week is to participate in trading with a light position and avoid letting emotions control your thinking.
The closing price on Friday was near 3337, proving that the short-term judgment on the rebound momentum of gold is correct, so there are two possible situations on Monday.
1. The first thing we need to pay attention to is 3345-3350 to determine whether it constitutes a short-term pressure level. The weekly line closed with a negative cross star. Combined with the monthly line trend, in terms of support, focus on the trend line support near this week's low of 3325. If this position is not broken, the market is expected to usher in a wave of rebound; if it falls below 3325, the bottom may look to 3310 or even 3295 for support.
2. The rebound momentum of Friday continued on Monday, breaking through 3350 first, and then it is possible to reach the previous high resistance area of 3370-3380. If it encounters resistance here, gold will continue to fall and fluctuate, and the target may even be 3310. If the price remains strong and issues such as interest rate cuts and tariffs are imminent, it means that the short-term downward trend has ended and may even set a new high.
The above content is only a forecast for Monday’s market. It will be greatly affected by data and news, and may be adjusted in real time next week based on intraday trends. You can refer to this, but remember not to be swayed by emotions. We will participate with a light position, and the specific trading strategy can wait for my trading signal.

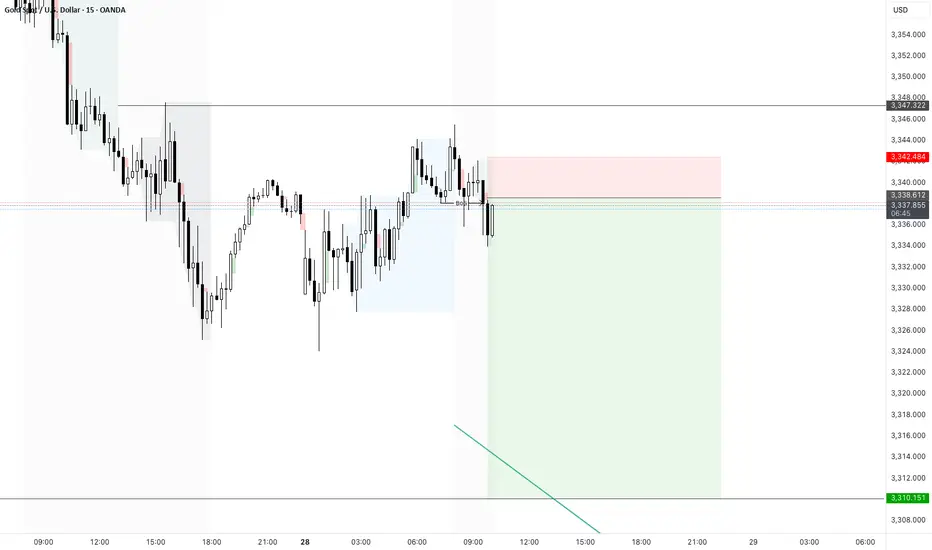
XAUUSD -28/5/25 - Day trade in bearish directionWatching DXY i noticed some string bullish momentum in the dollar.
As a result it looks like gold may have continued weakness today.
I see a pivot formed on the 15in and taking a bearish trade to the hight time frame liquidity equal levels below.
GOLD Possible Scenario Gold break the Major support but the price didnot pullback so aggressively and buyers have reduced looks like it will likely go down to 3300-3280 range. the major sell point will be 3355-3360.

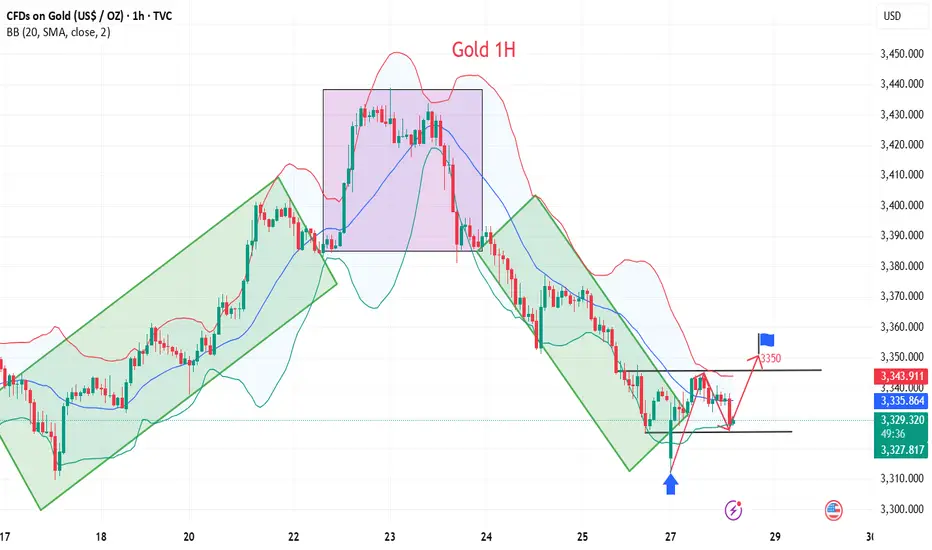
Gold short-term rise waiting for breakthrough
💡Message Strategy
During the Asian trading session, gold prices rebounded slightly from $3,320, filling the short gap at the start of the new week. As investors chose to stay on the sidelines before the Fed's two-day monetary policy meeting, the bullish force of the US dollar temporarily weakened, providing support for gold, an interest-free asset.
However, with the 15% tariff agreement between the United States and Europe and the positive progress of trade easing between the United States, Japan and the United States, market risk appetite has rebounded, weakening the appeal of gold as a safe-haven asset.
According to market surveys, "The current optimistic atmosphere of trade has weakened the safe-haven demand for gold, while the weakening of the US dollar has provided support for gold prices. The two forces offset each other, causing gold to fluctuate."
Investors are focusing on the FOMC meeting to be held on Tuesday. Although Trump continues to pressure the Fed to cut interest rates, the market generally expects that the interest rate will remain unchanged at this meeting because the US labor market remains strong.
In addition to the interest rate decision, this week will also usher in the US second quarter GDP estimate, PCE price index and non-farm payrolls report, all of which may have a significant impact on gold.
📊Technical aspects
From the technical trend, gold triggered a rapid correction after breaking below the lower edge of the short-term rising channel and the 50% Fibonacci retracement level last week. The current gold price stabilized in the $3,320 area and received some buying at the 61.8% Fibonacci support.
However, it is worth noting that the 200-period moving average on the 4-hour chart is at $3,350, which constitutes an important technical resistance for a short-term rebound. On the contrary, if gold breaks through the $3,350 level, gold will continue to develop a bullish pattern.
From the technical trend, gold triggered a rapid correction after falling below the lower edge of the short-term rising channel and the 50% Fibonacci retracement level last week. The current gold price stabilized in the $3,320 area and received some buying at the 61.8% Fibonacci support.
However, it is worth noting that the 200-period moving average on the 4-hour chart is at $3,350, which constitutes an important technical resistance for a short-term rebound.
On the contrary, if gold breaks through the $3,350 line, it will be expected to attack the $3,371-3,373 area in the short term, and further look to the key pressure levels of $3,400 and $3,440.
💰Strategy Package
Long Position:3320-3325,SL:3300,Target: 3350
XAUUSD 28/2/25 - Morning bullish pushBased on the 1hr- there is a break of structure and i am looking for a bullish move this morning.
There is a chance that this trade fails as there is a 4hr equal low liquidity below which could draw the price to.
Im still going to take this trade and let price do its thing today.

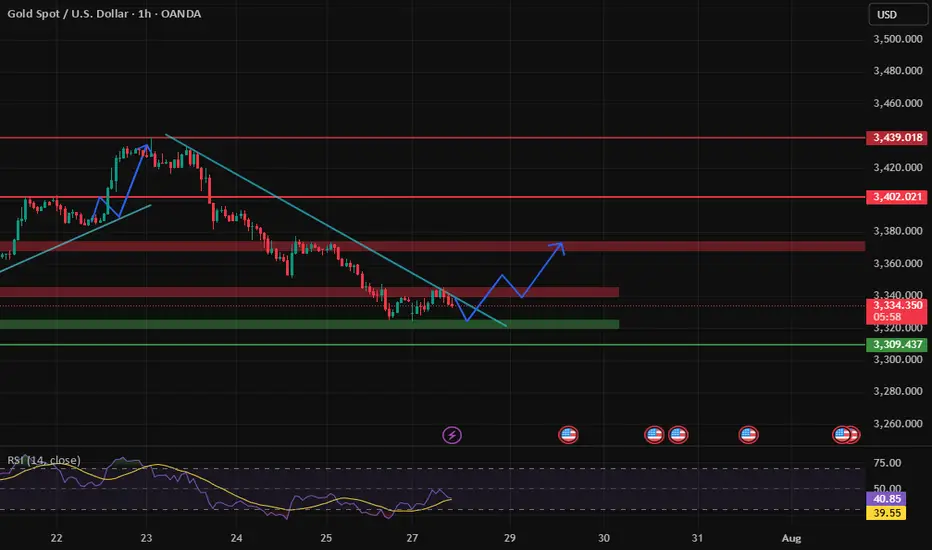
XAUUSD: Market analysis and strategy for July 24.Gold technical analysis:
Daily chart resistance 3440, support 3310
4-hour chart resistance 3390, support 3340
1-hour chart resistance 3375, support 3360.
Yesterday, according to news, the United States and the European Union were close to reaching a trade agreement, which led to the recent risk aversion sentiment to subside, and the bulls took profits. The gold price has fallen by nearly $80 from its peak.
From the current power comparison, the bears are temporarily dominant. Since yesterday, the candlestick chart of the 4-hour chart has completed 6 candles today (2 of which are sideways and 4 are falling sharply). It is expected that it will not rebound until today's NY market trading session.
Gold may reach 3359 or even 3340. At that time, we will observe the stabilization of the candlestick chart. Once the downward momentum is exhausted and it starts to close higher, we can buy. The upper pressure is 3380/3400.
Buy: 3359near
Buy: 3340near
Sell: 3380near
Sell: 3400near

Gold Continues Mild Uptrend – Watching for Reaction at $3351📊 Market Overview:
Gold maintained its bullish momentum during the Asian–European session, rising from $3330 to $3344. A slightly weaker USD and safe-haven demand supported prices. However, price is now approaching a key resistance zone, where technical rejection may occur in the U.S. session.
________________________________________
📉 Technical Analysis:
• Key near-term resistance: $3345 – $3351
• Stronger resistance (higher zone): $3360 – $3366 and $3374
• Nearest support: $3335 – $3332
• Stronger support (lower zone): $3322 – $3315
• EMA 09 (H1): Price is above EMA09 → confirms short-term uptrend
• Candlestick / Volume / Momentum:
• Price is consolidating in an ascending triangle
• A breakout above $3345 may target $3360+
• RSI remains below overbought; volume is stable → room for continuation
________________________________________
📌 Outlook:
If gold holds above $3335 and breaks above $3351, the uptrend could extend toward the $3366–$3374 zone. However, failure to break $3351 followed by a drop below $3332 could lead to a deeper pullback toward $3315.
💡 Recommended Trading Strategies:
BUY XAU/USD: $3318 – $3315
🎯 TP: 40/80/200 PIPS
❌ SL: $3321
SELL XAU/USD: $3360 – $3363
🎯 TP: 40/80/200 PIPS
❌ SL: $3357

Gold protracted consolidation The Gold remains in a bullish trend, with recent price action showing signs of a continuation breakout within the broader uptrend.
Support Zone: 3308 – a key level from previous consolidation. Price is currently testing or approaching this level.
A bullish rebound from 3308 would confirm ongoing upside momentum, with potential targets at:
3387 – initial resistance
3400 – psychological and structural level
3435 – extended resistance on the longer-term chart
Bearish Scenario:
A confirmed break and daily close below 3308 would weaken the bullish outlook and suggest deeper downside risk toward:
3290 – minor support
3268 – stronger support and potential demand zone
Outlook:
Bullish bias remains intact while the Gold holds above 3308. A sustained break below this level could shift momentum to the downside in the short term.
This communication is for informational purposes only and should not be viewed as any form of recommendation as to a particular course of action or as investment advice. It is not intended as an offer or solicitation for the purchase or sale of any financial instrument or as an official confirmation of any transaction. Opinions, estimates and assumptions expressed herein are made as of the date of this communication and are subject to change without notice. This communication has been prepared based upon information, including market prices, data and other information, believed to be reliable; however, Trade Nation does not warrant its completeness or accuracy. All market prices and market data contained in or attached to this communication are indicative and subject to change without notice.

XAUUSD and AUDUSD Analysis todayHello traders, this is a complete multiple timeframe analysis of this pair. We see could find significant trading opportunities as per analysis upon price action confirmation we may take this trade. Smash the like button if you find value in this analysis and drop a comment if you have any questions or let me know which pair to cover in my next analysis.

Gold. Bull Trap "triangle". 28/July/25XAUUSD, by checking gold latest speed of chart with its cycle. we might have a bull 'trap" triangle. A base for rallying to ATH again before a very deep pullback toward 233 Daily EMA which have not been "touched" for long time...

XAUUSD REBOUNDED FROM CURRENT TRENDLINE. WHAT'S NEXT?XAUUSD REBOUNDED FROM CURRENT TRENDLINE. WHAT'S NEXT?
Gold had successfully rebounded from the trendline, still showing mid-term bullish trend despite recent news on U.S. - E.U. and U.S. - Japan trade deals. Currently price is attempting to hold above the EMA20 on 1-h chart timeframe.
If this occurs and the asset develops another short-term bullish impulse, we may expect the price to reach 3,360.00 resistance level with further possible impulse towards 3,400.00 level.

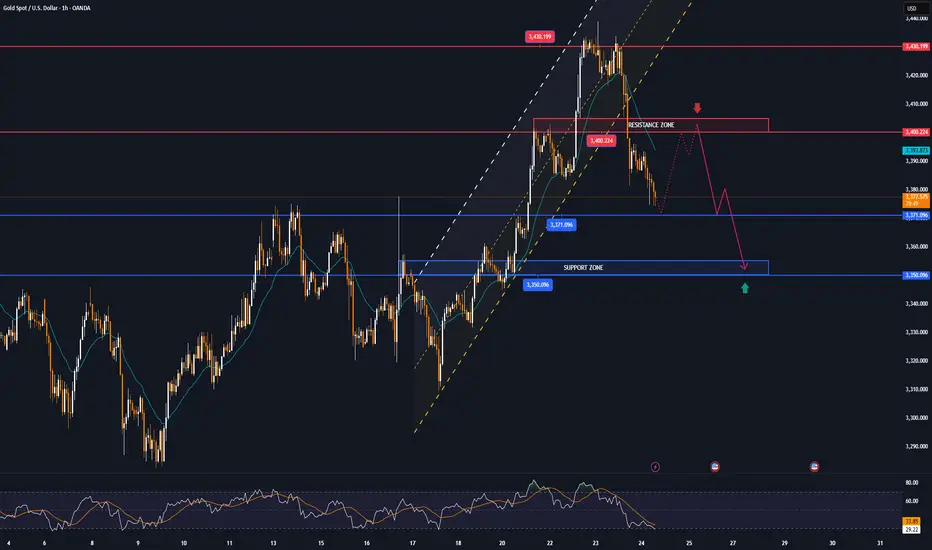
XAUUSD Outlook – From Bias to Execution Previous day closed bearish on XAUUSD, leading to a sell bias, On the 45M, I am looking out for possible entry and exit after a valid breakout of the bearish pennant, in line with my sell bias.

Elliott waveAccording to the bearish structure, the ABC wave is completed, there are 5 more bearish waves.
Sell 3334, stoplos 3344, tp 3310

XAUUSD - Scalping ideaPrice is stuck in a range between 3348.90 and 3324.87.
📌 Looking for a clean breakout to take action:
Buy above 3348.90 → Targeting 3354.09
Sell below 3324.87 → Targeting 3319.15
Not interested in any trades inside the range only jumping in once we break out and close outside either level. Waiting for confirmation to avoid getting chopped up.
Let’s see where it goes. 📉📈
No rush, just reacting.

From 3,430 USD GOLD falls below 3,400 USD on optimistic newsOANDA:XAUUSD has suffered a sharp sell-off after rising sharply earlier in the week. Media reports said the United States and the European Union were getting closer to reaching a tariff deal, and the news weighed on safe-haven demand.
OANDA:XAUUSD fell below $3,400 an ounce on Wednesday, down more than 1.2%, following news that the United States and the European Union were close to signing a deal similar to the one Washington and Tokyo signed on Tuesday. It is now trading below that key base point.
The European Union and the United States are moving toward a trade deal that could see more EU goods hit with a 15 percent U.S. import tariff, two diplomats said. Earlier, U.S. President Donald Trump reached a trade deal with Japan that would cut auto tariffs to 15 percent.
Optimism about an imminent U.S.-EU trade deal overshadowed a decline in the U.S. dollar. The U.S. dollar index (DXY), which measures the greenback against a basket of six currencies, fell 0.05 percent on the day to 97.160.
U.S. Treasury yields rose, with the 10-year Treasury yield rising to 4.396%. U.S. real yields, calculated by subtracting inflation expectations from nominal yields, rose nearly 4 basis points to 1.994%.
Gold tends to gain in value during times of uncertainty and low-interest-rate environments because gold itself does not generate interest, and in low-interest-rate environments, the opportunity cost of holding gold is relatively low.
U.S., EU near trade deal
The Financial Times reported on Wednesday that the European Union and the United States are close to reaching a trade deal that would impose a 15% tariff on imports from Europe, similar to the one reached between US President Donald Trump and Japan this week.
The Financial Times reported that Brussels is likely to agree to so-called “reciprocal tariffs” to avoid tariffs that Trump has threatened to impose on EU goods of up to 30% from August 1.
“The agreement reached with Japan is clearly extortionate in terms. Most member states are swallowing their anger and are likely to accept the deal,” an EU diplomat said.
The two sides will exempt some products, including aircraft, spirits and medical equipment, from tariffs.
The agreement between the US and Japan has also left Brussels reluctant to accept higher reciprocal tariffs to avoid a damaging trade war, according to the Financial Times.
Technical Outlook Analysis OANDA:XAUUSD
On the daily chart, after gold reached its target at $3,430, it failed to break above this important resistance level and fell slightly. The decline brought gold back to test the support confluence area, which is the location of the 0.236% Fibonacci retracement with the lower edge of the price channel. And with the current position, gold still technically has enough conditions for a possible increase in price.
Specifically, gold is still in/above the supports from the short-term price channel, the long-term rising price channel and the support from the EMA21, as long as gold is still trading above the EMA21, it still has a bullish outlook in the short term. On the other hand, the short-term target is still at 3,430 USD, while once the 3,430 USD level is broken, it will provide the possibility of further upside with the next target at around 3,450 USD in the short term, more than the all-time high.
RSI remains above 50, far from the 80 – 100 area (overbought area). Showing that there is still a lot of room for upside ahead.
During the day, the technical outlook for gold prices continues to favor upside and notable positions will be listed as follows.
Support: 3,371 – 3,350 USD
Resistance: 3,400 – 3,430 – 3,450 USD
SELL XAUUSD PRICE 3421 - 3419⚡️
↠↠ Stop Loss 3425
→Take Profit 1 3413
↨
→Take Profit 2 3407
BUY XAUUSD PRICE 3354 - 3356⚡️
↠↠ Stop Loss 3350
→Take Profit 1 3362
↨
→Take Profit 2 3368
Gold under pressure as USD strengthensGold is facing significant selling pressure as the US dollar regains momentum. Currently, XAU/USD is trading near $3,337, down over $31 from the session high, and pressing directly against the ascending trendline.
The stronger USD is making gold—an asset that yields no interest—less attractive to investors. If this dollar strength continues, the likelihood of a trendline break and further downside is very high.
On the economic front, U.S. jobless claims have fallen to their lowest level in three months, signaling a resilient labor market despite sluggish hiring. This stable jobs data is expected to support the Fed’s decision to hold interest rates steady at 4.25–4.50% in the upcoming policy meeting, even amid rising inflation pressure driven by President Donald Trump’s tariff policies.
At this moment, sellers are in control. Traders should closely watch upcoming support zones and trading volume to spot reasonable entry points.
Good luck!

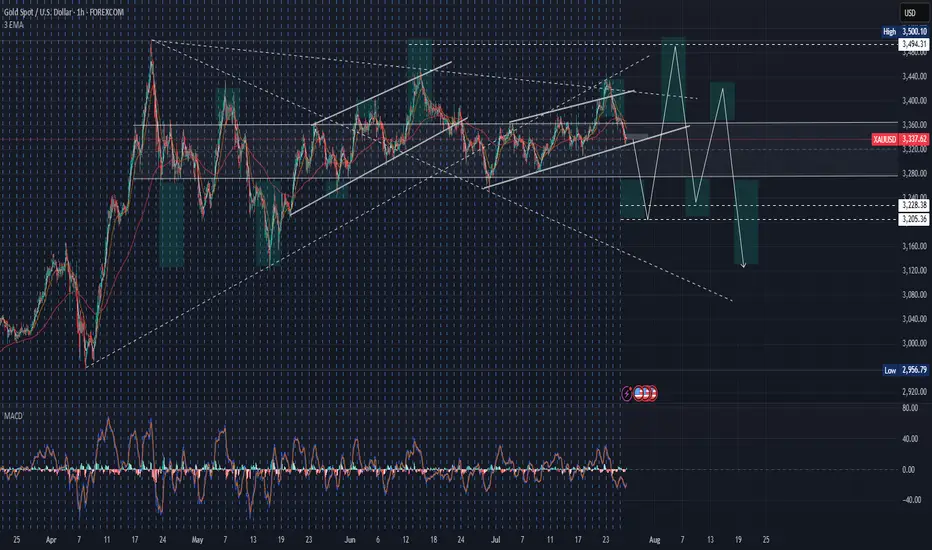
XAUUSD 4H Has Finished Triangle Pattern #elliotwaveXAUUSD has finished its ABCDE correction in triangle pattern. Price will soon to test the previous $3,500 all time high area. It will required some big news as fundamental to boost the gold price up.
At the time this idea published, price still making lower low and lower high which is the downtrend pattern, but I believe it will soon break the structure and see higher high and higher low as the uptrend confirmation.

Gold Outlook for Today Todays outlook for Gold - I really cant share my strategy, if you want it, just send me a message and I will, It very simple, I think trading is simple, we just over think and complicate things
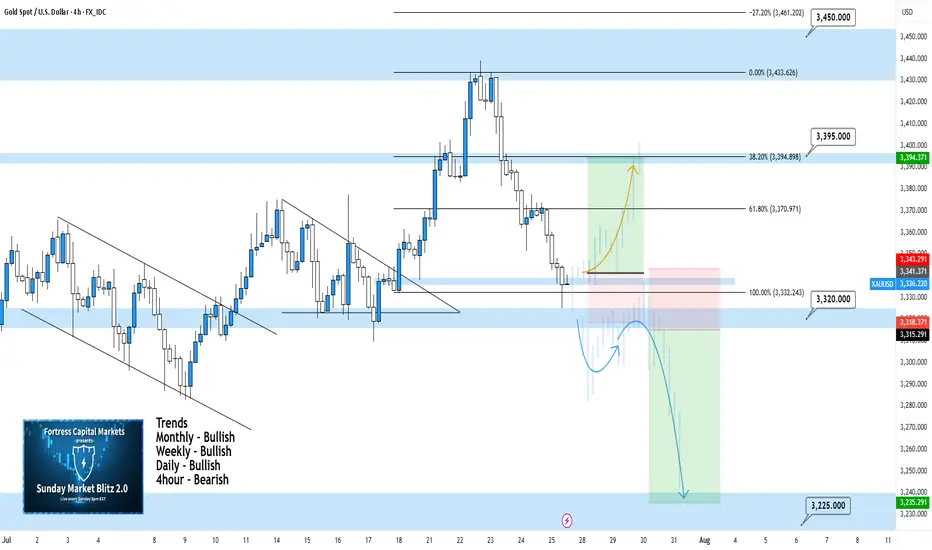
XAUUSD 4Hour TF - July 27th, 2025XAUUSD 7/27/2025
XAUUSD 4 hour Neutral Idea
Monthly - Bullish
Weekly - Bullish
Daily - Bullish
4hour - Bearish
Last week we saw a perfect setup playout and then it retraced 100% to close out the week. This is looking more bearish on the 4Hour timeframe now but we need to see how price action reacts at the 3,320 support zone first.
Here are two potential scenarios we want to see for the week ahead.
Bullish Reversal - If we are to see gold as bullish again we would ideally like to see some consolidation at the current level followed by strong bullish conviction.
We need to see convincing price action before we can begin targeting higher. Consolidation + Bullish conviction will be our best chance at a long position.
Bearish Continuation - The 4hour sure looks bearish but will it sustain? Looking ahead into the week we want to see price action push below 3,320 with bearish structure below.
I would also like to see a pattern or a few hours to a day of consolidation below 3,320. If this happens we can begin to target lower toward major support levels like 3,225.