GOLD ROUTE MAP UPDATEHey Everyone,
Please see update on our 1H chart route map.
Gold continued its bearish momentum into today, hitting our bearish target at 3238, while leaving the 3348 bullish gap still open.
After a break below 3328, price followed through and hit 3305, entering our key retracement range, which gave the bounce to manage any premature positions on the top. We’re now watching closely for a reaction at this level.
A clean EMA5 cross and lock below 3305 will open the path toward the swing range.
However, failure to lock below this level could trigger a bounce from here.
This is a pivotal area for the next directional move.
We will keep the above in mind when taking buys from dips. Our updated levels and weighted levels will allow us to track the movement down and then catch bounces up.
We will continue to buy dips using our support levels taking 20 to 40 pips. As stated before each of our level structures give 20 to 40 pip bounces, which is enough for a nice entry and exit. If you back test the levels we shared every week for the past 24 months, you can see how effectively they were used to trade with or against short/mid term swings and trends.
The swing range give bigger bounces then our weighted levels that's the difference between weighted levels and swing ranges.
BULLISH TARGET
3348
EMA5 CROSS AND LOCK ABOVE 3348 WILL OPEN THE FOLLOWING BULLISH TARGETS
3369
EMA5 CROSS AND LOCK ABOVE 3369 WILL OPEN THE FOLLOWING BULLISH TARGET
3397
EMA5 CROSS AND LOCK ABOVE 3397 WILL OPEN THE FOLLOWING BULLISH TARGET
3422
BEARISH TARGETS
3328 - DONE
EMA5 CROSS AND LOCK BELOW 3328 WILL OPEN THE FOLLOWING BEARISH TARGET
3305 - DONE
EMA5 CROSS AND LOCK BELOW 3305 WILL OPEN THE SWING RANGE
3289
3267
As always, we will keep you all updated with regular updates throughout the week and how we manage the active ideas and setups. Thank you all for your likes, comments and follows, we really appreciate it!
Mr Gold
GoldViewFX
XAUUSDG trade ideas

Gold (XAU/USD) 1H Chart – Trendline Support and Upside TargetGold price is trading above the support trendline around 3,287. A bounce from this level could drive price toward the 3,313 resistance and potentially the 3,333 target. Maintaining support above 3,287 is key for the bullish outlook.

DeGRAM | GOLD broke the rising channel📊 Technical Analysis
● XAU printed a false break above the 3 400 wedge roof, then sliced back through the rising mid-channel, closing under the wedge base at 3 309 - a classic bull-trap that flips that band into resistance.
● Momentum has rolled over, and the break of July’s micro up-trend opens room to the broad triangle floor/May trend-pivot near 3 246; successive lower-highs since 24 Jul confirm bearish control.
💡 Fundamental Analysis
● Hot US Q2-GDP and sticky core-PCE lifted 2-yr yields to one-month highs, reviving the dollar bid, while cautious ECB guidance tempers euro gold demand.
✨ Summary
Sell 3 309-3 335; hold below 3 309 targets 3 246 ▶ 3 200. Invalidate on an H4 close above 3 366.
-------------------
Share your opinion in the comments and support the idea with a like. Thanks for your support!

Gold Eyes Rebound Toward $3,438 TargetGold (XAU/USD) is trading near $3,314, approaching support along the rising trend line. A potential bounce could target the $3,438 resistance area, as marked in the chart.

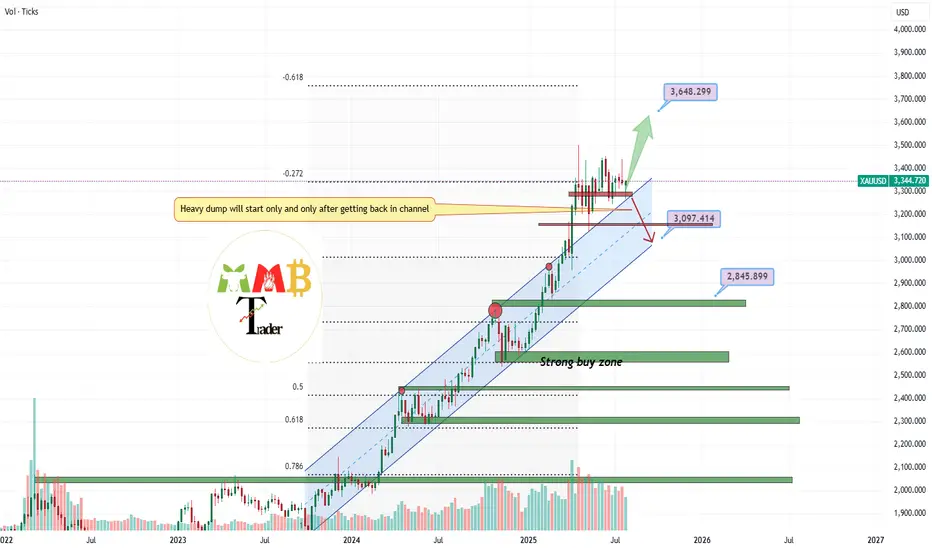
GOLD channel breakout retest complete more pump ahead As we can see the blue channel resistance is gone and also now it turn to strong and valid support and retest is also complete and gold is now targeting 3600$ easy.
DISCLAIMER: ((trade based on your own decision))
<<press like👍 if you enjoy💚
XAU/USD Buy Setup 1H Analysis Trendline breakout.Instrument: Gold Spot / USD
Timeframe: 1H (1 Hour)
Chart Tools Used:
Ichimoku Cloud
Trendline breakout
Target projection (highlighted in blue arrow and price levels)
Volume not shown directly but momentum is clear from breakout
---
💹 Buy Setup Analysis
✳ Current Price: $3,362.895
🔼 Entry (Buy): Around $3,363.590 (as marked on the chart)
🎯 Targets:
Target Number Price Level Approx Gain % Move
1st Target $3,393.481 ~$30 ~0.89%
2nd Target $3,433.864 ~$70 ~2.06%
🔻 Stop-Loss (Suggested): Below Ichimoku Cloud, ideally near $3,315.860 or $3,322.672
---
🧠 Strategy Logic
The chart shows a clean bullish breakout of the trendline and Ichimoku cloud.
Strong upward momentum candle confirms the breakout.
Targets are based on measured move and previous resistance zones.
Volume and sentiment look bullish, aligning with the breakout.
A pullback to the breakout zone (~$3,340–$3,350) would be healthy for re-entry.
---
📝 Summary of Buy Setup
Parameter Value
Entry $3,363.590
Target 1 $3,393.481
Target 2 $3,433.864
Stop-Loss $3,322.672–$3,315.860 (zone below cloud)
Risk-Reward ~2:1 to 3:1 based on SL/TP choice

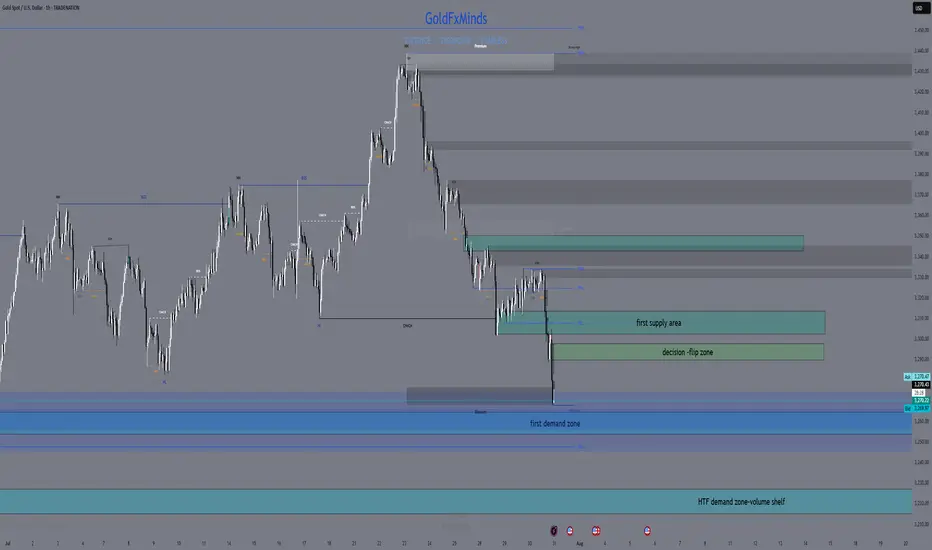
XAUUSD Market Update – July 30 Late NY Recap🔸Macro Context
Markets are still digesting Powell’s ongoing speech with no clear pivot signals. While FOMC tone remained cautious, no dovish surprise emerged. Trump’s upcoming comments keep geopolitical risks elevated. USD remains firm. Gold is reacting within key HTF demand as intraday volatility cools off.
🔸Bias Overview
Weekly Bias:
• Bearish rejection from the major supply wick 3439–3350
• Structure still below 3345, maintaining downside pressure
• Weekly RSI cooling off — no bullish divergence yet
Daily Bias:
• Lower high locked below 3345
• Price reentered the imbalance toward 3272
• Clean structure remains bearish unless we reclaim 3302
H4 Bias:
• Lower high formed at 3314
• Current price testing HTF Extreme Demand Base (3289–3272)
• Still bearish unless we see a confirmed M15 or H1 BOS from demand
🔸Key Structural Zones
🔺Above Price (3272):
• 3289–3294
Decision Block – M30 OB + FVG. First sign of momentum shift if reclaimed.
• 3302–3314
Supply Reversal – H1 OB + previous BOS zone. EMA alignment adds pressure.
• 3345–3350
Major Rejection Zone – H4 origin of last leg down. Strong resistance area.
🔻Below Price (3272):
• 3254–3264
Imbalance + OB – H4 FVG + clean demand zone. Buy setup only on deep flush + reversal PA.
• 3227–3214
HTF Demand Base – Daily OB + historical volume shelf. Final structural floor before deeper downside opens.
🔸Battle Plan
▶ Scenario 1 – Bearish Breakout
If 3272 fails with momentum and no reversal signs, expect continuation into 3254–3264.
No long trades unless BOS confirms.
▶ Scenario 2 – Reactive Long from Demand
If price gives a strong reaction from 3272 with BOS on M15 or H1 and clears 3294, then a recovery into 3302 is possible. Only valid with confirmed PA + EMA shift.
▶ Scenario 3 – Choppy Rejection from 3294
If price tests 3294 but fails, watch for rejections back toward 3272. Scalpers can fade reactions if no bullish structure forms.
🔸Final Thoughts
Price is once again testing our Extreme Demand Base from July 28 (3289–3272). The zone remains valid — but execution depends entirely on confirmation. Bears still in control unless we reclaim 3302 cleanly.
No need to rush. Best RR setups are found at clean structural edges.
Patience = profits.
—💬 Drop your thoughts in the comments.
❤️ Like if you appreciate the precision.
🔔 Follow GoldFxMinds for more sniper-level updates.
With you all the way,
— GoldFxMinds
📊 Analysis based on Trade Nation TradingView charts.
GOLD (XAUUSD): Bearish Continuation Ahead?!
Gold retested a recently broken significant liquidity cluster.
I see a clear sign of strength of the sellers after its test
with multiple intraday confirmation.
I think that the price will retrace to day to 3276 level.
❤️Please, support my work with like, thank you!❤️
I am part of Trade Nation's Influencer program and receive a monthly fee for using their TradingView charts in my analysis.

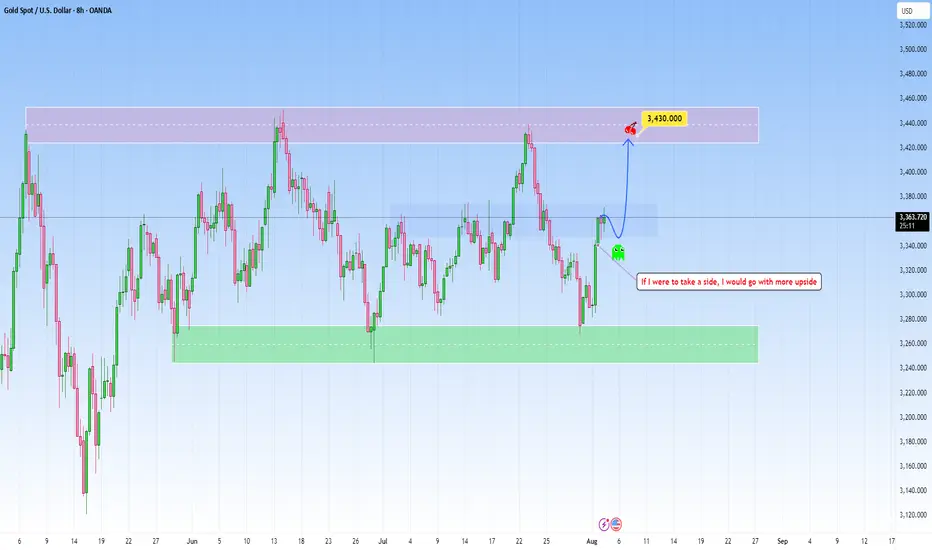
GOLD undecided: Looking for a positive outlookThe current market context on GOLD seems undecided and heavily influenced by news release and macroeconomic catalysts. The recent reversal from the support was pretty decisive, catching short-sellers off guard and forcing them to cover positions.
However, the structure has yet to produce a clean breakout beyond the mid-range, suggesting a lack of strong conviction from either side.
The probability of a pause or reversal here under this circumstances may increase substantially as well. But if I were to take a side I would definitely choose more upside , before any correction begins.
This is a high-risk zone for positioning without confirmation. The market is potentially preparing for a breakout or a fakeout, and patience is key. Wait for clear signs of intent before committing.
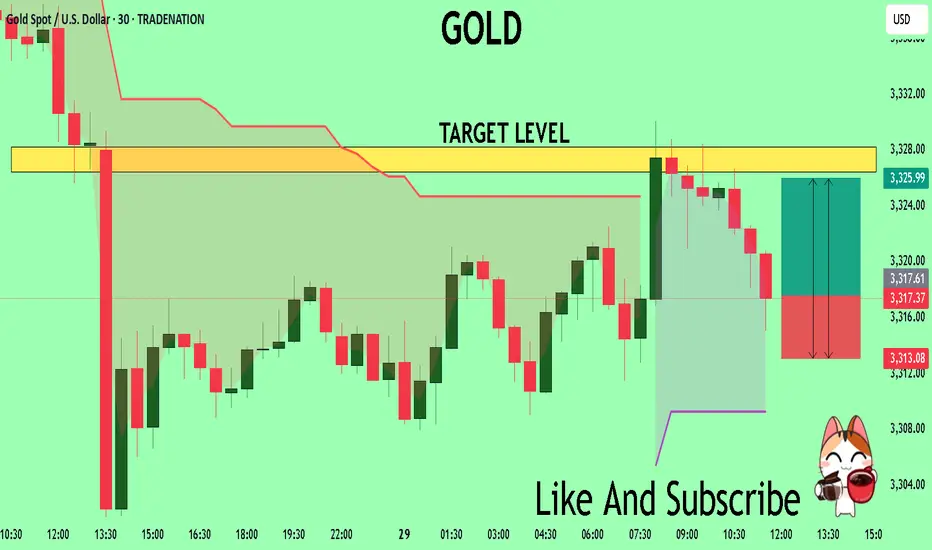
GOLD The Target Is UP! BUY!
My dear subscribers,
This is my opinion on the GOLD next move:
The instrument tests an important psychological level 3317.7
Bias - Bullish
Technical Indicators: Supper Trend gives a precise Bullish signal, while Pivot Point HL predicts price changes and potential reversals in the market.
Target - 3326.4
My Stop Loss - 3313.0
About Used Indicators:
On the subsequent day, trading above the pivot point is thought to indicate ongoing bullish sentiment, while trading below the pivot point indicates bearish sentiment.
Disclosure: I am part of Trade Nation's Influencer program and receive a monthly fee for using their TradingView charts in my analysis.
———————————
WISH YOU ALL LUCK
Gold Drops After Failing to Hold Above $3322📊 Market Overview:
Gold initially surged above the $3322 resistance, hitting $3329 amid Fed pause expectations. However, a rebound in the US dollar and profit-taking triggered a sharp drop back to $3315, signaling weakening bullish momentum.
📉 Technical Analysis:
• Key resistance: $3322 – $3330
• Nearest support: $3308 – $3300
• EMA09 (H1): Price has fallen below EMA09 → turning short-term trend bearish
• Candlestick / Volume / Momentum:
• Failed breakout above $3322 with strong bearish H1 reversal
• Increasing volume during the drop → rising selling pressure
📌 Outlook:
Gold may continue declining in the short term if it fails to hold above $3312. Bears have taken control after the failed breakout attempt. Risk increases for a move toward $3300–$3295.
💡 Suggested Trade Setup:
🔻 SELL XAU/USD : $3318 – $3321
🎯 TP: 40/80/200 pips
❌ SL: $3325
🔺 BUY XAU/USD: $3295 – $3292 (only with clear bullish signal)
🎯 TP: 40/80/200 pips
❌ SL: $3288

Gold can reach resistance area and then continue to fallHello traders, I want share with you my opinion about Gold. Over an extended period, the price action of Gold has been contained within a large descending triangle, a pattern characterized by a series of lower highs testing a descending resistance line and a relatively flat support base. The major seller zone around the 3415 resistance level has consistently capped upward rebounds, establishing a clear downward pressure on the asset. The most critical recent development has been a decisive breakdown, where the price broke below a key ascending trend line and, more importantly, below the horizontal support at 3310. This structural break has shifted the immediate market dynamics, turning the former support area of 3310 - 3320 into a new ceiling of resistance. The primary working hypothesis is a short scenario based on the principle of a breakdown and retest. It is anticipated that the price will attempt a corrective rally back towards this new resistance area around 3310. A failure to reclaim this level, confirmed by a strong rejection, would validate the breakdown and signal the continuation of the larger downward trend. Therefore, the tp for this next bearish leg is logically placed at the 3240 level. This target represents a significant area of potential support and a measured objective following the resolution of the recent consolidation. Please share this idea with your friends and click Boost 🚀
Disclaimer: As part of ThinkMarkets’ Influencer Program, I am sponsored to share and publish their charts in my analysis.

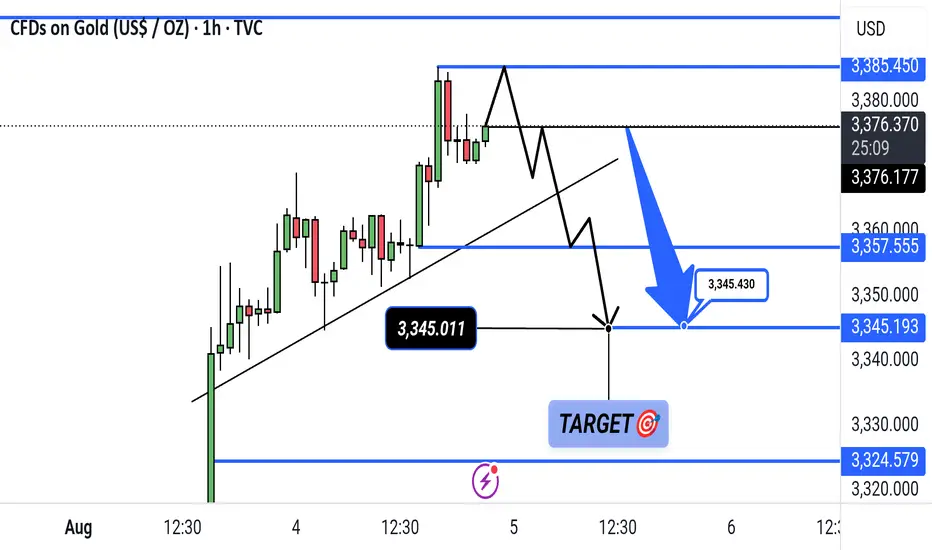
Gold Bearish Breakdown Setup – Targeting 3324 ZoneGold is showing a potential bearish setup on the 1-hour chart. A break below the key support zone at 3345 could trigger a downward move toward the target at 3324.579. Price action suggests a possible lower high formation before the drop.
Gold 30Min Engaged ( Bearish Break Out Entry Detected )Time Frame: 30-Minute Warfare
Entry Protocol: Only after volume-verified breakout
🩸Bearish From now price - 3306
➗ Hanzo Protocol: Volume-Tiered Entry Authority
➕ Zone Activated: Dynamic market pressure detected.
The level isn’t just price — it’s a memory of where they moved size.
Volume is rising beneath the surface — not noise, but preparation.
🔥 Tactical Note:
We wait for the energy signature — when volume betrays intention.
The trap gets set. The weak follow. We execute.
XAUUSD 4H AnalysisXauusd breaks the downward trendline and changes its direction toward important resistence levels 3369-3374. This zone is very important based on ichimoku, so we expect good reaction. after the reaction, the chart will be updated.
important support level is 3317.

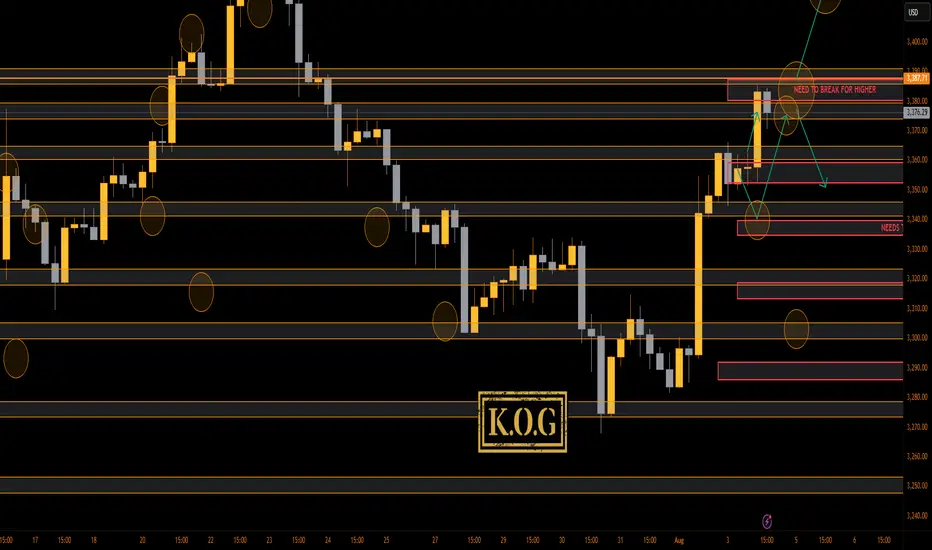
THE KOG REPORT - UpdateEnd of day update from us here at KOG:
Not a bad day at all on the markets with gold holding the 3345-50 support level and giving the push upside as we wanted. We managed to complete our Excalibur targets and hit the ideal target level which was share in the NFP KOG report to complete the move.
Now, we need to play a little caution here as we have bounced the red box box as anticipated and a small RIP is in progress. Support stands at the 3364 level with resistance above 3377. We'll expect there to be a hunt above so lets make sure to protect and manage.
KOG’s bias for the week:
Bullish above 3340 with targets above 3370✅, 3373✅, 3379✅ and above that 3384✅
Bearish on break of 3340 with targets below 3330, 3320 and below that 3310
RED BOXES:
Break above 3365 for 3372✅, 3375✅, 3379✅, 3384✅ and 3390 in extension of the move
Break below 3350 for 3346, 3340, 3335 and 3330 in extension of the move
As always, trade safe.
KOG
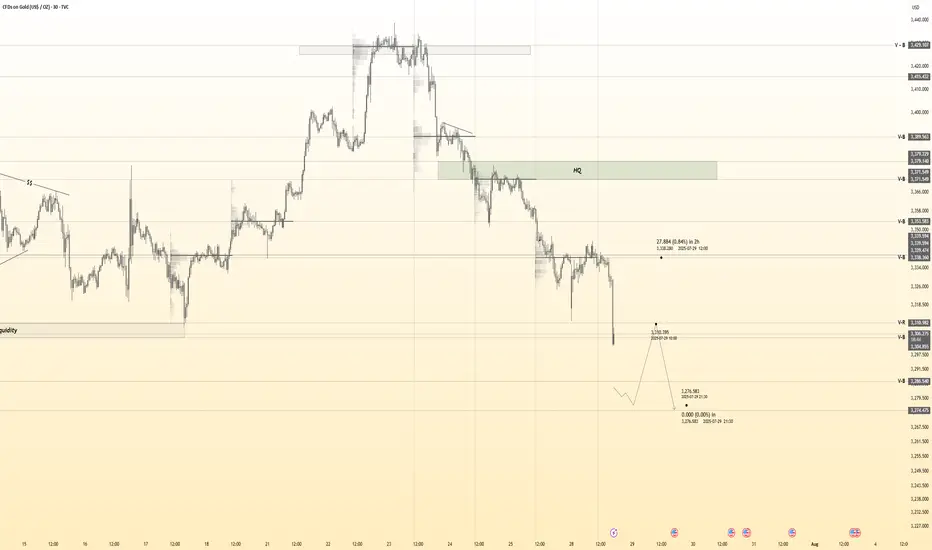
My first take on XAUUSDI see this last fall as a very clear sweep of liquidity (the recent lows. After that i see an impulsive push away from this zone giving me a change of character. Left behind is an FVG on hopurly chart that aligns within the kill zone on my Fibonacci tool. and that is where i would enter. I would expect price to mitigate this FVG. Another confluence is that we created many IFVG's on the way up showing balanced price action. Only one more confluence i would have liked is a HTF order block from the liquidity sweep but only have one on the 5 minute. i will monitor. First tp is that internal liquidity from the move, second tp is the external liquidity where we have had consolidation and a few failed attempts to break above this opening gap fvg. thanks for looking. any comments welcome,

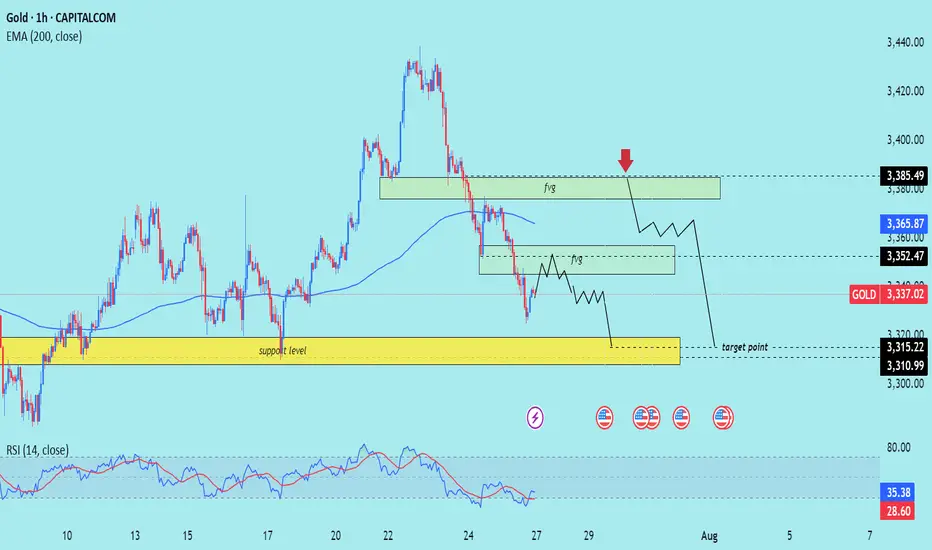
XUA/USD) Bearish Trend Read The captionSMC Trading point update
Technical analysis of (XAU/USD) on the 1-hour timeframe, targeting a move toward the $3,310–$3,315 support zone. Here's the full breakdown:
---
Technical Analysis – Gold (1H)
1. Fair Value Gap (FVG) Supply Zones
Two FVG supply zones are marked where price previously dropped sharply:
Upper FVG zone near $3,385.49 (with red arrow: expected rejection point)
Lower FVG zone near $3,352.47
Price is expected to reject from either zone, resuming the bearish move.
2. Market Structure: Lower Highs, Lower Lows
The chart shows a clear bearish structure, with consistent lower highs and lower lows.
The current price action suggests a potential pullback into FVG, followed by another leg down.
3. Key Support Zone (Target Area)
The yellow box between $3,315.22–$3,310.99 represents a strong demand/support zone and is marked as the target point.
This level has acted as a prior accumulation zone and is likely to attract buying interest again.
4. EMA 200 Resistance
Price is trading below the 200 EMA (currently at $3,365.87) — indicating a bearish bias.
EMA also aligns near the lower FVG zone, reinforcing the area as a potential reversal point.
5. RSI Indicator
RSI at 35.38 is nearing oversold territory but still shows downward pressure.
No divergence or reversal signal yet — supports the continuation view.
Mr SMC Trading point
---
Summary
Bias: Bearish
Current Price: $3,337.02
Supply Zones (FVG):
$3,385.49 (stronger supply)
$3,352.47 (minor supply)
Support Target: $3,315.22–$3,310.99
Structure: Bearish (LL-LH formation)
EMA: 200 EMA acting as dynamic resistance
RSI: 35.38 – still bearish momentum
---
Please support boost 🚀 this analysis)
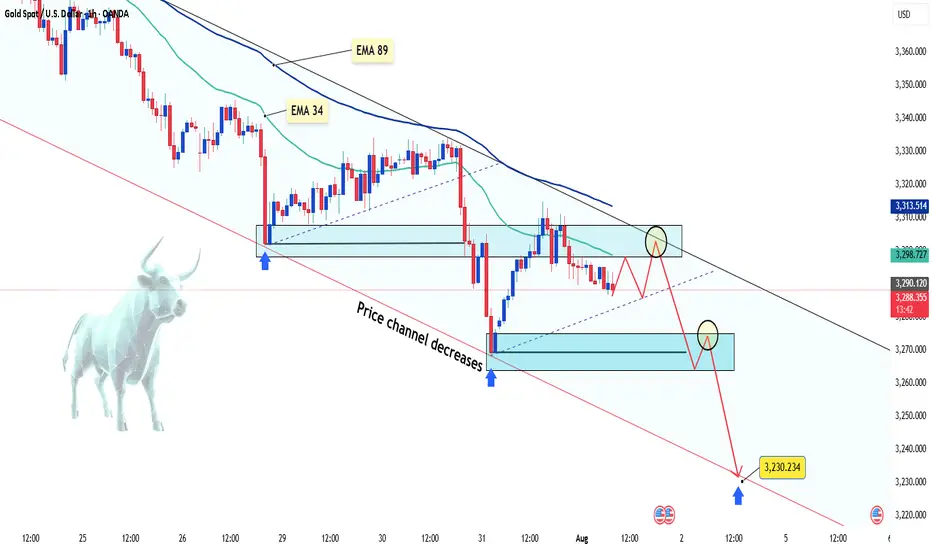
Gold keeps falling – is there more to come?Hello everyone, great to see you again!
Today, gold remains under pressure following a series of strong U.S. economic data releases, which have reinforced expectations that the Federal Reserve will keep interest rates elevated for longer. As a result, the U.S. dollar has strengthened, Treasury yields have climbed, and gold has lost its footing.
On the H1 chart, XAUUSD is clearly trading within a descending price channel. Both the EMA 34 and EMA 89 are acting as dynamic resistance zones. Recent attempts to rally have consistently failed at these levels, mirroring the bearish setup seen before July 29.
Currently, price is retesting a minor resistance area. If this retest fails, the next downside targets lie near 3,270 – and potentially down to 3,230 USD, which aligns with the lower boundary of the price channel.
From my perspective, the bearish momentum is likely to continue.
What about you? How do you think gold will close the day?
Follow master candle for today's SELL strategy✏️ OANDA:XAUUSD has continued a strong downtrend. Yesterday's D1 candle closed with a 60-price decrease, forming a master candle that determines the market trend. With the market having a master candle, pay attention to the 25% or 50% candle zones to trade in the direction of the trend. Today's main trading strategy will be to SELL according to the master candle. The BUY strategy will only be implemented when the 3313 zone is broken.
📉 Key Levels
Support: 3285-3270-3250
Resistance: 3301-3312-3333
SELL Trigger. Rejection 3301, 3312
Target 3250
Leave your comments on the idea. I am happy to read your views.

Gold 30Min Engaged ( Bullish After Break Out Entry Detected )———
Time Frame: 30-Minute Warfare
Entry Protocol: Only after volume-verified breakout
🩸Bullish Break - 3339
➗ Hanzo Protocol: Volume-Tiered Entry Authority
➕ Zone Activated: Dynamic market pressure detected.
The level isn’t just price — it’s a memory of where they moved size.
Volume is rising beneath the surface — not noise, but preparation.
🔥 Tactical Note:
We wait for the energy signature — when volume betrays intention.
The trap gets set. The weak follow. We execute.
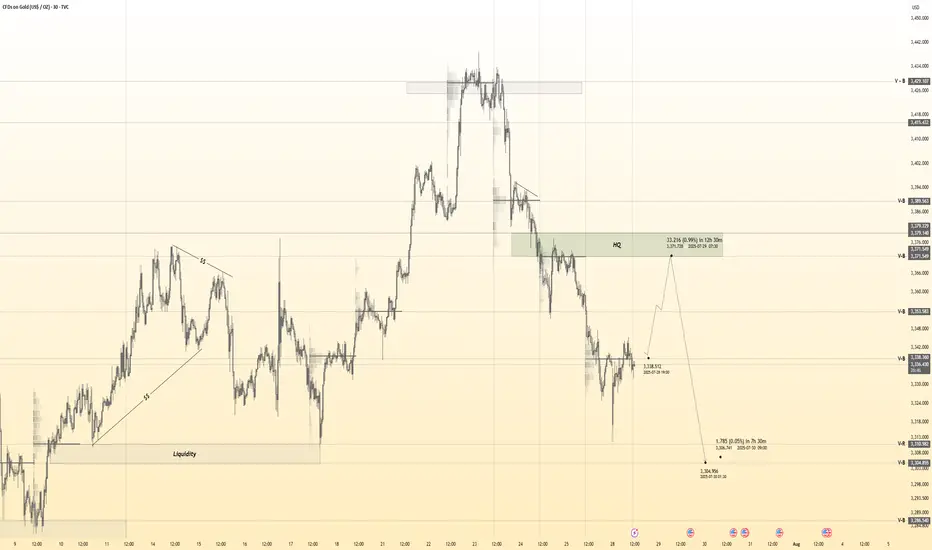
XAUUSD – the calm before the next breakout?Hello traders, what’s your take on the current trend in OANDA:XAUUSD ?
Looking back over the past 12 months, gold has delivered a truly impressive performance. From around $2,380 in August 2024, the precious metal surged to an all-time high of $3,432 by April this year — a gain of more than $1,000 in less than a year. But what’s more telling than the rise itself is how the market behaved afterward: instead of crashing, gold has maintained a high consolidation range, suggesting the uptrend is still very much alive.
This powerful rally didn’t happen in isolation. In a world marked by uncertainty, gold has once again asserted its role as a safe-haven asset. Inflation remains persistent across major economies, geopolitical tensions continue to stretch from Eastern Europe to the Middle East and Asia, and de-dollarization efforts by countries like China and Russia are reshaping global capital flows. None of these events alone could shake the markets, but together, they have laid the groundwork for gold’s sustained relevance.
From a technical standpoint, the long-term bullish structure remains intact. Following its peak at $3,432, gold has entered a modest correction phase — one that may well be a healthy consolidation before the next directional move.
Interestingly, while many investors remain cautious, the chart paints a different story: a market that isn’t afraid, but simply catching its breath. The real question is no longer “Can gold hold above $3,400?” but rather “Is the market gearing up for a fresh breakout — or a deeper correction?”
We may not be able to predict the future, but we can observe how price reacts at key levels. And sometimes, it’s in these seemingly quiet phases that the biggest turning points begin to form.
What do you think — is gold preparing for another leg up?
Drop your thoughts in the comments below! 👇

Gold on the edge: Will 3,270 break as Fed pressure builds?Hello traders, what’s your view on XAUUSD?
Yesterday, gold remained under pressure as a series of fresh U.S. economic data reinforced expectations that the Federal Reserve will keep interest rates higher for longer. As a result, U.S. Treasury yields surged, the dollar strengthened, and gold came under renewed selling pressure. Currently, XAUUSD is trading around 3,288 USD, down 0.04% on the day.
From a technical standpoint, gold is clearly trading within a well-defined downward-sloping channel, confirming the dominance of bearish momentum. Moreover, both the EMA34 and EMA89 are acting as dynamic resistance levels, repeatedly rejecting any short-term recovery attempts—highlighting the strength of the current downtrend.
If a pullback occurs before the next leg lower, the confluence of resistance and the EMA zone will be crucial to watch. It could offer ideal conditions for potential short setups in line with the trend.
Looking ahead, the next key support lies at 3,270 USD. A break below this level could open the door for a deeper move toward the 32XX area.
What do you think? Will gold continue to drop further?
Good luck and trade safe!
