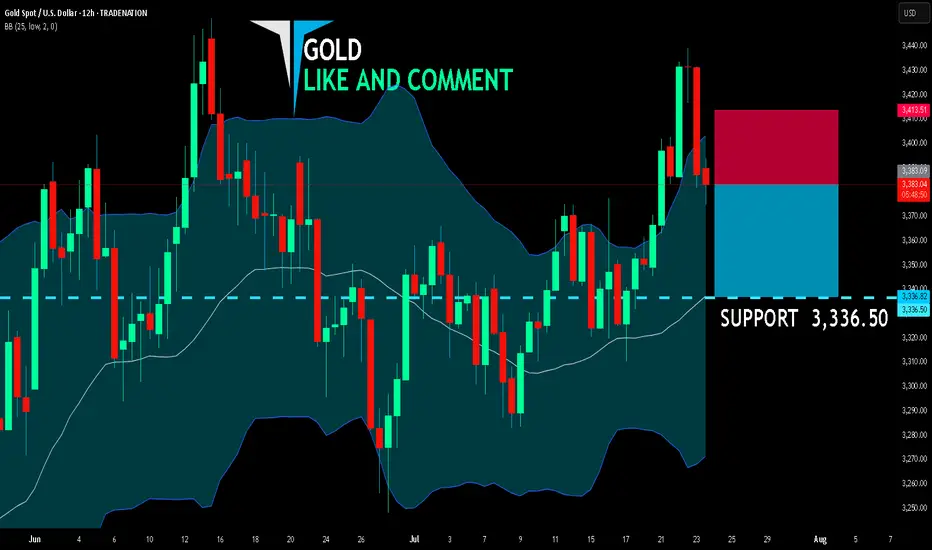
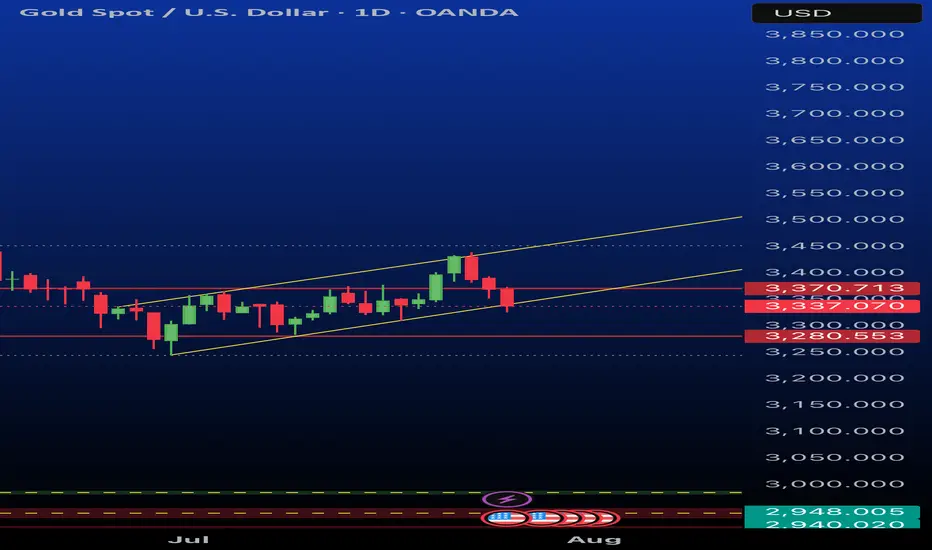
GOLD BEARS ARE STRONG HERE|SHORT
GOLD SIGNAL
Trade Direction: short
Entry Level: 3,383.09
Target Level: 3,336.50
Stop Loss: 3,413.51
RISK PROFILE
Risk level: medium
Suggested risk: 1%
Timeframe: 12h
Disclosure: I am part of Trade Nation's Influencer program and receive a monthly fee for using their TradingView charts in my analysis.
✅LIKE AND COMMENT MY IDEAS✅
XAUUSDG trade ideas
Japanese Candlestick Cheat Sheet – Part Two- 2 candle patternsTwo-Candle Patterns That Signal Shifts in Sentiment
Single candles whisper…
But two candles talk to each other — and when they do, they often reveal the first signs of a reversal or continuation.
In this second part of the series, we go deeper.
From engulfings to haramis, tweezer tops to piercing lines — these patterns don’t just look good on charts… they capture the psychological tug-of-war between buyers and sellers.
Price doesn’t lie.
And two candles in a row can say: “Something just changed.”
Learn to spot them early. Learn to listen when the chart speaks.
This is Part Two of your practical guide to mastering candlestick formations.
BULLISH KICKER
Bias: Bullish
What is the Bullish Kicker pattern?
The Bullish Kicker forms when a strong bullish candle follows a bearish one with no overlap between the two, indicating a sudden shift in sentiment. This pattern is a powerful indicator of a reversal as buyers take control. The sharp contrast between the bearish and bullish candles reflects a dramatic shift in market psychology, where bears are caught off-guard and forced to cover their positions.
Bullish Kickers are rare but extremely telling, providing a clear signal that sentiment is favoring buyers. Recognizing such decisive patterns can be a game-changer.
Meaning:
Found after downtrends or sell-offs; suggests a sudden shift in sentiment, indicating strong buying interest and potential trend reversal.
BULLISH ENGULFING
Bias: Bullish
What is the Bullish Engulfing pattern?
The Bullish Engulfing pattern occurs when a large bullish candle fully engulfs the previous smaller bearish candle, signaling a potential trend reversal. This pattern highlights a moment when buyers overpower sellers, often marking the beginning of upward momentum. Psychologically, it suggests that buyer confidence is returning, and sellers are losing their grip.
For traders, understanding Bullish Engulfing patterns can provide crucial entry points into emerging trends. Learning to identify and trade such patterns is essential for capturing momentum and new trends.
Meaning:
Typically found in downtrends, this pattern signals a potential bullish reversal as buyers overpower sellers, often indicating a shift toward upward momentum.
BULLISH HARAMI
Bias: Bullish
What is the Bullish Harami pattern?
The Bullish Harami consists of a small bullish candle within a preceding larger bearish one, indicating a pause in downward momentum and hinting at a potential reversal. This pattern shows that sellers are beginning to weaken as buyers cautiously test the waters. The Harami reflects a shift in sentiment from bearish to neutral, often marking a transitional phase in the market.
Interpreting the Bullish Harami helps traders spot moments when sentiment is shifting, potentially signaling the start of a trend change.
Meaning:
Seen in downtrends, it suggests indecision, with possible bullish reversal if the following candles confirm buying strength, indicating a weakening bearish trend.
PIERCING LINE
Bias: Bullish
What is the Piercing Line pattern?
The Piercing Line forms when a bullish candle opens below the previous bearish candle’s low but closes over halfway into it. Found in downtrends, this pattern reflects strong buying pressure as buyers step in at lower prices, creating a potential bullish reversal. The Piercing Line pattern suggests that sentiment may be shifting as buyers gain confidence.
This pattern’s strength lies in its psychological impact, revealing moments when buyers are willing to take risks. Recognizing these signs early can provide valuable insights for traders looking to time entries.
Meaning :
Found in downtrends, this pattern suggests a possible bullish reversal if buying continues, as sellers lose control to buyers.
TWEEZER BOTTOM
Bias: Bullish
What is the Tweezer Bottom pattern?
The Tweezer Bottom pattern is characterized by two consecutive candles with nearly identical lows, one bearish and one bullish. This pattern often signals the end of a downtrend, as the matching lows suggest a strong support level where buyers are stepping in. The Tweezer Bottom highlights market psychology at work, with sellers unable to push prices lower, reflecting renewed buying interest.
Tweezer Bottoms are ideal for traders looking to identify support zones and potential reversal points. By understanding this pattern’s significance, traders can make informed decisions.
Meaning:
Found in downtrends, it signals potential reversal, showing strong support at the matching low, suggesting buyers are stepping in.
BEARISH KICKER
Bias: Bearish
What is the Bearish Kicker pattern?
The Bearish Kicker is the inverse of the Bullish Kicker, forming when a strong bearish candle follows a bullish one without overlap, indicating a sharp sentiment shift. This pattern often marks a sudden reversal, with sellers taking control after an initial bullish period. Psychologically, Bearish Kickers are powerful, signaling that buyers are caught off-guard and losing momentum.
Recognizing Bearish Kickers provides traders with insights into sudden shifts in market dynamics, helping them avoid buying into weakening trends.
Meaning:
Found after uptrends; indicates a sudden sentiment shift, signaling potential trend reversal and intensified selling pressure.
BEARISH ENGULFING
Bias: Bearish
What is the Bearish Engulfing pattern?
The Bearish Engulfing pattern forms when a large bearish candle engulfs the previous smaller bullish candle, suggesting a potential reversal in an uptrend. This pattern signals that sellers have regained control, often marking the start of downward momentum. The Bearish Engulfing reveals a psychological shift, as selling pressure overtakes buying interest.
This pattern is a powerful tool for traders who aim to catch trend reversals, allowing them to align with emerging downward momentum.
Meaning:
Typically found in uptrends, this pattern signals a potential bearish reversal as sellers overpower buyers, often indicating a downward momentum shift.
BEARISH HARAMI
Bias: Bearish
What is the Bearish Harami pattern?
The Bearish Harami consists of a small bearish candle contained within a larger preceding bullish one, reflecting indecision and a potential trend reversal. Found in uptrends, it hints that buyers are losing strength, while sellers are cautiously testing the market. This pattern highlights moments when buyer momentum begins to wane, suggesting caution.
Interpreting the Bearish Harami allows traders to spot potential shifts in sentiment, helping them manage risk and time their exits.
Meaning:
Seen in uptrends, it suggests indecision with a potential bearish reversal if following candles confirm, indicating a weakening bullish trend.
DARK CLOUD COVER
Bias: Bearish
What is the Dark Cloud Cover pattern?
The Dark Cloud Cover appears when a bearish candle opens above the previous bullish candle but closes over halfway into it, reflecting a shift in control from buyers to sellers. This pattern suggests that bullish momentum may be fading, hinting at a potential reversal. Dark Cloud Cover patterns reveal moments when sentiment shifts from optimism to caution.
For traders, understanding this pattern helps them anticipate reversals at the top of uptrends.
Meaning:
Found in uptrends; signals potential bearish reversal if selling continues, as buyers lose control to sellers.
TWEEZER TOP
Bias: Bearish
W hat is the Tweezer Top pattern?
The Tweezer Top is formed by two candles with matching or nearly matching highs, typically one bullish and one bearish. This pattern signals potential resistance, as sellers are consistently pushing back against the same level. The Tweezer Top reflects a moment of seller strength, often marking the end of an uptrend.
Recognizing Tweezer Tops helps traders spot resistance zones and potential reversal points, allowing them to avoid buying into weakening trends or even shorting the asset.
Meaning:
Found in uptrends, it signals potential reversal, showing strong resistance at the matching high, suggesting selling pressure.
🧭 Final Thought
Two-candle formations often appear at key turning points — right where most traders hesitate or get trapped.
Learn to read them not just as patterns, but as conversations between candles — one pushing, the other reacting.
And if this is your first time reading the series, don’t miss Part One – where we covered single-candle signals like dojis, hammers, and marubozus — the very foundations of candlestick reading.
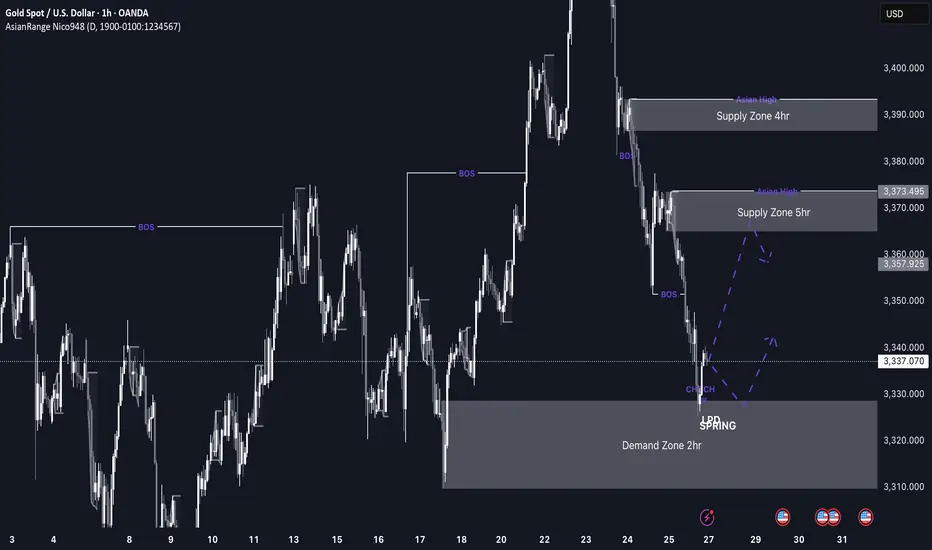
GOLD imminent possible buys up to 3,370 This week’s price action on GOLD is shaping up to be very interesting. After weeks of sustained bearish pressure, price has now entered a discounted 2hr demand zone sitting at a swing low, which makes it a high-probability area for a bullish reaction, especially as markets open.
If we do get the expected bullish reaction from this level, I’ll be watching the 3,370 region, where there’s a clean 5hr supply zone. If price reaches that level, I’ll be looking out for distribution and a potential short setup from there.
Confluences for GOLD Longs:
Price has been very bearish recently, so a retracement is expected
Currently sitting in a discounted 2hr demand zone
The overall long-term trend is still bullish
Early signs of accumulation and bullish reaction from this zone
P.S. If price fails to hold this current demand zone and breaks lower, then bearish momentum may continue. In that case, I’ll look for new long opportunities around 3,290 where a deeper demand zone exists.
GOLD continues to correct down, good news from trade situationOANDA:XAUUSD has fallen sharply again, currently trading around $3,360/oz, reflecting the easing of global trade tensions, affecting demand for safe-haven assets. The US Dollar and US Treasury yields have also increased, affecting gold prices.
The US Dollar Index ( TVC:DXY ), which tracks the greenback against six other currencies, rose to 97.56.
The yield on the 10-year US Treasury note US10Y rose to 4.386%. The US real yield, calculated by subtracting inflation expectations from nominal interest rates, rose nearly 3.5 basis points to 2.046%.
Markets are increasingly optimistic about such deals after the United States and Japan reached a trade deal, and the European Union could be next. In addition, rising stock markets and low volatility have kept gold's gains in check.
The United States and the European Union are moving toward a potential trade deal that would include a 15% tariff on EU goods and zero tariffs on some items.
The European Commission said Thursday that a negotiated trade solution with the United States is within reach.
“Our focus is on reaching a negotiated outcome with the United States,” a European Commission spokesperson told reporters about the EU-U.S. tariff talks. “We believe that such an outcome is achievable.” The European Commission has repeatedly said that its current priority is to reach a deal with the United States to avoid the 30% tariffs that U.S. President Trump has proposed to impose on EU products starting August 1.
On the economic data front, initial jobless claims in the United States unexpectedly fell last week, suggesting the job market remains solid.
The U.S. Bureau of Labor Statistics reported on Thursday that initial jobless claims fell to 217,000 in the week ended July 19, below expectations of 227,000 and down from 221,000 the previous week.
Technical Outlook Analysis OANDA:XAUUSD
Gold is heading for its third consecutive day of decline since hitting the bullish target level sent to readers in the weekly edition on Sunday at $3,430.
Despite the sharp decline, gold still has enough technical conditions for an uptrend given its current position and structure.
Specifically, gold is still above the EMA21, which is considered the nearest support at the moment. Along with that, the uptrend price channel is the short-term trend. However, for gold to qualify for a short-term bullish cycle, it needs to be confirmed by price action above the 0.236% Fibonacci retracement level, then the target is $3,400 in the short term, more than $3,430.
On the other hand, RSI is still holding above 50, and 50 in this case acts as momentum support. Therefore, gold still has room to rise.
In case gold is sold below EMA21, it may suffer a further decline with the next target around $3,310 in the short term, more than $3,300 and the 0.382% Fibonacci retracement level. And if gold loses the support at the 0.382% Fibonacci level, it will qualify for a bearish cycle.
Intraday, the current position of gold price is still tilted towards the upside, and the notable price points will be listed as follows.
Support: $3,350 – $3,310 – $3,300
Resistance: $3,371 – $3,400 – $3,430
SELL XAUUSD PRICE 3406 - 3404⚡️
↠↠ Stop Loss 3410
→Take Profit 1 3398
↨
→Take Profit 2 3392
BUY XAUUSD PRICE 3329 - 3331⚡️
↠↠ Stop Loss 3326
→Take Profit 1 3337
↨
→Take Profit 2 3343

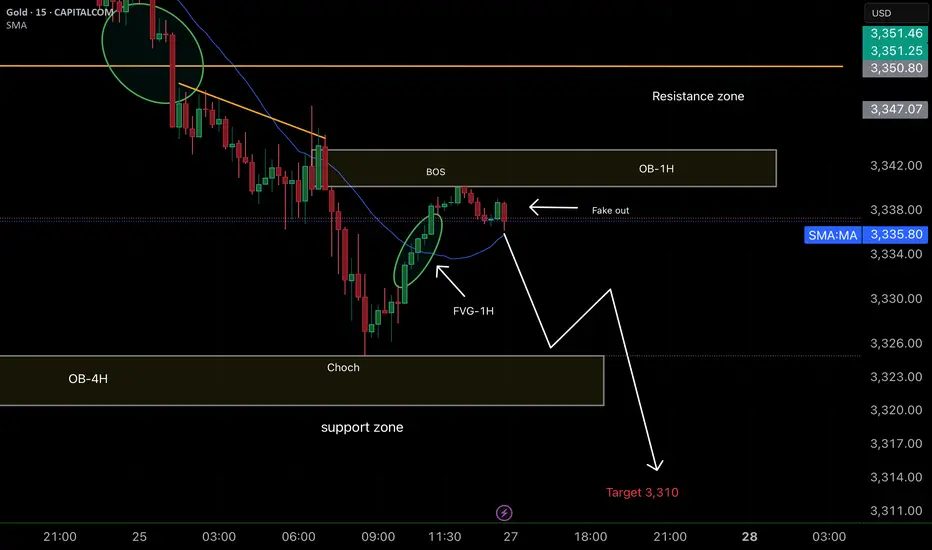
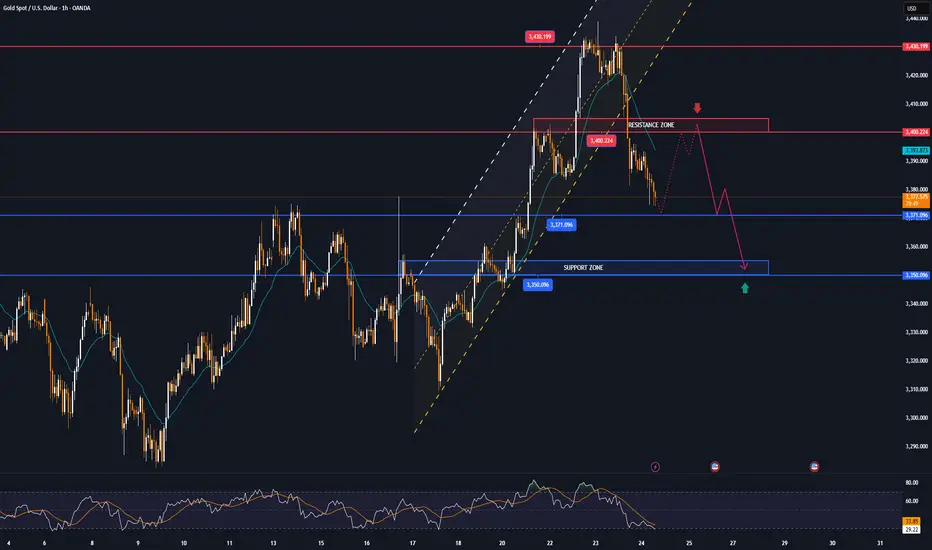
Smart Money concepts (SMC) Positive points of the analysis:
1. Clarity in the market structure (CHoCH + BOS):
It is clear that the market made a CHoCH and then confirmed it with a Break of Structure (BOS), which validates the downward trend change.
2. Well-identified fake out:
The "fake out" just after the BOS and within the 1H-OB is typical institutional behavior. This bullish wick is a trap to induce liquidity before the fall. Excellent reading.
3. Confluence zone (1H-OB + 1H-FVG):
The price rises to mitigate the 1H-FVG within the 1H-OB, providing a very good entry opportunity.
Furthermore, this occurs within the resistance zone, which gives it even more weight.
4. Support zone and target at 3310:
The TP is very well projected at 3310, just below the current support zone. If it breaks that zone, it is highly likely that it will reach the target.
XAUUSD: Market analysis and strategy for July 24.Gold technical analysis:
Daily chart resistance 3440, support 3310
4-hour chart resistance 3390, support 3340
1-hour chart resistance 3375, support 3360.
Yesterday, according to news, the United States and the European Union were close to reaching a trade agreement, which led to the recent risk aversion sentiment to subside, and the bulls took profits. The gold price has fallen by nearly $80 from its peak.
From the current power comparison, the bears are temporarily dominant. Since yesterday, the candlestick chart of the 4-hour chart has completed 6 candles today (2 of which are sideways and 4 are falling sharply). It is expected that it will not rebound until today's NY market trading session.
Gold may reach 3359 or even 3340. At that time, we will observe the stabilization of the candlestick chart. Once the downward momentum is exhausted and it starts to close higher, we can buy. The upper pressure is 3380/3400.
Buy: 3359near
Buy: 3340near
Sell: 3380near
Sell: 3400near

Current Gold Short tradeI'm currently trading gold short from 3430. I have taken partials and my SL are at BE.
Here we have 2 scenarios at Support.
Heavy volume selloff means there’s fuel for more downside.
If price consolidates here and keeps making lower highs, or retests 3,376 from below and rejects, that’s a short re-entry/continuation signal.
Odds:
Much higher at the moment. The last impulse was violent, and buyers have not stepped up yet.
If 3,372 breaks—look to short the retest (classic SR flip) for a move to 3,348 and below.
If you see a slow grind sideways (chop), walk away and wait for the breakout from this zone.
3,376–3,372 Do not long unless reversal candle forms High risk to knife-catch
<3,372 Look for shorts on retest Downside opens up fast
3,389+ Bullish confirmation only Only chase if true reversal

Gold channel Aka RangeJust Lookingg at this weeks price action I think gold will continue to trend in this range
Completion of rising wedge Gold is currently still holding rising channel along with the swing moves we were on buy at 3410 and my optimal target was 3425-3430 which is achieved now I'm expecting the reversal move!!
What's possible scanarios we have?
▪️I'm looking for sell opportunity from 3430-3435 area by following our structural strategy, also we have previous moves on Rising channel, market always respect its prevoius BOS and my Selling trade target will be 3405 then 3395 in extension.
▪️if H4 candle closing above 3435-3438 this Parallel moves will be invalid.

From 3,430 USD GOLD falls below 3,400 USD on optimistic newsOANDA:XAUUSD has suffered a sharp sell-off after rising sharply earlier in the week. Media reports said the United States and the European Union were getting closer to reaching a tariff deal, and the news weighed on safe-haven demand.
OANDA:XAUUSD fell below $3,400 an ounce on Wednesday, down more than 1.2%, following news that the United States and the European Union were close to signing a deal similar to the one Washington and Tokyo signed on Tuesday. It is now trading below that key base point.
The European Union and the United States are moving toward a trade deal that could see more EU goods hit with a 15 percent U.S. import tariff, two diplomats said. Earlier, U.S. President Donald Trump reached a trade deal with Japan that would cut auto tariffs to 15 percent.
Optimism about an imminent U.S.-EU trade deal overshadowed a decline in the U.S. dollar. The U.S. dollar index (DXY), which measures the greenback against a basket of six currencies, fell 0.05 percent on the day to 97.160.
U.S. Treasury yields rose, with the 10-year Treasury yield rising to 4.396%. U.S. real yields, calculated by subtracting inflation expectations from nominal yields, rose nearly 4 basis points to 1.994%.
Gold tends to gain in value during times of uncertainty and low-interest-rate environments because gold itself does not generate interest, and in low-interest-rate environments, the opportunity cost of holding gold is relatively low.
U.S., EU near trade deal
The Financial Times reported on Wednesday that the European Union and the United States are close to reaching a trade deal that would impose a 15% tariff on imports from Europe, similar to the one reached between US President Donald Trump and Japan this week.
The Financial Times reported that Brussels is likely to agree to so-called “reciprocal tariffs” to avoid tariffs that Trump has threatened to impose on EU goods of up to 30% from August 1.
“The agreement reached with Japan is clearly extortionate in terms. Most member states are swallowing their anger and are likely to accept the deal,” an EU diplomat said.
The two sides will exempt some products, including aircraft, spirits and medical equipment, from tariffs.
The agreement between the US and Japan has also left Brussels reluctant to accept higher reciprocal tariffs to avoid a damaging trade war, according to the Financial Times.
Technical Outlook Analysis OANDA:XAUUSD
On the daily chart, after gold reached its target at $3,430, it failed to break above this important resistance level and fell slightly. The decline brought gold back to test the support confluence area, which is the location of the 0.236% Fibonacci retracement with the lower edge of the price channel. And with the current position, gold still technically has enough conditions for a possible increase in price.
Specifically, gold is still in/above the supports from the short-term price channel, the long-term rising price channel and the support from the EMA21, as long as gold is still trading above the EMA21, it still has a bullish outlook in the short term. On the other hand, the short-term target is still at 3,430 USD, while once the 3,430 USD level is broken, it will provide the possibility of further upside with the next target at around 3,450 USD in the short term, more than the all-time high.
RSI remains above 50, far from the 80 – 100 area (overbought area). Showing that there is still a lot of room for upside ahead.
During the day, the technical outlook for gold prices continues to favor upside and notable positions will be listed as follows.
Support: 3,371 – 3,350 USD
Resistance: 3,400 – 3,430 – 3,450 USD
SELL XAUUSD PRICE 3421 - 3419⚡️
↠↠ Stop Loss 3425
→Take Profit 1 3413
↨
→Take Profit 2 3407
BUY XAUUSD PRICE 3354 - 3356⚡️
↠↠ Stop Loss 3350
→Take Profit 1 3362
↨
→Take Profit 2 3368
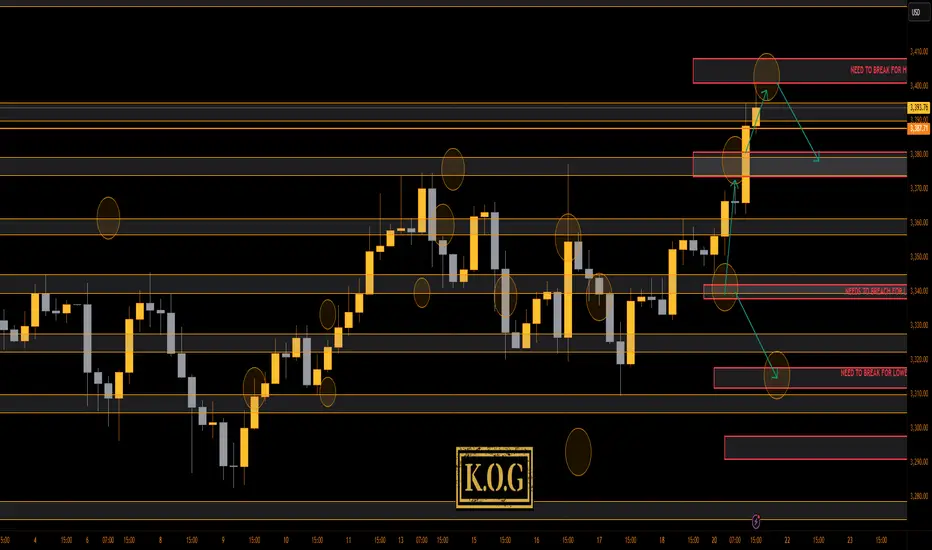
THE KOG REPORT - UpdateEnd of day update from us here at KOG:
Interesting open for the week, not just on gold but across the markets! Our plan yesterday in the KOG Report was to look for that lower support level to hold and then not only to target Excalibur which confirmed the move, but also the red box and bias level targets. This worked well and yet again, within a day, we've completed the week's targets upside!
We couldn't short from the first red box as it was broken. Now we have the red box above which is holding and giving a slight move downside and with the indicators flashing red, we'll stick with the move so far initially looking for 3390-85. We're not discounting a retest of the level, but as long as it holds, we'll go with it.
KOG’s Bias for the week:
Bullish above 3340 with targets above 3355✅, 3361✅, 3368✅, 3372✅ and above that 3385✅
Bearish below 3340 with targets below 3335, 3330, 3322, 3316, 3310 and below that 3304
RED BOX TARGETS:
Break above 3350 for 3355✅, 3361✅, 3367✅, 3375✅ and 3390✅ in extension of the move
Break below 3340 for 3335, 3330, 3320, 3310 and 3306 in extension of the move
Please do support us by hitting the like button, leaving a comment, and giving us a follow. We’ve been doing this for a long time now providing traders with in-depth free analysis on Gold, so your likes and comments are very much appreciated.
As always, trade safe.
KOG
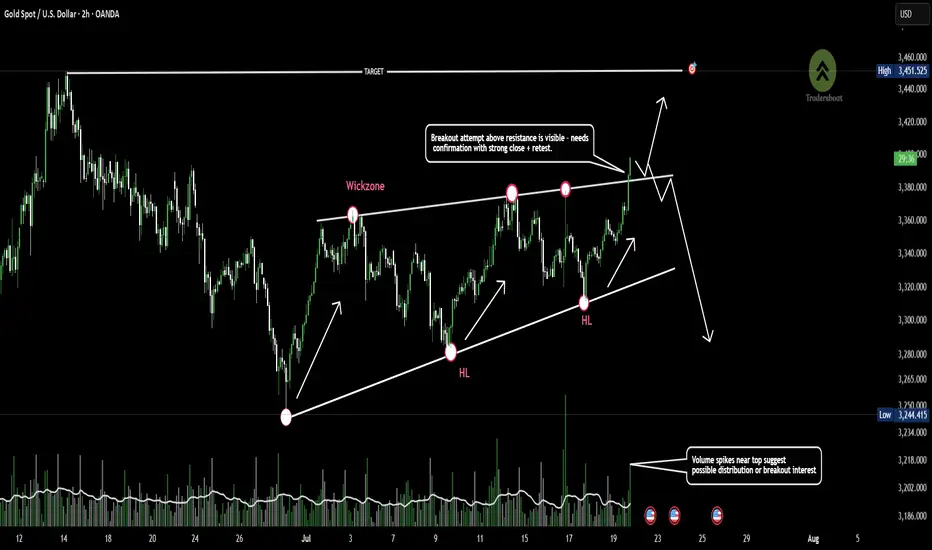
Gold approaches wedge resistance -Breakout or Fakeout incoming?Gold is trading within a rising wedge pattern, showing consistent higher lows and repeated rejections near the 3400 resistance zone.
Price is now approaching the upper trendline, an area of prior wick rejections and potential liquidity grab.
A confirmed breakout could signal continuation, while failure to sustain above this level may indicate bearish divergence or a reversal setup.👀📉
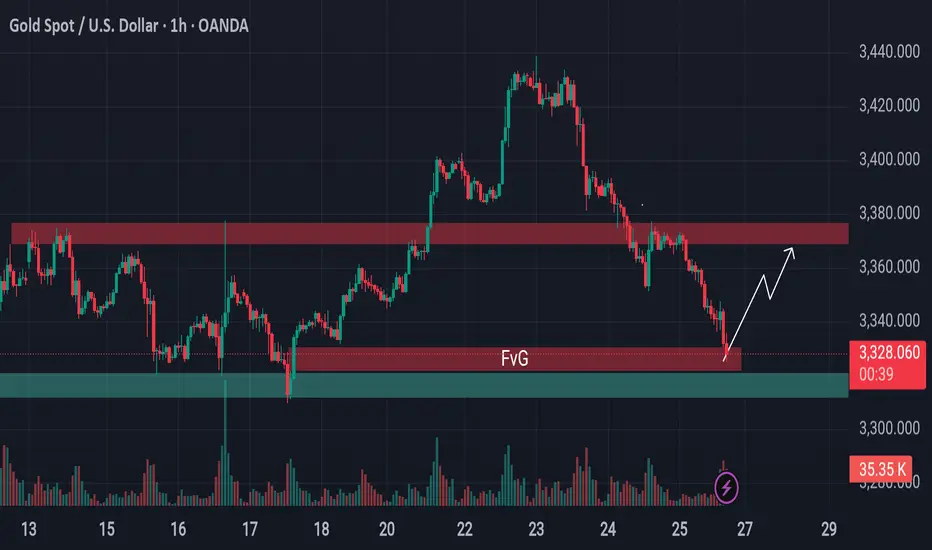
From Breakdown to Breakout? Gold Eyes Support Based Reversal!Gold is approaching a critical support area.
Previously, the price was holding above a key support level, but that zone has now been breached and is likely to act as resistance going forward. However, just beneath the current price, there's a well-established support level still intact—reinforced further by the presence of a bullish Fair Value Gap (FVG).
This setup hints at a possible reversal or a short-term surge from this zone. If market conditions align, gold may stage a pump from here. Keep this level on your radar—it could turn into a decisive point for price direction.
🛡 Always conduct your own analysis before taking any trades. DYOR.
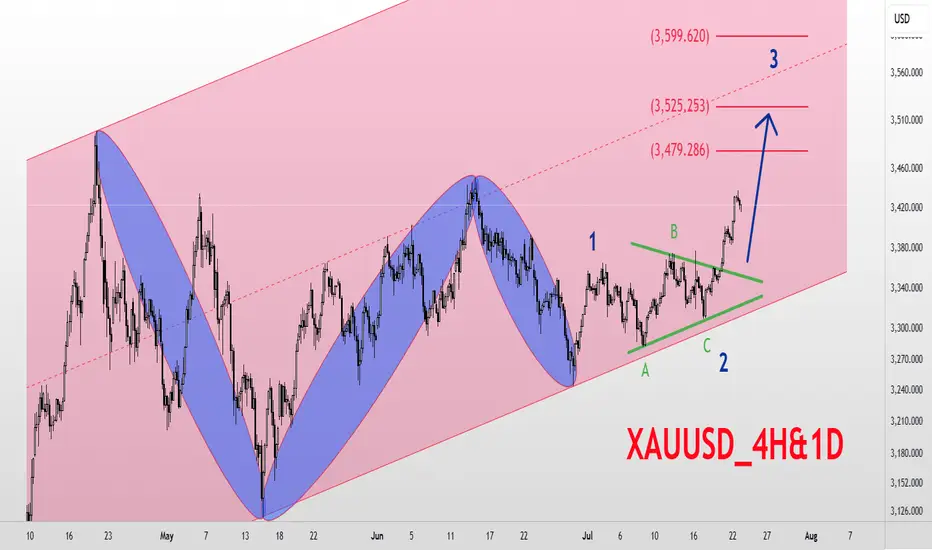
XAUUSD_4H&1D_BuyGold Analysis 4-hour and Daily Medium-term Time Frame Elliott Wave Analysis Style Gold is in a long-term ascending channel Based on Elliott Waves, the market is expected to have entered a new upward trend and has broken waves 1 and 2 and is currently in a large wave 3. The targets for wave 3 are $3480, $3525, and $3600, respectively. Good luck and wish everyone abundance and wealth 💚💚💚
GOLD SELL POSITIONPrice have been correcting the last move down and now is showing a strong resistance at this level. expect price to move down in any news coming soon from US session.

Very Strong Short!Hello all. as you see market needs a new lower low. a little above we have an Strong level that in throw the market down. be happy and Trade it if your method confirm. (wink)

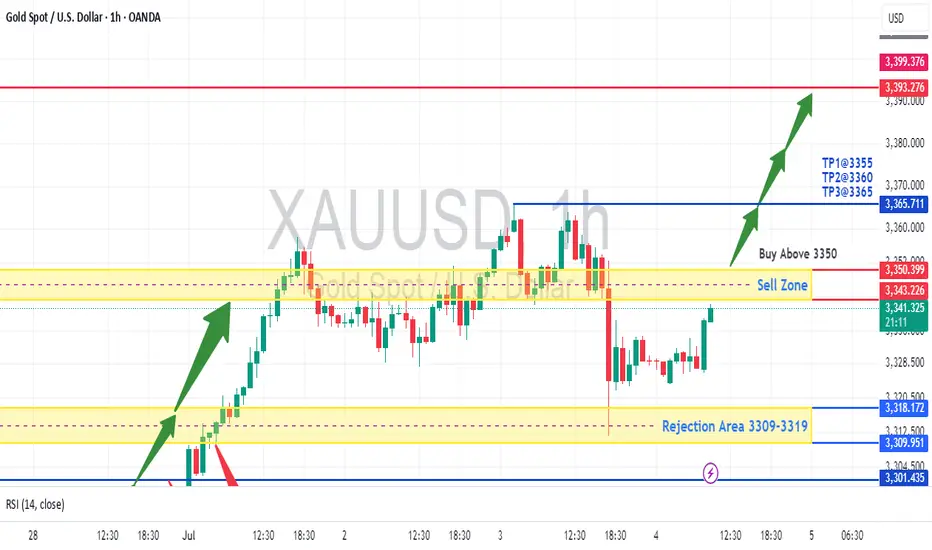
XAUUSD - Retesting 3400 before DeclineThe chart shows a potential buy setup for gold (XAUUSD) with the following key points:
Price Action: Gold is trading at 3,341.465, above the suggested "Buy Above 3350" level, indicating a bullish bias.
Support/Resistance: The rejection area at 3309-3319 held as support, and price has moved higher, confirming buyer interest.
Take Profit Levels: TP1 (3355), TP2 (3360), and TP3 (3365) provide clear upside targets.
RSI Confirmation: The RSI (14) at 54.21 shows moderate bullish momentum without being overbought.
Volume & Close: The slight increase in price (+0.09%) with supportive volume suggests accumulation.
Trade Idea: Enter long above 3350 with stops below 3309, targeting TP1-TP3. The rejection zone and RSI support further upside.
Disclaimer: This is not financial advice. Please consult with a financial advisor before making any investment decisions. We are not responsible for your loss because we are not SEBI registered and this analysis based on technical aspects and only for educational practice. Do your own research.
XAUUSD – Technical rebound, but downside risks remainOn the H4 chart, gold is bouncing slightly from the 3,323 support zone after a sharp drop. However, price remains within a large descending channel and is approaching a dense cluster of bearish FVGs around 3,360–3,374.
News context:
– US GDP and ADP data beat expectations, boosting the USD and adding pressure on gold.
– JOLTS dipped but remains above 7 million → limited support for gold.
– Thailand–Cambodia conflict provides only short-term impact.
Strategy: Favor SELL if price retests 3,360–3,374 and gets rejected. Downside targets: 3,323 or lower.
Main trend remains bearish, unless gold breaks above the descending channel.

Gold setupGold us just broken to the downside from the previous uptrend and now we expect the prices to continue pushing towards the downside. the prices are likely to reject from the the current order block but if not, they will probably do on the smaller upper order block as you can see via the analysis

new pro low keeping ourself within five and following along with structure we receive two stagnant blocks, along with demand some liquidity along the way possibly im going 3302 on a SL tp1 3328

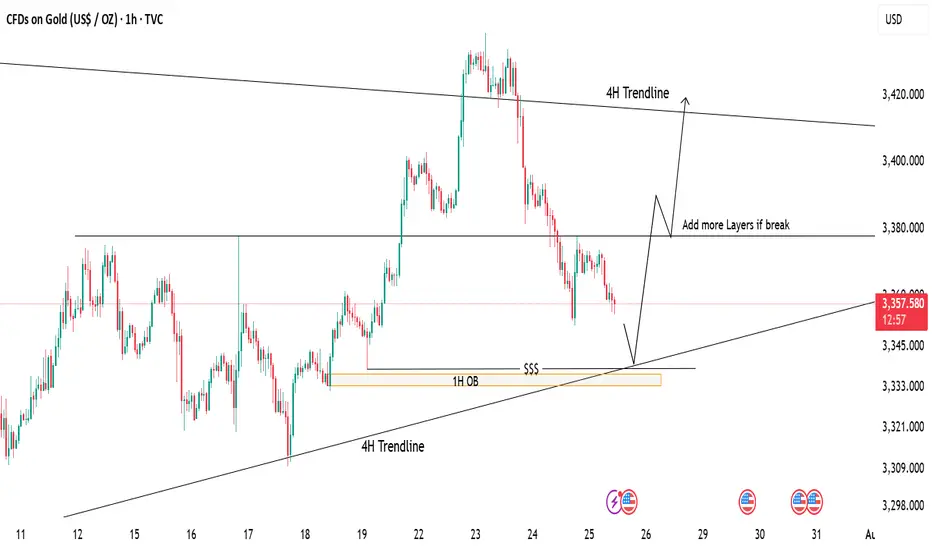
Gold Tapping Into Major Support – Eyes on Bullish ReversalPrice is currently retracing after a strong drop from recent highs. We're now approaching a key demand zone, aligning with:
📍 1H Order Block (OB)
📍 4H Trendline Support
📍 Liquidity Zone ($$$)
📉 If price taps into this area, it may offer a high-probability long setup.
📈 First target: 3380 (mid-range resistance)
🧱 If this breaks, we can look to scale in/add more positions, targeting the 4H trendline zone near 3420.
⚠️ Waiting for price reaction at support – patience is key!

XAUUSD
XAUUSD Updated in 15M :
The gold signal is marked on the chart based on the latest price changes and the supply and demand in the market. These points include the entry point, stop loss, and take profit
