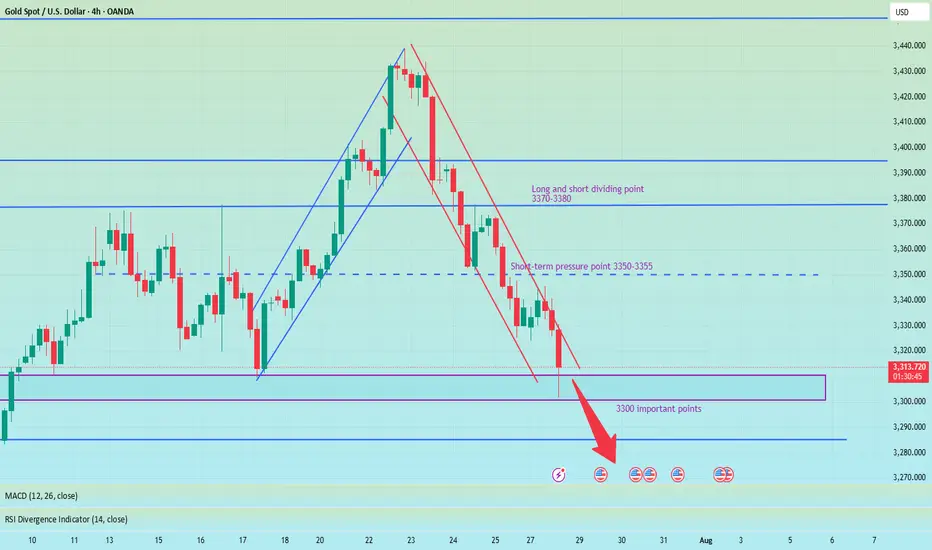
How to plan for the evening, pay attention to the 3300 markAfter the shorts took profits, gold consolidated in the 3310-3300 area. Judging from the daily chart, the decline in gold seems to have just begun, with the middle track of the Bollinger Band at around 3345 and the lower track at 3285. The possibility of falling below the 3300 mark cannot be ruled out in the evening. If gold falls below the 3300 mark, it may first hit 3295. If the decline continues, it may even hit the low of 3285-3275 below. However, if the 3300 mark can be effectively defended, then the possibility of maintaining the consolidation of 3300-3345 in the evening may be maintained. Therefore, it is not recommended to easily participate in transactions at the current position in the evening. It is mainly advisable to wait and see and pay attention to the breakthrough of the 3300 mark.
My premium privileges are about to expire, and subsequent trading strategies and analysis will be published in the group.
XAUUSDG trade ideas
Waiting for Gold to Dump| Area Of OpportunityWe can clearly see the overall trend of Gold, which is bearish. As the price action we see bearish FVA (Fair Value Areas/Swing Lows) being run. The anticipation is to wait for the latest Swing low to be ran, before looking for entries.
Why?
Because, the path towards our nearest POI (Point Of Interest) will have a low resistance. Meaning price might expand lower smoothly.

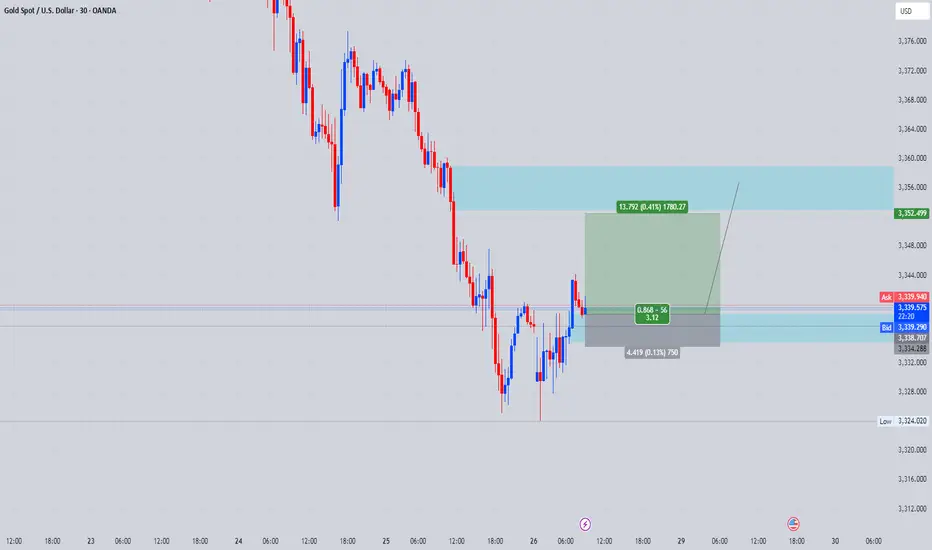
"XAU/USD Hits Major Demand – Is a Relief Rally Brewing?"🟡 XAU/USD (Gold) – Demand Zone Rejection in Play | Bullish Correction Ahead?
Timeframe: 30-Minute | Date: July 25, 2025
Created by: AllyPipsExpert
Indicators: Ichimoku Cloud, BOS (Break of Structure), Dynamic S/R, Trendlines
---
🔍 Technical Analysis & Key Insights:
🔸 1. Market Recap – Distribution & Downtrend Confirmation:
After the Break of Structure (BOS) near 3385, gold confirmed a bearish reversal following the distribution phase at the top resistance zone around 3445–3460.
Bearish momentum was sustained by a descending trendline, paired with a bearish Kumo (Ichimoku cloud) crossover.
🔸 2. Major Zone Tagged – Key Demand Area Tested:
Price has now reached the critical demand block at 3320–3340, a zone that previously initiated bullish impulse on July 18–19.
The current bullish projection (in blue) reflects potential short-term recovery or correction phase, following oversold conditions and historical support strength.
🔸 3. Bullish Reversal Potential – Short-Term Retracement?
The blue arrow reflects a likely bullish retracement toward 3360–3380, aligning with trendline retest and potential Kumo rejection.
Expect sellers to re-enter if price retests former BOS/imbalance zone, creating scalp or swing sell setups on confirmation.
---
🔧 Confluences & Technical Highlights:
Confluence Point Description
Demand Zone Strong previous accumulation at 3320–3340
BOS Retest Area Key liquidity level now acting as resistance
Ichimoku Cloud Price below cloud = bearish bias maintained
Descending Trendline Reinforces bearish structure unless broken
Price Action Rejection wick at demand + potential short squeeze
---
🎯 Trade Outlook:
🧭 Bias: Short-Term Bullish Rebound → Long-Term Bearish Continuation
🟩 Support: 3320 – 3340
🟥 Resistance: 3360 – 3385 (BOS & Trendline zone)
🔁 Scenario: Bounce → Retest → Continuation lower (unless breakout confirmed)
---
📘 Why This Chart Could Be Featured:
✅ Multi-layered Analysis: BOS, zones, cloud, price action, and psychological zones used together.
✅ Forward-Looking: Projects the next logical market reaction instead of just explaining the past.
✅ Clean, Structured, Educational: Layout and visuals guide the viewer through logical trade steps.
✅ Value-Packed: Provides actionable levels and flexible scenarios — helpful to traders of all levels.

XAUUSD NEW OUTLOOKXauusd buy from 3360
Tp1 3370
Tp2 3380
Tp3 3390
Stope Lose 3350
TRADE AT YOUR OWN RISK

XAU/USD: Golden Breakout to $3400?XAU/USD: Golden Opportunity Ahead XAU/USD is testing a key support at $3345, with a bullish setup forming on the 1-hour chart. Entry at $3345 offers a high-probability trade, targeting $3400 where the next resistance aligns. Set a stop loss at $3320 to manage risk below the recent support. A break above $3350 with strong volume could confirm the move. Watch for US dollar weakness as a catalyst. Trade smart!
#XAUUSD #GoldTrading #ForexSignals #TechnicalAnalysis #MarketAnalysis #DayTrading

Gold scalp buying opportunity before final dropGold has broken above the mini bull flag formation and is currently sustaining above the structure. The strategy is to patiently await a pullback into the highlighted buy-back zone, where a favorable entry opportunity may present itself. Focus remains on the projected flag targets, as the ongoing momentum suggests promising upside potential. Monitor price action closely.

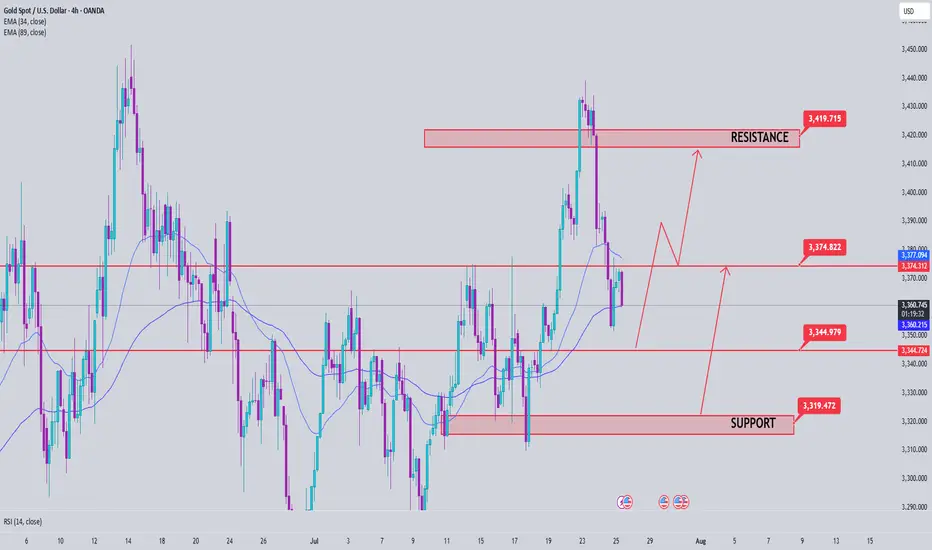
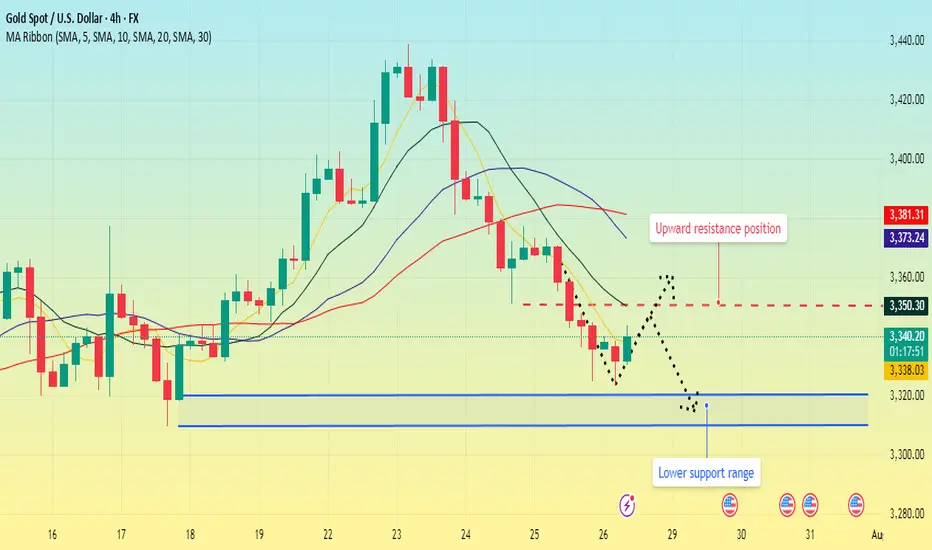
Gold price analysis July 25Gold Analysis – D1 Uptrend Still Maintains, But Needs New Momentum
Yesterday’s trading session recorded a D1 candle closing above the Breakout 3363 zone, indicating that buying power in the US session is still dominant. This implies that the uptrend is still being maintained, although the market may need a short-term technical correction.
In today’s Tokyo and London sessions, there is a possibility of liquidity sweeps to the support zone below before Gold recovers and increases again in the New York session.
Important to note:
The uptrend will only be broken if Gold closes below the 3345 zone on the D1 chart.
In this case, the 3320 level will be the next support zone to observe the price reaction and consider buying points.
For the bullish wave to continue expanding towards the historical peak (ATH) at 3500, the market needs stronger supporting factors, which can come from economic data or geopolitical developments.
📌 Support zone: 3345 – 3320
📌 Resistance zone: 3373 – 3418
🎯 Potential buy zone:
3345 (prioritize price reaction in this zone)
3320 (in case of breaking through 3345)
🎯 Target: 3417
Pay attention to 3350 gains and lossesGood morning, bros. This morning gold again tested last week's low near 3325. From the chart, gold may continue to rise this week, with tariffs approaching, the Fed's interest rate cut, and NFP data imminent. The current strength and weakness are at 3350-3355. If it can effectively break through and stand above, it is expected to continue to test the previous high point, which is also the long-short dividing point of 3370-3380.
From the daily chart, there is not much change in the operational range of gold in the short term, and the change in the 4H chart is more obvious. After the decline in the early trading, it is now rebounding. There is a possibility of closing positive at the low. If it is directly positive on Monday, then it will bottom out directly at the beginning of the week. If it refreshes the low on Monday, the low point of 3285 will be seen below. Therefore, today's market focuses on the continuity of long and short. Of course, according to the current changes, the biggest possibility is to continue to rebound at the low point, pay attention to the support of 3310-3300 below, and pay attention to the gains and losses of the high point of 3355 above.
Gold Buy OfferIn 4H time frame there is a good Demand area in 3309.5-3351 price.
Ofcourse it is a thick one and S/L would be too far. So I prefer to enter the Buy position in the middle it .( some price around 3330 if drops )

Long XAUUSD 2RXAUUSD finish doing the correction now looking toward long. I will consider taking Long on XAUUSD. Vamos !

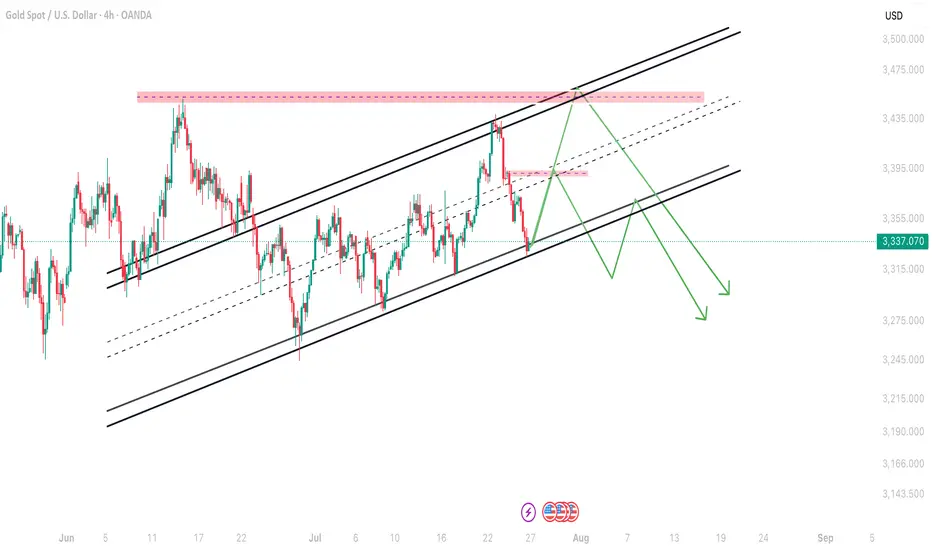
Gold 4H Channel structure modifiedAs you can see gold is moving in a channel in 4H time frame which is little modified as market goes on so according to me next move will be till protected order block i.e 3382-3388 and after that big fall expected and if any candle close above 3384 then 3451 is the next target for gold.
Gold Bullish idea so far . 23.7.2025we got the last bullish zone at 3375- 3326 ( marked as BC )
price must respect that zone to go for the next target at around 3500 .
This is ONLY the Bullish Idea .
price must Break 3454 to activate new ATH sequence targeting 3850 zone .

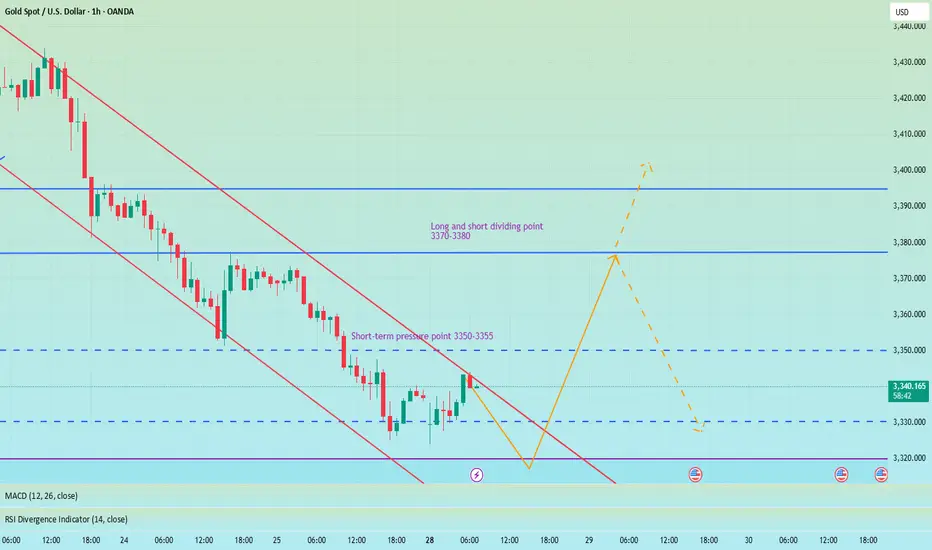
XAUUSD (Gold/USD) – 1H Chart Analysis (July 28, 2025)🔍 Technical Summary:
Market Structure Shift (MSS) detected after liquidity (LQ) grab.
Price formed a bullish break of structure confirming a possible trend reversal.
Entry taken near support (after LQ), targeting a supply zone above.
📊 Key Chart Elements:
LQ (Liquidity Grab):
Price swept previous lows, triggering stop-losses before reversing.
MSS (Market Structure Shift):
Break of internal structure confirms potential upside movement.
Blue Zone (Target Area):
A clear supply zone, likely to act as resistance.
TP (Take Profit) placed just below this zone.
SL (Stop Loss):
Positioned below the recent low (LQ) – tight risk management.
📈 Outlook:
Expecting bullish continuation towards 3,380+ zone.
If price respects support and structure holds, long entries remain valid.
Watch for reaction at the supply zone – potential rejection or consolidation.
⚠️ Disclaimer:
This is not financial advice. Always do your own research before trading.

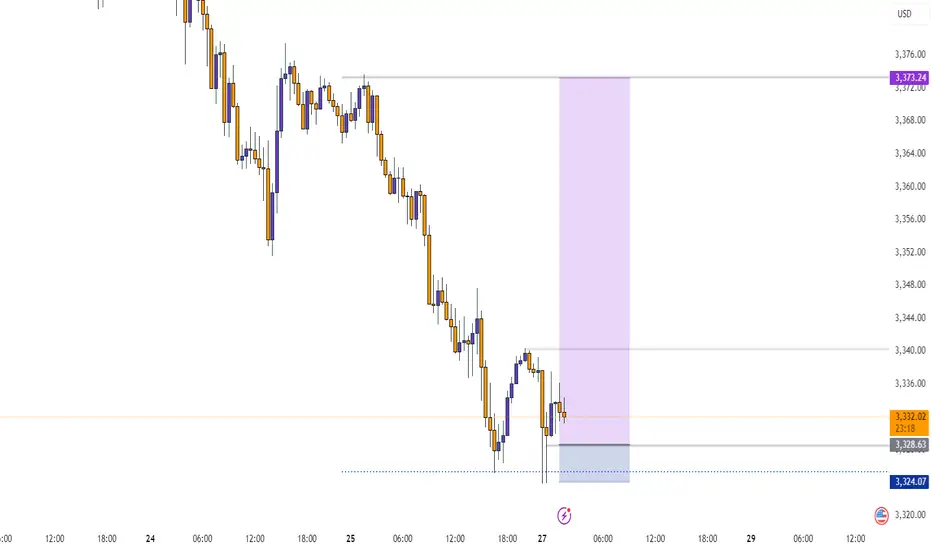
GOLD BUY M15 Gold (XAUUSD) 15-Minute Chart Analysis – July 28, 2025
Price is currently forming a potential bullish setup after a recent drop. A bullish order block area has been highlighted (purple zone), indicating a possible demand zone where buyers might step in.
Entry Zone: Around 3333 – current price region.
Stop Loss (SL): 3322 (placed below the demand zone).
Target: 3350 – marked as the main bullish target.
The expected move is a bounce from the demand zone, with multiple small retracements, leading to a potential breakout toward the resistance zone around 3350.


XAUUSDPrice action trading is a methodology where traders make decisions based on the interpretation of actual price movements on a chart, rather than relying primarily on lagging indicators. It involves observing and analyzing candlestick patterns, trend lines, support and resistance levels, and volume to identify potential trading opportunities and manage risk. The focus is on understanding the story the market is telling through its price behavior.

buy idea xauusdxauusd buy scenario
demand created we can long xauusd untill we reach the next supply
The US and Europe reached an agreement. Gold rebounded.At the current node, the EU and the US reached a tariff cooperation, 15% tariff + 600 billion US dollars for investment in the United States. The additional tariffs are considered a big deal, and the US has become the winner again this time.
Of course, this is a small negative for the current gold market.
From a multi-period analysis, the monthly chart price is still in a reverse K state. For the current situation, we need to pay attention to the gains and losses of the monthly highs and lows. The weekly chart shows that the price has continued to fluctuate at a high level recently. As time goes by, the weekly watershed is temporarily at 3320. After last week's high and fall, there is currently a further downward performance.
The four-hour chart shows that the price has continued to be suppressed after breaking through the four-hour support last Wednesday. The four-hour level resistance is currently around 3355, and the resistance level has moved up compared with the early Asian market. Therefore, we will pay attention to the pressure at this position in the future. If it fails to break through for a long time, it is likely to fall directly under pressure; pay attention to the support range of 3320-3310 below.
xauusdxauusd sell 3432 Gold is in an ascending channel. I think it could pull back from these areas. We need to see how the next 4-hour candle will close.

Daily Analysis- XAUUSD (Monday, 28th July 2025)Bias: Bullish
USD News(Red Folder):
-None
Notes:
- Price gap down and filled up the gap
- Looking for price to tap 0.618 fib level
- Potential BUY if there's
confirmation on lower timeframe
- Pivot point: 3300
Disclaimer:
This analysis is from a personal point of view, always conduct on your own research before making any trading decisions as the analysis do not guarantee complete accuracy.

BuyRejection Level
Daily Volume
Market Structure Shift
Asian Session
Trend Line Break
Untapped Order Point
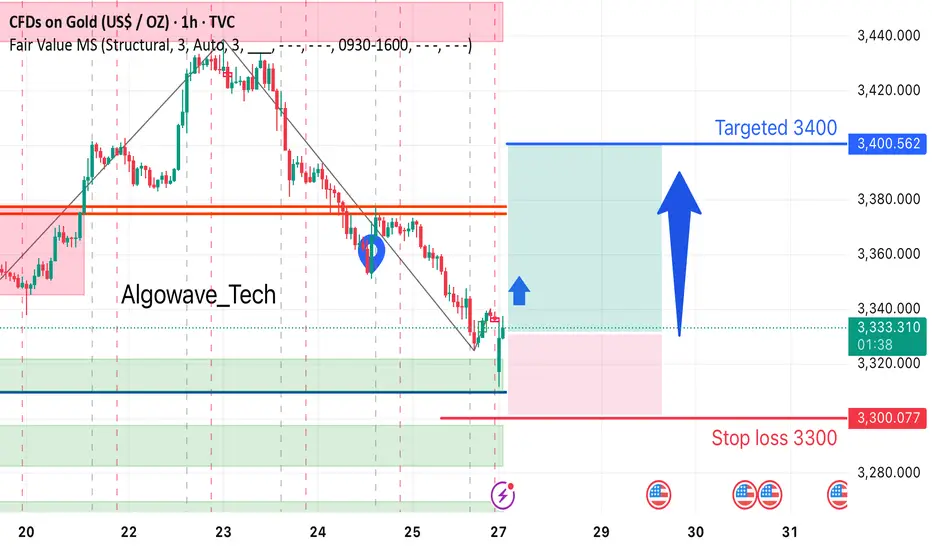
Gold Long Setup Alert!After a clean bounce from a strong demand zone, gold is showing potential for a bullish reversal.
🔹 Entry: Around 3331
🎯 Target: 3400
🛑 Stop Loss: 3300
Price has broken the bearish trendline, indicating possible momentum shift. Eyes on a push towards 3400 if bullish pressure sustains!
#GoldTrading #XAUUSD #AlgoWave_Tech #TechnicalAnalysis #BullishSetup #PriceAction #TradingSignals#Jasonwave_Fx1
Gold - The clear top formation!🪙Gold ( TVC:GOLD ) just created a top formation:
🔎Analysis summary:
Over the past four months, Gold has overall been moving sideways. Following a previous blow-off rally of about +25%, this cycle is very similar to the 2008 bullish cycle. Bulls are starting to slow down which will most likely result in the creation of at least a short term top formation.
📝Levels to watch:
$3.000
🙏🏻#LONGTERMVISION
Philip - Swing Trader
