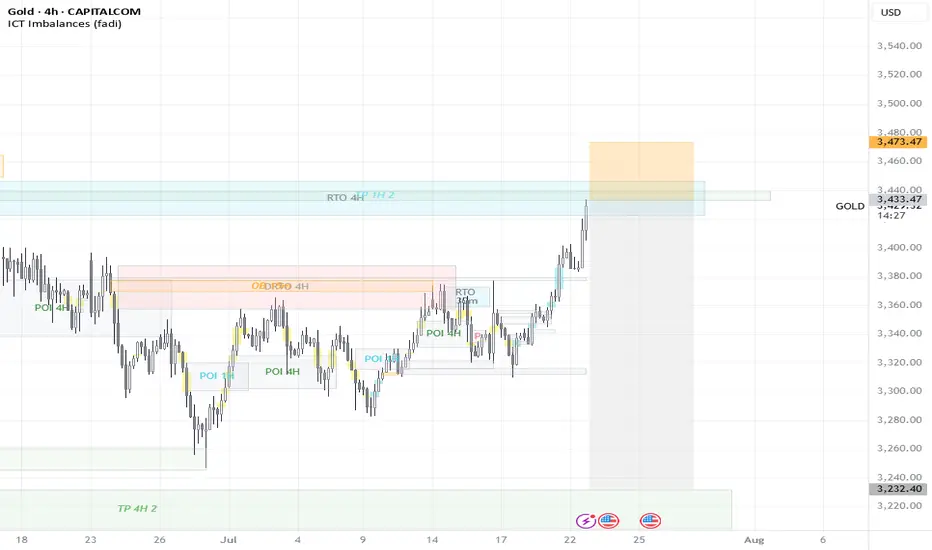
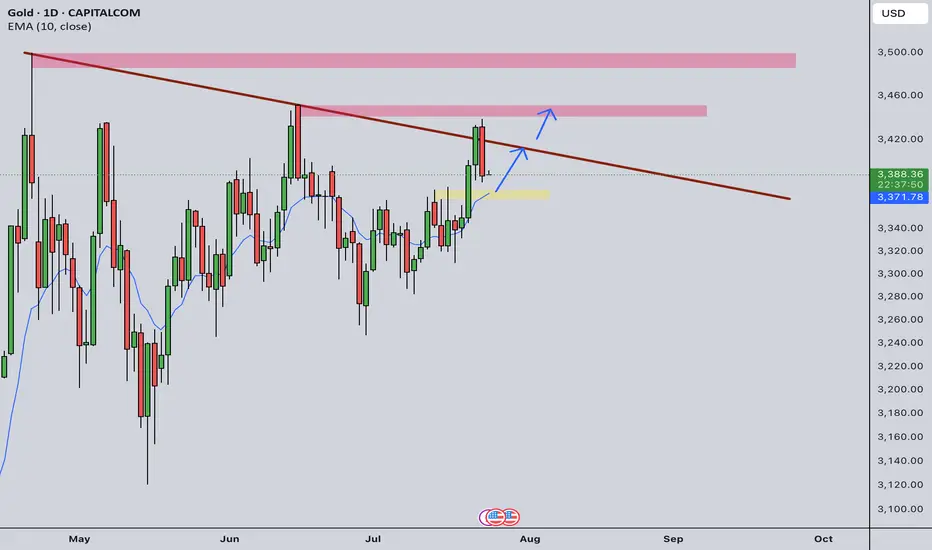
Gold – Range Break Incoming?Gold is still locked in a broad range, but recent price action suggests a possible breakdown. A break below the double bottom opens the door for a move toward the range midpoint.
XAUUSDG trade ideas

Gold - The clear top formation!🪙Gold ( TVC:GOLD ) just created a top formation:
🔎Analysis summary:
Over the past four months, Gold has overall been moving sideways. Following a previous blow-off rally of about +25%, this cycle is very similar to the 2008 bullish cycle. Bulls are starting to slow down which will most likely result in the creation of at least a short term top formation.
📝Levels to watch:
$3.000
🙏🏻#LONGTERMVISION
Philip - Swing Trader

XAUUSD correction in progress Next target 3460-3470XAUUSD was trading in a up trend and currently consolidating, At the fib 0.5 and support channel support trendline both overlap at 3410-3415 area from where the price may resume again up the target can be 3460. let us see.

GOLD - at Cut n Reverse Region, whats next ??#GOLD - market just reached at his ultimate area and keep in mind that if market break his current region than it will go further and nose dive..
NOTE: cut n reverse below our mentioned region..
Gold scalp buying opportunity before final dropGold has broken above the mini bull flag formation and is currently sustaining above the structure. The strategy is to patiently await a pullback into the highlighted buy-back zone, where a favorable entry opportunity may present itself. Focus remains on the projected flag targets, as the ongoing momentum suggests promising upside potential. Monitor price action closely.

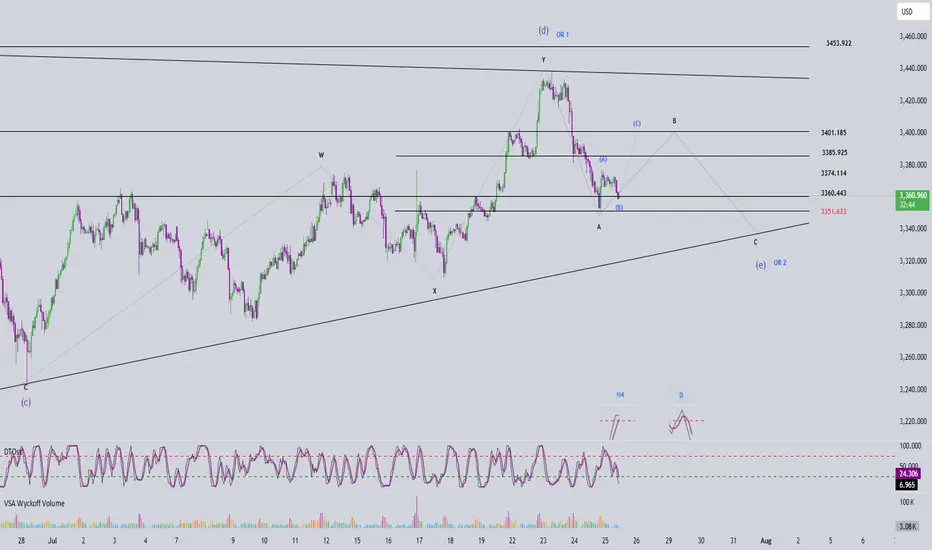
Elliott Wave Analysis – XAUUSD July 24, 2025📊
________________________________________
🔍 Momentum Analysis:
• D1 Timeframe: Momentum is currently in a downtrend, indicating that the dominant trend in the short term (at least until early next week) is likely to remain bearish or sideways.
• H4 Timeframe: Momentum has entered the oversold zone and is showing signs of a potential bullish reversal. This suggests that a corrective upward move may occur today.
• H1 Timeframe: Momentum is still declining and is expected to need around two more H1 candles before entering the oversold zone, implying that one more leg down may occur before a recovery begins.
________________________________________
🌀 Elliott Wave Structure Update:
Yesterday’s expectation of a breakout above the resistance zone at 3453 to confirm the start of a new bullish trend did not materialize. Instead, price dropped to the 3374 region, opening up two primary scenarios:
✅ Scenario 1: The correction is still unfolding
• Wave (d) in blue appears to be complete.
• The current leg is likely wave (e), the final leg in a contracting triangle correction.
• In this case, the lower boundary of the triangle and overlapping support zones will serve as key levels to watch for the completion of wave (e).
✅ Scenario 2: Wave 1 of a new bullish trend has completed
• The current decline is wave 2 in a new bullish impulsive sequence.
• The objective here is to identify the bottom of wave 2 to prepare for a potential buy entry into wave 3, which is expected to be stronger and longer than wave 1.
📌 Key difference between the two scenarios:
• Scenario 1 → Wave (e) completes, followed by wave 1 of wave 5.
• Scenario 2 → Wave 2 completes, followed by a powerful wave 3 of wave 5.
________________________________________
🧩 Current Wave Structure:
• A five-wave bearish structure is currently unfolding on the chart.
• According to Elliott Wave Theory, corrective patterns do not typically form five-wave structures.
• Therefore, this is likely wave A in a zigzag (5-3-5) formation.
• Possible targets for wave 5 within wave A:
o Target 1: 3374 – current reaction zone.
o Target 2: 3360 – next significant support level.
________________________________________
📌 Combining Wave Structure with Momentum:
The D1 momentum is firmly bearish, reinforcing the view that the market is undergoing a larger ABC correction.
On the H4 timeframe, momentum is oversold and showing early signs of reversal, aligning with the potential formation of wave B — typically a weak, sideways upward move. The likely resistance zone for the end of wave B lies between 3401 and 3410.
Meanwhile, H1 momentum is still falling and not yet in the oversold zone, suggesting there may be one more move down to complete wave 5. The ideal target for this final leg is around 3360.
Summary:
• D1 bearish → confirms ongoing major correction.
• H4 oversold → supports a potential weak wave B.
• H1 still declining → wave 5 may complete around 3360 before a recovery begins.
________________________________________
💼 Suggested Trading Plan:
For traders with limited experience or those not yet confident in reading live market signals, a Buy Limit strategy at clear support levels is recommended:
• Buy Zone: 3362 – 3360
• Stop Loss: 3352
• Take Profit:
o TP1: 3384
o TP2: 3400
🎯 For experienced traders, it is advised to observe price action at the target support zones and look for real-time reversal signals to optimize entry timing.
Gold to Take Support Gold at key support level, There is two chances.. where it can grab the liquidity... we will wait and watch... Cheers

Gold Sell 4hGold ready to sell ... See 4 Hour timeframe to get entry with your own confirmations..get partial entries with your confirmations.. check the fundamental analysis too
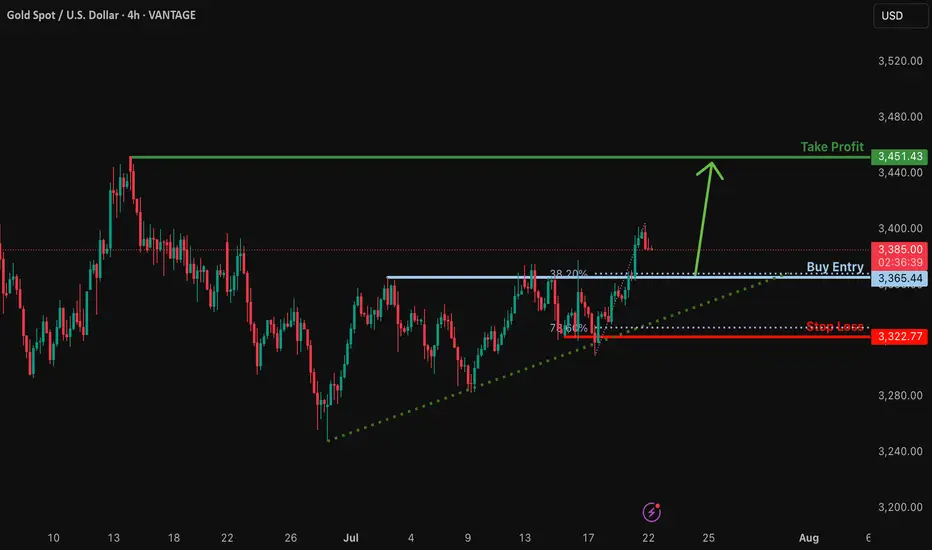
Bullish bounce off major support?The Gold (XAU/USD) is falling towards the support level which is a pullback support and could bounce from this level to our take profit.
Entry: 3,365.44
Why we like it:
There is a pullback support that lines up with the 38.2% Fibonacci retracement.
Stop loss: 3,322.77
Why we like it:
There is a pullback support that is slightly below the 78.6% Fibonacci retracement.
Take profit: 3,451.43
Why we like it:
There is a pullback resistance.
Enjoying your TradingView experience? Review us!
Please be advised that the information presented on TradingView is provided to Vantage (‘Vantage Global Limited’, ‘we’) by a third-party provider (‘Everest Fortune Group’). Please be reminded that you are solely responsible for the trading decisions on your account. There is a very high degree of risk involved in trading. Any information and/or content is intended entirely for research, educational and informational purposes only and does not constitute investment or consultation advice or investment strategy. The information is not tailored to the investment needs of any specific person and therefore does not involve a consideration of any of the investment objectives, financial situation or needs of any viewer that may receive it. Kindly also note that past performance is not a reliable indicator of future results. Actual results may differ materially from those anticipated in forward-looking or past performance statements. We assume no liability as to the accuracy or completeness of any of the information and/or content provided herein and the Company cannot be held responsible for any omission, mistake nor for any loss or damage including without limitation to any loss of profit which may arise from reliance on any information supplied by Everest Fortune Group.
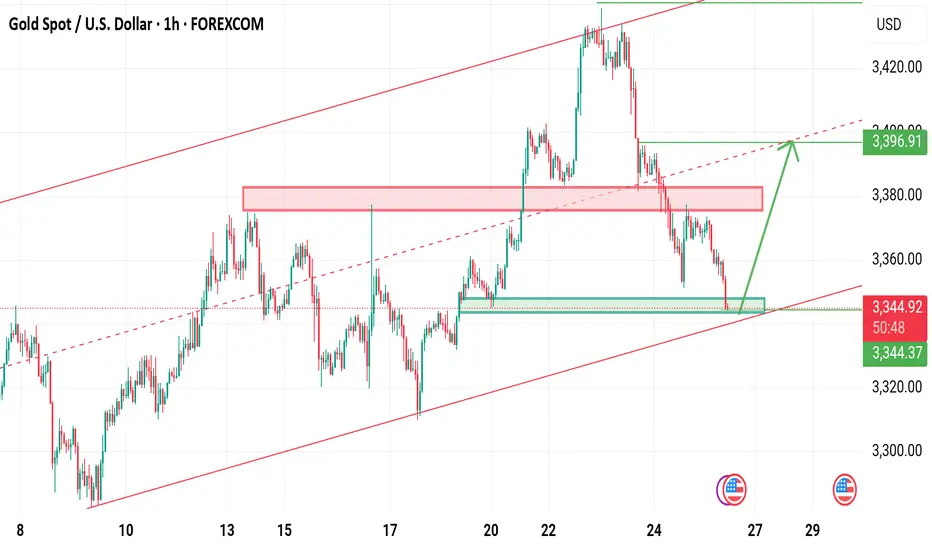
XAUUSD Last hope for buyers Gold is currently still holding rising channel last hope for buyers the bottom trendine .
Below 3335 buyers will be liquidate
What's possible scanarios we have?
▪️I'm gonna take buy trade from 3340-3338 area by following our rising Trend along with structural liquidity sweeps strategy, my target will be 3357 then 3368 in extension.
▪️if H4 candle closing below 3335 this Parallel moves will be invalid and don't look for buy till confirmation
Gold dips on profit-taking, long-term outlook still bullishGold prices continued to decline this morning as investors locked in profits following the precious metal’s recent rally above $3,400.
In the short term, further downside is possible if profit-taking persists and capital flows shift toward equities, especially as U.S. stock markets hover near record highs. However, gold remains a favored safe-haven asset for the long run amid ongoing global economic and geopolitical uncertainties.
Markets are also turning their focus to the upcoming Federal Reserve policy meeting on July 29–30. While the Fed is expected to hold interest rates steady this time, many investors still anticipate a potential rate cut in September. A low interest rate environment typically supports non-yielding assets like gold.

Gold Intraday Trading Plan 7/24/2025Yesterday in lower TF, gold was testing the resistance line for a couple of times but failed to maintain it. It quickly dropped back into the line and closed the day under 3400. Daily, it still looks bullish but in lower TF, it is still bearish.
Therefore, I will be cautious in placing buying orders today. As long as 3373 still holds, I am still bullish in gold. I will look for set up around this level and my 1st target will be around 3415. Final target for today is 3450.
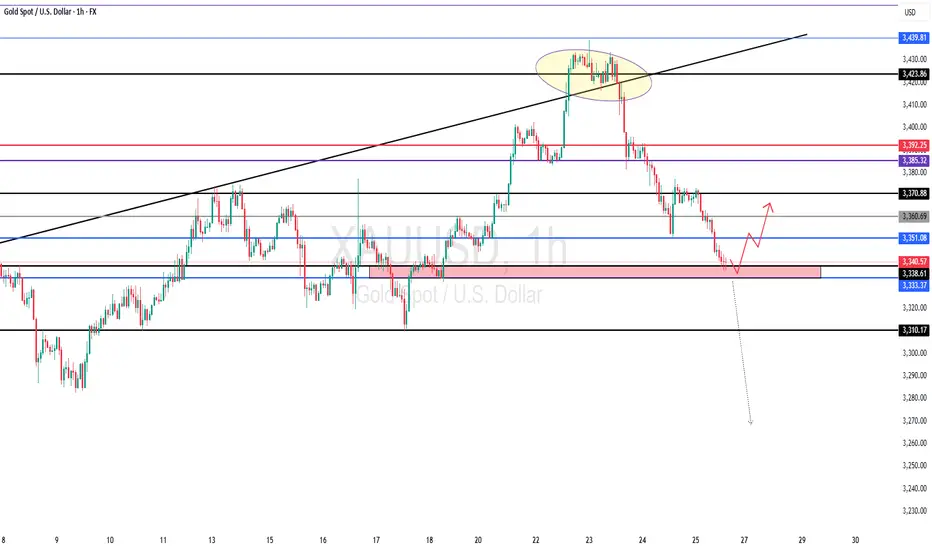
Gold Bounces Back After Testing Key Support📊 Market Drivers
• Gold dropped to around $3,352, touching a key support zone, then quickly rebounded to $3,373, gaining over +20 points.
• The rebound is supported by continued weakness in the US Dollar and slight easing in Treasury yields, keeping gold attractive as a safe haven.
• Although some optimism around US-Japan trade negotiations slightly reduced risk aversion, it wasn’t enough to push gold below support.
📉 Technical Analysis
• Key Resistance:
o $3,397 – $3,400: psychological resistance and near the next bullish breakout zone.
o If breached, next target lies around $3,420–3,445.
• Nearest Support:
o $3,356 – $3,364: recently confirmed support zone that triggered the current rebound.
o Deeper support at $3,326 – $3,320 if the rebound fails.
• EMA (EMA50):
o Price remains above the 50-period EMA, indicating bullish momentum in the short term.
• Patterns & Momentum:
o Market structure shows a "rising low" pattern — a bullish signal that buyers are stepping in at higher levels.
o RSI was briefly in oversold territory and now supports a recovery bounce.
o If $3,356 holds, the upside targets remain valid toward $3,397 → $3,439.
📌 Assessment
• Gold has confirmed strong support at $3,356–3,364, with the rebound from $3,352 as proof.
• Short-term uptrend remains intact, unless the USD strengthens sharply or unexpected macro news hits.
• If gold breaks below $3,356, it may retrace toward $3,326–3,320, but the upside potential is currently favored.
💡 Suggested Trade Setups
BUY XAU/USD: $3,356–3,364
🎯 Take Profit: 40/80/200 pips
❌ Stop Loss: $3,346
SELL XAU/USD: $3,397–3,400
🎯 Take Profit: 40/80/200 pips
❌ Stop Loss: $3,407

xauusd i think buy from here its not a bad ideatrend lines oder block fvg liquidity sweep choch higher high higher low.
Buy level GoldStrong buy expected from our marked level strong buy trend line and fresh bullish engulfing level
Wait LTF confirmation then buy

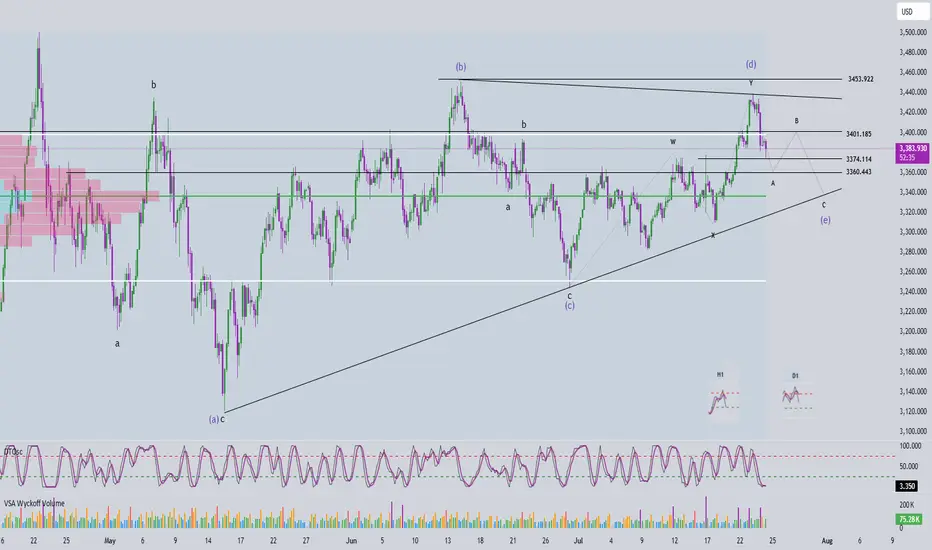
Elliott Wave Analysis – XAUUSD July 25, 2025📊
________________________________________
🔍 Momentum Analysis
• D1 Timeframe: Momentum is declining. Based on the current pace, it’s likely that only 1–2 more daily candles are needed before momentum enters the oversold zone → suggesting one more potential downward leg.
• H4 Timeframe: Momentum is about to turn bearish, indicating we might see a sideways movement or a slight drop in the short term.
• H1 Timeframe: Momentum is currently falling. By the end of the current H1 candle, momentum will likely enter the oversold zone → potential for a bullish reversal soon.
________________________________________
🌀 Elliott Wave Structure
• A clear 5-wave Wave A has already formed with no irregular patterns, so I’m expecting Wave B (black) to unfold as a 3-wave structure.
• Within this black Wave B, price is now developing Wave B (blue), meaning Wave A (blue) has already completed. Looking at the lower timeframe, I can identify a 5-wave structure → suggesting a zigzag correction in the form of 5-3-5 for black Wave B.
• Target for Wave B (blue): The 3360 area – this is a support level and also aligns with Fibonacci confluence, making it a strong candidate for the end of Wave B (blue) and a potential reversal zone.
• If price respects the 3360 level, then projected targets for Wave C (blue) would be around 3386 or 3402.
• However, if price breaks below 3351, the current wave count becomes invalid. In that case, we will shift to an alternate scenario and look for a buy opportunity near the lower edge of the triangle (c)-(e) and other confluence support zones.
________________________________________
🔄 Combining Momentum & Wave Structure
• D1 momentum shows weakening in this downward move, and the lower boundary of the triangle (c)-(e) is a prime area to look for the end of Wave e.
• Ideally, we want to see:
o A short-term bounce upward aligning with H1 momentum reversal to complete Wave C (blue).
o Then a confluence with H4 momentum turning bearish, indicating possible trend continuation or reversal.
________________________________________
📌 Trade Plan
• For experienced traders:
Watch closely around 3385 and 3401 for reversal signals to enter Sell positions.
• For beginners, I recommend the following limit setup:
o SELL ZONE: 3399 – 3402
o SL: 3501
o TP1: 3374
o TP2: 3351