GOLD - Price may bounce up to $3375 level from support lineHi guys, this is my overview for XAUUSD, feel free to check it and write your feedback in comments👊
Initially, the price action was confined within a descending channel before a decisive bullish breakout occurred.
This first breakout triggered a strong upward impulse, setting the stage for the current market structure.
The price is now consolidating in a wide flat range, bounded by support near the $3285 level and resistance at $3375.
An ascending support line is providing dynamic support within this consolidation pattern, indicating underlying buying pressure.
I expect a brief retest of this support line, which should act as a launchpad for the price to move higher.
The primary target for this long setup is the $3375 resistance level, marking the top of the current flat range.
If this post is useful to you, you can support me with like/boost and advice in comments❤️
Disclaimer: As part of ThinkMarkets’ Influencer Program, I am sponsored to share and publish their charts in my analysis.
XAUUSDK trade ideas

$XAUUSD: Macro InterconnectionsResearch Notes
Linking historic surface area and coordinates of consistent geometric expressions to document and learn more about the "texture" of self-organizing processes. The topology assumes that current price is a result of all history together that took to make the price end up where it is.
The fastest shortcut to figure out fractal hierarchy of waves and general direction is through Fractal wave marker .
Since angle of highs cycle is broken and price stayed above it for long time. That means it would be better to strip the chart starting from the lower levels, in order to get better coordinates for structural basis.
FWM helps to spot that distinctive part of broken waves that enables visual orientation in the rhythm. They manifest in its closest formative across cycles.
The angle that links the pattern through the time can have deterministic property, therefore we can use that direction for fibonacci channels to fill the gaps.
The fact that on log scale the bits from bullish phase of cycles contracted on price scale, I'd orientate with thin fibonacci channels (that is based on angle of lows of macro-cycle applied to previous ATH.
There are some other interconnection that are being tested.

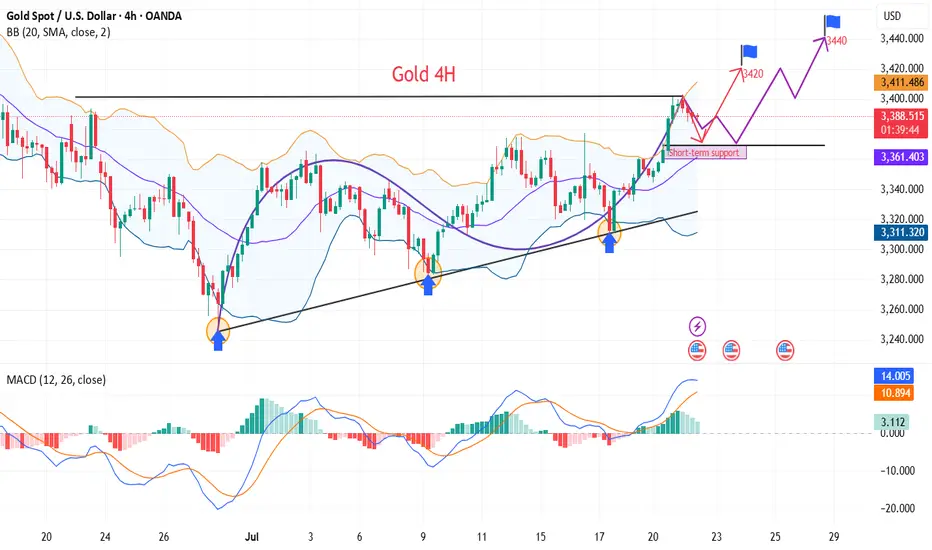
XAUUSD 4H Golden Cross preparing a massive break-out.Gold (XAUUSD) has been trading on a 3-week Channel Up, which is approaching its top but at the same time, it's been trading within a 3-month Triangle, which is also approaching its top.
The key here is the formation today of a Golden Cross on the 4H time-frame, the first since May 28. Being at the end of the long-term Triangle pattern is technically translated to the structure's tendency to look for a decisive break-out above its top that attracts volume (buyers).
It is possible to see an initial rejection followed by a break-out that will re-test the top of the Triangle as Support and then follow the long-term trend dynamics. Those are technically bullish and previous break-out in April targeted the 2.618 Fibonacci extension. Our Target remains a little below it at $3770.
-------------------------------------------------------------------------------
** Please LIKE 👍, FOLLOW ✅, SHARE 🙌 and COMMENT ✍ if you enjoy this idea! Also share your ideas and charts in the comments section below! This is best way to keep it relevant, support us, keep the content here free and allow the idea to reach as many people as possible. **
-------------------------------------------------------------------------------
Disclosure: I am part of Trade Nation's Influencer program and receive a monthly fee for using their TradingView charts in my analysis.
💸💸💸💸💸💸
👇 👇 👇 👇 👇 👇

Gold Approaching a Key Support, Potential Long OpportunityHi,
The setup is pretty clear from the chart.
Price has reached the lower boundary of the channel, which could offer a solid entry point for a long position, with a defined stop loss and take profit.

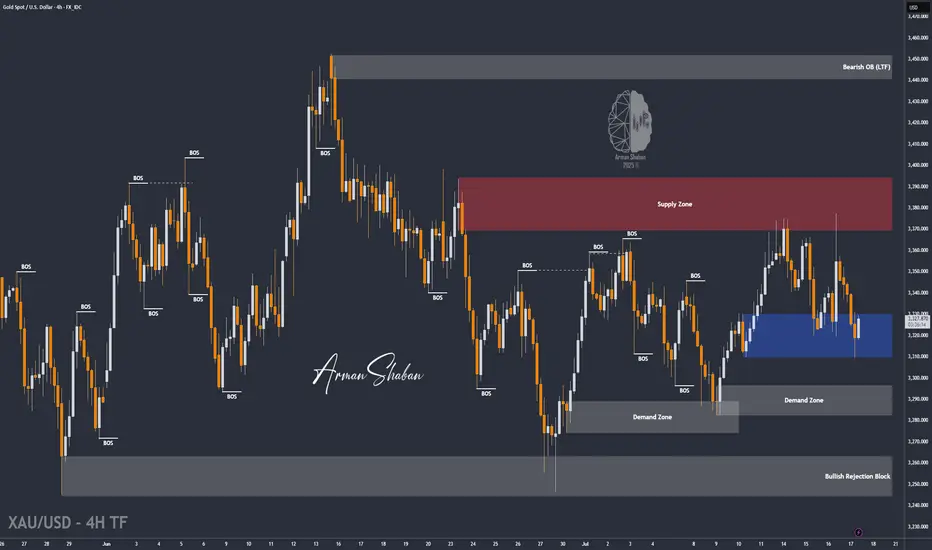
XAU/USD | First LONG to $3345, Then a Potential DROP Below $3300By analyzing the gold chart on the 4-hour timeframe, we can see that last night the price first tapped into the $3340 level, showing an initial push up to $3352. However, the drop intensified soon after, breaking the $3340 resistance and, according to the second scenario, falling to $3310. Upon reaching this key demand level, buying pressure kicked in, pushing the price back up to $3325. Now, the key question is whether gold can hold the $3310 support. If this level holds, we can expect a rise toward $3331 as the first target and $3345 as the second. After this move, a rejection from the $3345 area could trigger another drop, possibly pushing gold below $3300. So, first LONG, then SHORT!
THE LATEST VIDEO ANALYSIS :
Please support me with your likes and comments to motivate me to share more analysis with you and share your opinion about the possible trend of this chart with me !
Best Regards , Arman Shaban
Gold Elliott Wave Bearish SetupGold 8H Analysis:
The chart shows a potential Elliott Wave pattern completing its 5th wave. After hitting resistance near 3383, price reversed at point (4) and is projected to drop toward the support zone near 3281. Bearish momentum expected.

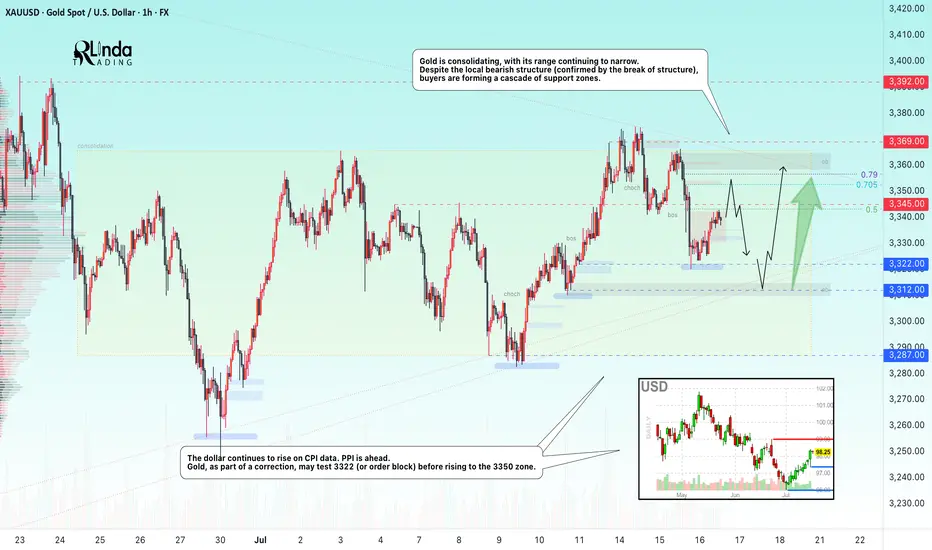
GOLD → Borders are shrinking. Consolidation continues...FX:XAUUSD is adjusting amid controversial CPI data and confirming the local bearish market structure. The PPI is ahead, and gold is consolidating, with its boundaries continuing to narrow...
Gold is recovering slightly but remains under pressure amid rising bond yields and a stronger US dollar. Higher inflation in the US reduces the chances of a quick Fed rate cut. Traders are cautious ahead of the PPI data release. If producer inflation exceeds forecasts, the dollar may rise again, putting further pressure on gold
Technically, we see consolidation in a symmetrical triangle pattern. Trading within the consolidation has a negative side - low volatility and unpredictable movements. The purpose of such movements is accumulation. However, decisions can be made based on relatively strong levels. In the current situation, we are seeing a rebound from 0.5 Fibonacci (I do not rule out a retest of the 0.7 zone before correction). The price may head towards the liquidity zone of 3322 before rising to the upper boundary of the consolidation and the zone of interest of 3350-3360.
Resistance levels: 3345, 3353, 3369
Support levels: 3322, 3312, 3287
The problem is that the price is in a consolidation phase. That is, technically, it is standing still and moving between local levels. You can trade relative to the indicated levels. Focus on PPI data. At the moment, gold is in the middle of a triangle and is likely to continue trading within the boundaries of a narrowing channel due to uncertainty...
Best regards, R. Linda!
Gold- Still needs to resolve the range🔸 Still Rangebound, But Not for Long
In yesterday’s analysis, I mentioned that two scenarios are in play for Gold:
1. Bullish above 3375
2. Bearish under 3320
Throughout the session, price action leaned toward the bearish side, and I aligned with that by opening a short position. It ended with a minor loss — just 50 pips, which is negligible considering I'm looking for a potential 1,000 pip move in the bigger picture.
________________________________________
🔍 What's Next?
As the title says, Gold still needs to resolve the current range before a clear directional move unfolds.
The same key levels discussed yesterday remain valid and relevant.
And since it’s Friday, today’s daily and weekly candle close will be critical in shaping expectations for next week.
________________________________________
📈 Bullish Case: Close Above 3360
• A daily/weekly close around 3360 would bring strong pressure on the 3375 resistance.
• That could lead to a bullish breakout from the ascending triangle pattern.
• It would also leave behind a bullish weekly pin bar (last week was a bullish pin bar too).
• This scenario would bring 3450 into focus — with 3500 and even a new ATH on the table in the coming weeks.
________________________________________
📉 Bearish Case: Close Near 3300
• A close near 3300 would signal a failed rally attempt
• That would expose 3250 support short term, and 3150 medium term.
________________________________________
🧭 Final Thoughts
At the moment, I’m flat and waiting for clearer confirmation later in the day.
The next move big will be defined by the weekly close — it’s as simple as that.
P.S.: It’s just a hunch , but I’m still leaning toward a break under 3300 as the next major move.
Disclosure: I am part of TradeNation's Influencer program and receive a monthly fee for using their TradingView charts in my analyses and educational articles.

GOLD ROUTE MAP UPDATEHey Everyone,
Quick follow-up on yesterday’s 1H chart update
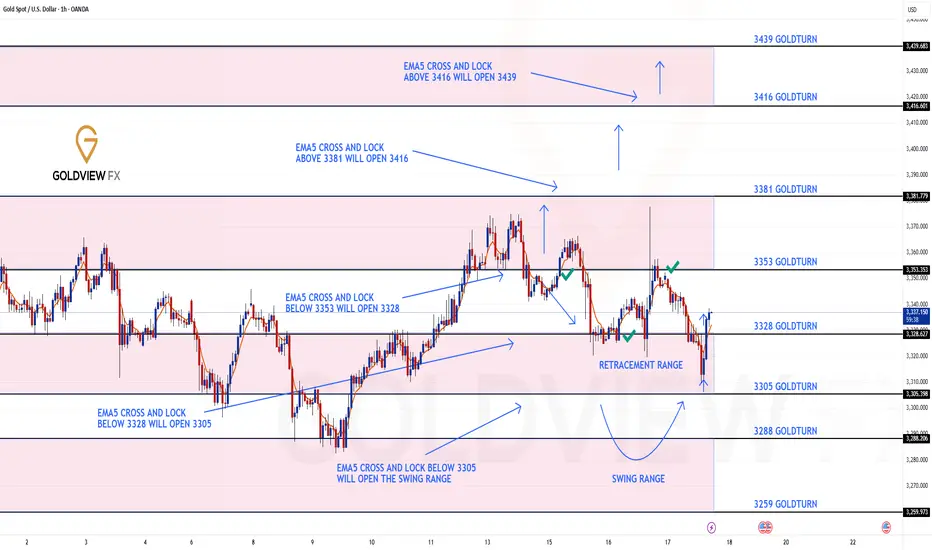
After hitting 3353, we did not see an EMA5 cross and lock above this level. That lack of confirmation was key and it validated a rejection right at 3353, leading to another drop into the retracement zone.
As per plan, that retracement provided yet another clean bounce, perfectly in line with our dip buying strategy.
We are once again looking toward 3353, and just like before, we will be closely watching for an EMA5 cross and lock confirmation to validate any continuation.
This kind of movement continues to confirm the power of patience, structure, and disciplined execution. No chasing just clean planned executions with high probability setups based on our EMA5 methodology.
We’re also still watching the 3381 gap a key magnet above, and a level we’ve been tracking since the Monday outlook. The roadmap remains unchanged. We’re trading the structure, managing risk, and letting confirmations guide the execution.
Updated Reminder of Key Levels:
BULLISH TARGET
3381
EMA5 CROSS & LOCK ABOVE 3381 opens
3416
EMA5 CROSS & LOCK ABOVE 3416 opens
3439
BEARISH TARGETS
3353 ✅ HIT
EMA5 CROSS & LOCK BELOW 3353 opens
3328 ✅ HIT
EMA5 CROSS & LOCK BELOW 3328 opens
3305
EMA5 CROSS & LOCK BELOW 3305 opens Swing Range:
3288
3259
As always, we’ll continue monitoring and sharing updates, as price reacts around these zones. Thank you all for the continued support, your likes, comments, and follows are genuinely appreciated!
Mr Gold
GoldViewFX
Gold's Short-Term Decline: What's Next?Hello everyone, what do you think about gold?
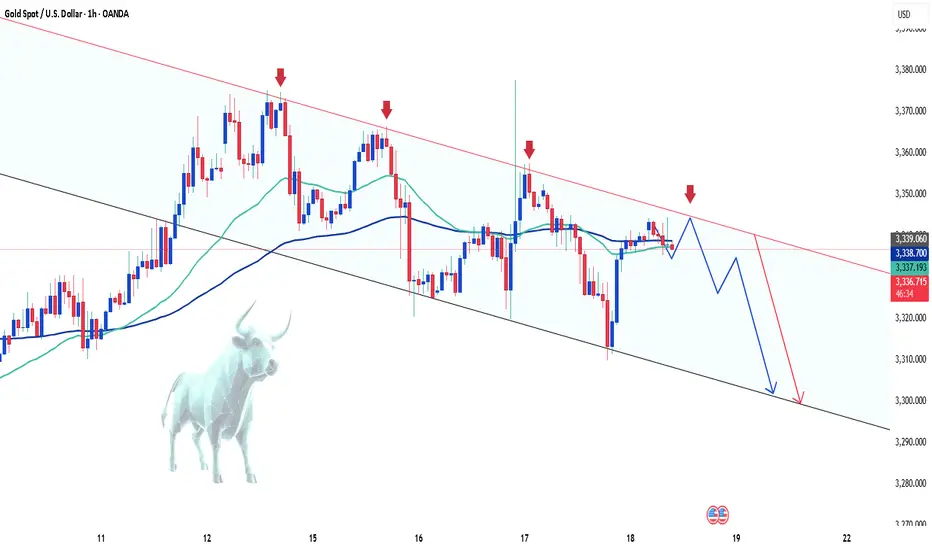
Today, gold continues its short-term downtrend. After new data was released at the end of yesterday’s trading session, the USD rose by 0.3%, and U.S. Treasury yields also increased, reducing the appeal of gold. Additionally, the latest unemployment claims data shows improvement in the U.S. economy, which has contributed to the drop in the precious metal.
As of writing, gold is trading around the EMA 34, 89 levels at 3,336 USD. With the recent news, the market is expected to maintain its current stance throughout the day, as no new significant updates are expected.
From a technical standpoint, the downtrend remains in place, with prices continuing to be capped below the trendline. The series of lower highs and lows could likely lead XAUUSD to test lower levels, with the possibility of reaching the 3,300 USD mark.
What do you think about the price of gold today? Let us know in the comments!
XAUUSD I Potential Pullback and More GrowthWelcome back! Let me know your thoughts in the comments!
** XAUUSD Analysis - Listen to video!
We recommend that you keep this on your watchlist and enter when the entry criteria of your strategy is met.
Please support this idea with a LIKE and COMMENT if you find it useful and Click "Follow" on our profile if you'd like these trade ideas delivered straight to your email in the future.
Thanks for your continued support!

Daily live trade with XAUUSD in 15m/30m/1h 20250723Daily live trade with XAUUSD in 15m/30m/1h 20250723
Gold Eyes 3365 – Breakout or Rejection?GOLD | Technical Outlook
Gold maintains bullish momentum as long as it trades above 3355, aiming to test the 3365 resistance level.
However, signs of rejection at 3365 may emerge, especially if the 4H candle closes below this level. In that case, expect a period of sideways consolidation between 3365 and 3342.
A confirmed 1H candle close above 3365 would signal bullish continuation toward 3373, with an extended target at 3395.
Key Levels:
• Pivot: 3355
• Resistance: 3365 / 3375 / 3395
• Support: 3342 / 3333
Outlook:
• Bullish above 3355
• Breakout above 3365 confirms further upside
• Rejection at 3365 may lead to short-term range-bound movement

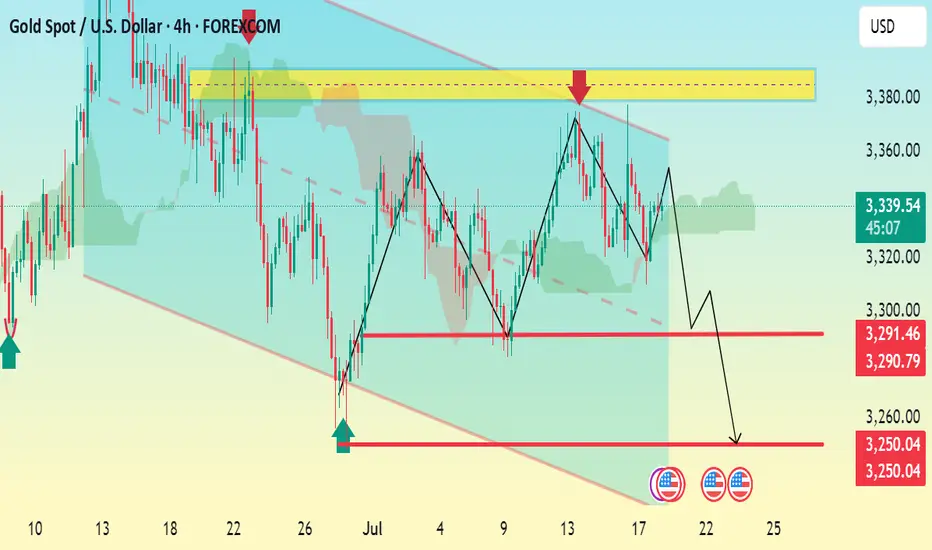
XAU/USD 4H Bearish Continuation Setup Analysis:Price recently rejected from the key resistance zone around 3,370–3,380 (highlighted in yellow).
A double top pattern is evident, indicating bearish pressure.
Price broke the rising trendline support and is forming lower highs.
Immediate support levels lie at:
3,291.46
3,290.79
A confirmed break below this support could send price toward the next major support at 3,250.04, which aligns with the projected move.
Bearish Bias:
As long as price remains below 3,344, the structure favors further downside.
Watch for a break and retest of the 3,291–3,290 zone for confirmation.
📉 TP Zones:
TP1: 3,291
TP2: 3,250
🛑 Invalid if price breaks above: 3,344
Gold selling pressure decreased at the end of the week⭐️GOLDEN INFORMATION:
Gold price (XAU/USD) remains under modest pressure during Friday’s Asian session, unable to build on the previous rebound from the mid-$3,300s. Renewed strength in the US Dollar, which extends its recovery from a multi-week low, acts as a headwind for the non-yielding metal. Additionally, fresh optimism surrounding the US-Japan trade agreement has dampened safe-haven demand, keeping gold on the defensive for the third consecutive day.
That said, lingering uncertainty over the Federal Reserve’s rate-cut trajectory, along with concerns about its independence amid growing political pressure, could limit the USD's upside. Meanwhile, rising geopolitical tensions—this time along the Thailand-Cambodia border—may lend some support to bullion. Investors now await US Durable Goods Orders data, which could influence the greenback’s direction and provide short-term cues for the XAU/USD pair going into the weekend.
⭐️Personal comments NOVA:
Gold prices are consolidating and starting to fall below 3400 to stabilize. The momentum for an early rate cut is waning.
⭐️SET UP GOLD PRICE:
🔥SELL GOLD zone: 3399- 3401 SL 3406
TP1: $3390
TP2: $3380
TP3: $3370
🔥BUY GOLD zone: $3310-$3312 SL $3305
TP1: $3325
TP2: $3333
TP3: $3345
⭐️Technical analysis:
Based on technical indicators EMA 34, EMA89 and support resistance areas to set up a reasonable SELL order.
⭐️NOTE:
Note: Nova wishes traders to manage their capital well
- take the number of lots that match your capital
- Takeprofit equal to 4-6% of capital account
- Stoplose equal to 2-3% of capital account

Gold CFD Trading: Practical Steps and Influencing Factors Gold CFD Trading: Practical Steps and Influencing Factors
Gold trading in forex offers a dynamic and potentially rewarding opportunity for traders. This article delves into the essentials of trading gold, from understanding its unique position as both a commodity and a financial asset to its price determinants and how to trade it.
Understanding Gold as a Trading Asset
In international gold trading, gold's role extends beyond being just a precious metal; it is a unique asset class. Its intrinsic value and universal appeal have made gold a cornerstone in financial markets for centuries. Unlike many other commodities, gold maintains its value not just in times of economic stability but also during volatility. This dual nature arises from its status as both a tangible commodity and a symbol of wealth, leading to its classification as a so-called safe-haven asset.
Investors often turn to gold when currencies and other markets face instability. Additionally, gold's relatively limited supply, juxtaposed with its consistent demand across industries and jewellery markets, ensures its lasting relevance in the trading world. Understanding these characteristics of gold is crucial for forex traders, as they form the foundation of its behaviour and pricing in the financial markets.
Fundamentals of Gold Trading
For those looking to learn to trade gold, it's essential to grasp the basics of how gold is traded. Primarily, gold trading is conducted through Contracts for Difference (CFDs), a popular derivative that allows traders to speculate on its price movements without owning the physical metal.
CFDs offer a flexible way to engage in gold trading, providing the ability to trade both rising and falling markets. This versatility is often cited as the best way to trade gold, especially for those who prefer short-term positions. Unlike gold stock trading, where investors buy shares in gold-related companies, gold CFD trading focuses directly on the price movements of the metal itself.
Via CFDs, gold is typically traded against the US dollar, denoted as XAU/USD. Here, XAU represents one troy ounce of gold, a standard unit of measurement in the precious metals market. Traders analyse market trends and use leverage to potentially enhance their opportunities. However, leverage is a double-edged sword, potentially magnifying losses.
Factors Influencing Gold Prices
Understanding the factors that influence gold prices is critical for anyone engaged in trading this precious metal. Here are key elements that traders usually monitor:
1. Economic Indicators: Key economic data such as GDP growth rates, employment figures, and inflation reports can significantly impact prices. Typically, weak economic performance or high inflation rates increase gold's appeal as a hedge against currency devaluation.
2. Monetary Policy: Central banks' decisions on interest rates and quantitative easing play a major role. Lower interest rates can decrease the opportunity cost of holding non-yielding assets like gold, thus boosting its demand.
3. Currency Strength: The strength of the US dollar is inversely related to gold prices. As gold is paired with the US dollar, rising USD will make gold cheaper.
4. Geopolitical Events: Political uncertainties and global crises often drive investors towards gold as a so-called safe-haven asset. Events causing economic instability can lead to a surge in prices.
5. Market Demand: Demand from industries like technology and jewellery and investment demand significantly influence prices.
6. Gold Trading News: News and reports related to mining, supply constraints, or large market transactions can immediately affect prices.
How to Trade Gold
Trading gold effectively requires a combination of well-chosen strategies, relevant indicators, and insights from trading signals. A comprehensive gold trading tutorial is a great starting point for understanding the mechanics of the market.
One of the best strategies to trade gold is following the trend. This involves identifying the direction of the market trend and making trades in alignment with this trend. For instance, if gold is on an upward trend, a trader might take a long position, and vice versa for a downward trend.
Regarding the best indicators for gold trading, traders often rely on tools like Moving Averages to identify trends, the Relative Strength Index (RSI) for overbought or oversold conditions, and MACD for momentum and trend changes.
Additionally, utilising gold trading signals can be effective. These signals, provided by market analysts or automated systems, offer assumptions on when to enter or exit trades based on market analysis. However, traders usually use these signals as a guide rather than a definitive command, combining them with their own research and risk management strategies.
Practical Steps for Gold Trading
Starting your journey in gold trading can be both exciting and challenging. Here are some practical steps to help you navigate this market:
- Educate Yourself: Before diving in, invest time in understanding the gold market. You can read books, watch webinars, and follow gold trading tutorials.
- Start Small: Begin with smaller investments to limit risk as you learn the ropes.
- Use Demo Accounts: Practice with demo accounts to gain experience without financial risk.
- Keep Up with News: Stay updated with global economic news, as they can significantly impact prices.
- Risk Management: Always use stop-loss orders to minimise potential losses.
- Review and Learn: Regularly review your trades to learn from successes and mistakes.
The Bottom Line
Embarking on your gold trading journey can be a transformative experience. With the knowledge and strategies outlined in this article, you can be well-equipped to navigate the market. Happy trading!
This article represents the opinion of the Companies operating under the FXOpen brand only. It is not to be construed as an offer, solicitation, or recommendation with respect to products and services provided by the Companies operating under the FXOpen brand, nor is it to be considered financial advice.
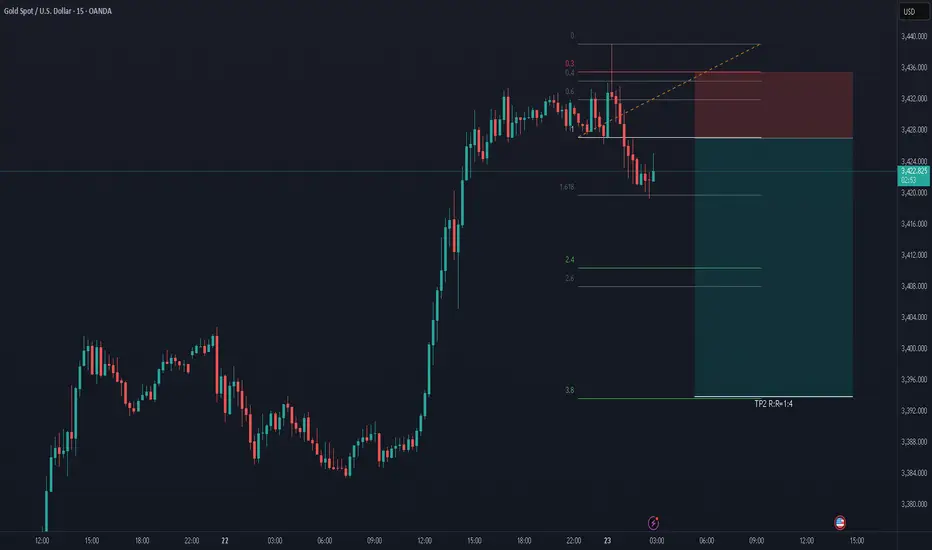
XAU/USD (Gold vs US Dollar) 1-hour technical analysis:📉 Support Zones:
3,312.35 – 3,300.00: Strong demand zone (marked in green) – this is your “buy” zone.
3,326.00 – 3,341.27: Intermediate support level, but may not hold under pressure.
📈 Resistance Zones:
3,359.40 – 3,373.04: Near-term resistance.
3,402.78: Key resistance from previous structure high.
🔁 Price Prediction Path:
The hand-drawn path suggests:
Short-term choppy consolidation or fakeouts.
A potential drop into the green demand zone.
Buy opportunity near 3,312 if a reversal signal appears.
Expected bullish reversal toward 3,359+.
📊 Volume Analysis:
Volume spikes near previous demand confirm strong buying interest.
Recent volume tapering indicates a slowdown in selling pressure.
✅ Potential Trade Setup:
Buy Limit: Around 3,312.00 – 3,305.00
Stop Loss: Below 3,300.00
Take Profit: 3,359.00 – 3,373.00
Risk/Reward Ratio: Favorable if entry is timed with confirmation (e.g., bullish engulfing, double bottom, or volume spike).

GOLD move up to 3419$Gold has the potential to start an upward move from the 3,343 and 3,331 levels. Reaching 3,419.86 is certain." CMCMARKETS:GOLD

3400 is no longer the target for gold. The answer is: higher
After gold touched 3,400, most people expected gold to fall back. This kind of rigid thinking is often out of touch with reality. During the rise, do you think it is better to short at highs or to go long on pullbacks?
💡Message Strategy
This round of gold's upward movement is not accidental. Behind it are significant changes in macro fundamentals. First, the overall weakening of the US dollar. The recent decline of the US dollar index to below the 98 mark reflects the market's concerns about the outlook for the Fed's policy. At the same time, the 10-year US Treasury yield also fell below 2%, and the actual yield fell, strengthening the relative attractiveness of gold.
More worthy of vigilance are the political rumors surrounding the re-election of Fed Chairman Powell. According to the Wall Street Journal, US Treasury Secretary Bessent once advised the president to avoid removing Powell from office to maintain the reputation of the Fed. However, speculation about Powell's possible dismissal remains, although Trump himself publicly denied the relevant plan.
In addition, Europe's actions have also disturbed the market. According to Bloomberg, citing EU diplomatic sources, if no agreement is reached before August 1, the EU will impose retaliatory tariffs on US products worth US$72 billion, covering areas such as automobiles, aircraft, alcohol and digital services. These messages have formed a risk resonance environment of "political uncertainty + economic friction", providing a natural long hotbed for gold.
Although the US economic data is slightly mixed - consumer confidence has rebounded, but inflationary pressure continues, with CPI approaching 3% in June - this has made the market full of doubts about the Fed's monetary policy path. Especially in the case of sparse economic data this week (only new housing data, initial claims and durable goods orders), the market focus is on the impact of political and policy conflicts on market confidence.
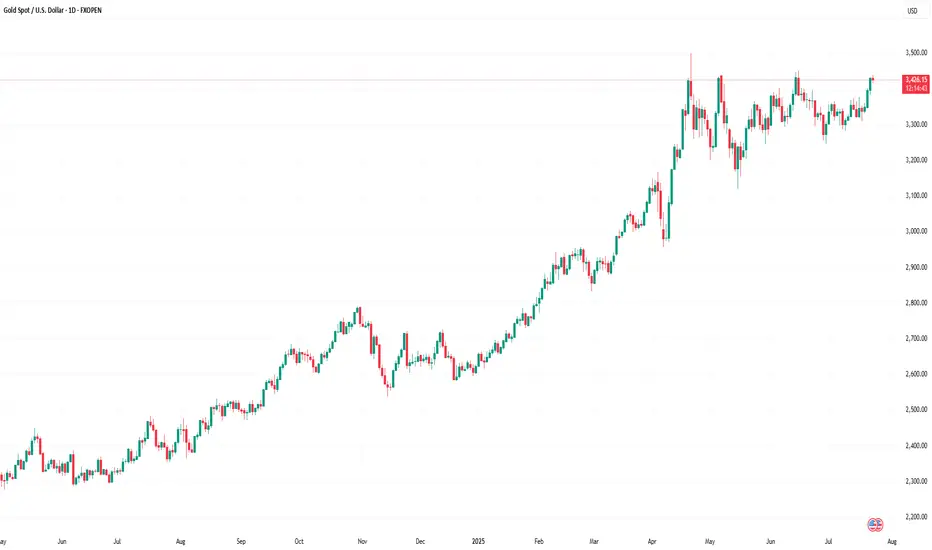
📊Technical aspects
From the daily candlestick chart, gold has recently shown signs of breaking upward after five weeks of sideways fluctuations. In terms of MACD indicators, the MACD histogram has turned from green to red, and the fast and slow lines have formed a "golden cross", strengthening the expectation of a short-term technical rebound.
For gold's lower support, pay attention to last week's high of $3,380, which is also the current 4-hour MA10 moving average position. Secondly, pay attention to the multiple declines in gold prices in the European session on Monday to test the stabilization position of $3,370. For gold's upper pressure, pay attention to the intraday high of $3,402, which is also the high point of gold's rise on Monday. After the decline in June, gold prices rebounded several times to test resistance here and further strengthened. The upper space can pay attention to the high point of the past three months at $3,440.
The previous five weeks of consolidation showed that the market was waiting for directional signals, and this breakthrough of the 3,400 mark was achieved against the dual backdrop of a falling US dollar and rising political uncertainty in the United States, with the typical characteristics of "news trigger + technical confirmation".
If gold successfully stabilizes above 3400, the market will turn its attention to the two key resistance areas of 3451 and 3499, the year's high. Breaking through the former will open up space to test new historical highs upwards; combined with the current MACD golden cross pattern, if the capital side and fundamentals continue to cooperate, short-term accelerated rise cannot be ruled out.
💰Strategy Package
Long Position:3370-3380,SL:3350,Target: 3420,3440
XAUUSD M30 BEST BUYING ZONE 📈 Gold is in a strong buying trend!
As always, I follow the trend — and right now, the trend is bullish. Here's what to look for:
✅ Strong Buying Zone
Look to buy if you see a solid bullish candlestick confirmation in this area.
📍 Alternative Entry Point
If price sweeps below 3416, we’ll look for a potential buy opportunity there — but again, only with candlestick confirmation.
🔓 Open Your Layers
Be prepared for both setups. Follow the market reaction and adapt accordingly.
⚠️ Risk Management is Key
No matter how strong the trend looks, always stick to your risk management rules. Discipline protects profits! 💼
🚀 Let’s ride the trend and stay smart!

XAUUSD Daily Sniper Plan – July 17-18, 2025Hello traders!
After yesterday’s high-volatility trap and NY session recovery, we now stand at a major structural junction. Buyers reclaimed 3310–3314 with precision, but price is pressing into multi-timeframe supply. Let’s break it down clearly
🔸 HTF Bias
Daily Bias: Bullish correction inside a larger range. Demand at 3310–3305 was swept and respected, but supply at 3347–3360 caps upside.
H4 Bias: Bullish flow into supply. Structure printed clean HLs from 3295–3310. However, current zone is full of short-term profit-taking risk.
H1 Bias: Bullish short-term trend. Price built higher lows from 3310, but now sits at 3340–3347 — reactive zone where momentum could fade if no breakout.
🔸 Key Structural Zones (with role)
🔺 Supply Zones (Above Price):
3347–3360 (D1/H4/H1 Supply)
🔹 Multi-timeframe confluence
🔹 Previous reaction + NY trap zone
🔹 Expect heavy rejection or false breakout wicks
3366–3385 (D1 Supply)
🔹 Final liquidity shelf for buyers
🔹 Only valid if 3347 breaks clean
🔹 Longs must wait for confirmation after breakout
⚔️ Decision Zones (Middle):
3335–3328 (Intraday Flip Zone)
🔹 M15-M30 structure control
🔹 Buyers can reload here on clean bounce
🔹 If price closes below, opens door for bearish momentum
🔻 Demand Zones (Below Price):
3314–3310 (H1/H4 Demand – Key Buy Area)
🔹 Institutional demand origin
🔹 Price tapped, swept, and reclaimed
🔹 Ideal sniper buys only on retest with bullish M15 BOS
3305–3295 (Deep Reversal Demand)
🔹 Extreme discount
🔹 Valid only if 3310 fails
🔹 High RR buys if liquidity sweep appears
🔸 Sniper Battle Plan 🎯
Scenario 1 – Fade from 3347–3360:
🔹 If rejection signs (M15 FVG + RSI divergence), short toward 3335, 3314
🔹 Only enter if NY open confirms exhaustion
Scenario 2 – Pullback to 3335–3328:
🔹 Ideal quick buys on bounce with confirmation
🔹 Watch for BOS on LTF for sniper entry
Today’s zones require real discipline: no rush, no panic — just clear steps, sharp entries, and clean rejections or retests. You already saw what 3310–3305 reacted. The next move? You plan it. You take it. You own it.
✨ Which zone are you watching for your next move?
Drop a comment, leave a 🚀🚀🚀and follow for more sniper-level clarity — every single day.
Let’s keep mastering this market. Together.
Disclosure: All plans are built on Trade Nation live feed. Educational only.
GOLD - SHORT TO $2,880 (UPDATE)Beautiful melt overnight, with Gold down close to 400 PIPS so far. Zoom in to the left & you'll see I've also added in a trendline which sellers have now start taking out. Another strong confluence of sellers taking control.
I warned you all last night not to sleep on Gold. My Gold Fund investors are in deep profits😉

XAUUSD Selling from bearish ob at 3444 readmore...📊XAUUSD Gold Update – 1H Timeframe
Fast Sell-Off in Progress
Price reacting sharply from the bearish order block at 3444, showing strong bearish momentum
Sell trade now active — eyes on the target zone at 3400, which aligns with the previous breakout level and key demand area
Watching price action closely as it approaches this support zone for potential reaction or continuation
🧠Clean move respecting OB and structure — trade management in focus
What’s your next move on Gold? Let us know below
👍 Like | 🔔 Follow | 💭 Comment for more fast & clean updates
#xauusd #gold
prevoiuse chart target win
