XAUUSD HAS FORMED BEARISH ENGULFING PATTERN. WHAT'S NEXT?XAUUSD HAS FORMED BEARISH ENGULFING PATTERN. WHAT'S NEXT?
XAUUSD has been trading bullish within the last day. The price touched the resistance level of 3,400.00. As a result, the bearish engulfing pattern has formed on 4-h chart.
An engulfing pattern is a two-candle reversal pattern where a smaller candle is followed by a larger one that completely covers it, indicating a potential shift in the trend. A bullish engulfing pattern, which signals a buy signal, occurs in a downtrend when a small red candle is followed by a larger green candle. A bearish engulfing pattern, which signals a sell signal, occurs in an uptrend when a small green candle is followed by a larger red candle. To trade, identify the pattern in a clear trend with high trading volume on the engulfing candle. Enter a buy position (for a bullish engulfing pattern) or a sell/short position (for a bearish engulfing pattern) after the engulfing candle closes, confirming a rebound from support or resistance. Set a stop-loss below the low of the bullish engulfing candle or above the high of the bearish engulfing candle. Aim for the next support or resistance level or aim for a 1:2 risk-reward ratio.
So, here I expect the price to move down towards local support of 3,365.00, where supposedly, the price will start to consolidate.
XAUUSDK trade ideas

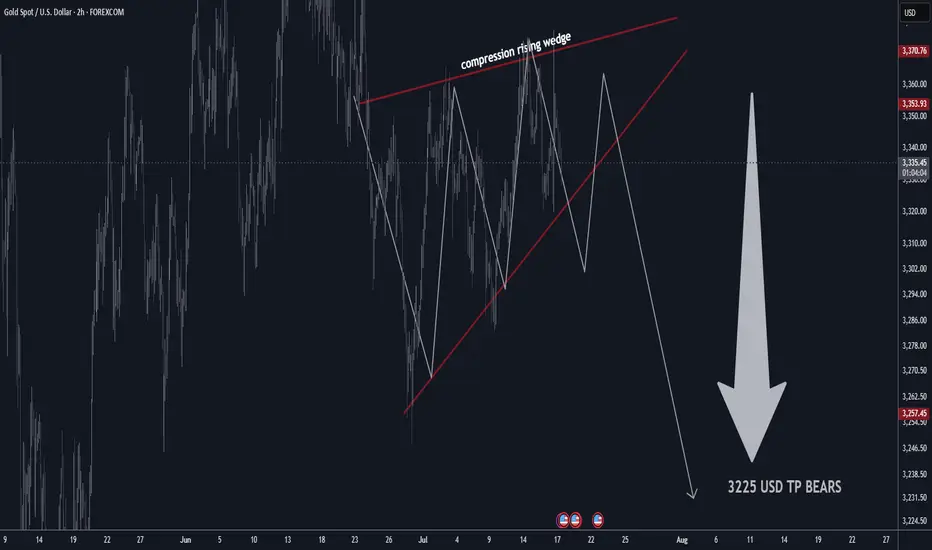
GOLD H2 Rising Wedge Expecting SellOFF TP BEARS 3225 USD📊 Gold Technical Outlook Update – H4 & 2H Chart
📰 Latest Summary Headlines
• Gold stalls near highs as technical compression signals possible breakdown
• Bearish rising wedge on 2-hour chart hints at sharp move lower
• Market volatility stays elevated amid global economic risks
• Short-term sellers targeting $3,225 if wedge pattern breaks
________________________________________
🏆 Market Overview
• Gold remains in a choppy range, struggling to clear key resistance.
• 2H Chart: Bearish rising wedge pattern identified, showing compression—expecting a potential breakdown soon.
• Overhead resistances: $3,410 / $3,460 USD will likely cap further upside.
• Major supports: $3,160 / $3,240 USD.
• If support fails, next key bear target is $3,225 USD.
• Range trading remains favored for now.
• Volatility likely to persist with no major bullish headlines on the horizon.
________________________________________
⭐️ Recommended Trade Strategy
• Bearish Setup (2H): Short sell gold at market on wedge breakdown.
o Stop loss: Above recent highs (set according to your risk tolerance and latest 2H swing high).
o Take profit: Target $3,225 USD.
• Continue to focus on selling near resistance, buying near support.
• Momentum: Watch for sharp moves as wedge resolves—be nimble!
• Always manage risk and adjust stop as price develops.
________________________________________
💡 Gold Market Highlights
• Safe-haven demand still strong due to tariffs, geopolitical tension, and U.S. fiscal concerns.
• Central banks & investors remain net buyers, but jewelry demand slides at high prices.
• Price action is dominated by institutional flows, with banks forecasting potential for gold above $4,000 next year—but short-term correction likely if wedge breaks.
• Current price: ~$3,358 per ounce. Compression suggests a larger move coming soon.
________________________________________
Summary:
Gold is at a crossroads, with a bearish wedge pattern building on the 2-hour chart. A breakdown could see a quick move to $3,225. Short sellers should act on confirmation, while bulls will look to reload at key support. Stay tactical!
XAUUSD: Bearish Bias SetupI am watching for a possible reversal in XAUUSD, predicting a rejection with a downside target around 3.300.
This downside target is reasonable based on this setup, as it is based on a previous bullish move, from which price could find support and bounce, or break below, and the downside momentum could start to continue down.
I am just sharing my thoughts on the chart, this is not financial advice. Always confirm your setup and manage your risk accordingly.

Gold (XAU/USD) Elliott Wave Analysis — 4H Chart🟡 Gold (XAU/USD) Elliott Wave Analysis — 4H Chart
As of July 22, 2025
Summary:
The chart shows a completed impulsive 5-wave rally, followed by a complex W-X-Y corrective structure, and a potential larger-degree downward move in progress.
Wave Structure Breakdown:
✅ Completed Impulse (Green Labels):
Wave I → II → III → IV → V structure is clearly defined, marking a major bullish phase.
Wave V completed around the peak (~$3,480 zone), suggesting a medium-term top.
🔁 Complex Correction (W-X-Y in Green and ABC in Red):
After Wave V, a zigzag correction (A-B-C) unfolded (marked in red).
Then a W-X-Y double correction emerged, possibly forming a larger corrective flat/complex pattern.
🔻 Projected Bearish Leg (ABCDE Triangle or Descending Channel - in Pink):
A new ABCDE structure seems to be initiating (marked in pink).
Wave (A) has likely started and is expected to extend towards the $3,180–$3,200 area.
After minor bounces (B and D), final Wave (E) targets the major horizontal support around $2,950–$2,980.
📉 Support Zone to Watch:
$2,950–$2,980 zone (green horizontal line) is the critical level from April lows.
A break below this could lead to accelerated downside movement.
🧠 Strategic View:
Short-Term: Bearish bias towards $3,180–$3,200, with corrective bounces.
Medium-Term: Watch the $2,950 level — likely to act as a decision point.
Long-Term: If $2,950 holds, bullish continuation possible; else deeper retracement to $2,700 or lower.
⚠️ Risk Points:
If price invalidates the (Y) wave high, this bearish structure is likely invalid.
Consider dynamic trailing stops if trading based on this projection.
✅ Conclusion:
Gold has likely completed a major 5-wave uptrend and is currently undergoing a large corrective structure. The chart suggests a high-probability scenario of further decline towards the $2,950–$3,000 region. Tactical traders may explore short setups while maintaining awareness of reversal zones and invalidation levels.
📌 Disclaimer:
This analysis is for educational and informational purposes only and should not be considered financial advice. Trading in financial markets involves significant risk, including the risk of losing your entire investment. Always do your own research or consult with a qualified financial advisor before making any trading or investment decisions. The author is not liable for any financial losses incurred based on the information provided.


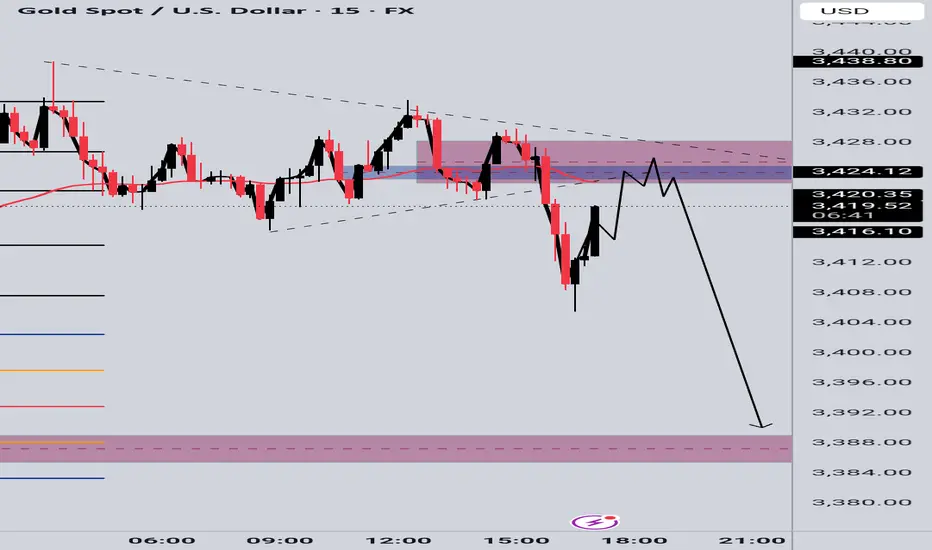
GOLD SELL SETUPWe failed the bullish momentum on previous chart ,now aiming for the continuation to the downside;
🔹 Entry Zone: 3425–3430 (Supply Rejection)
🔸 Trendline Break + Liquidity Sweep Confirmed
🎯 Targets:
— TP1: 3410
— TP2: 3388 (Major Demand Zone)
🔒 Bearish momentum building, watching for continuation toward the lower zone.
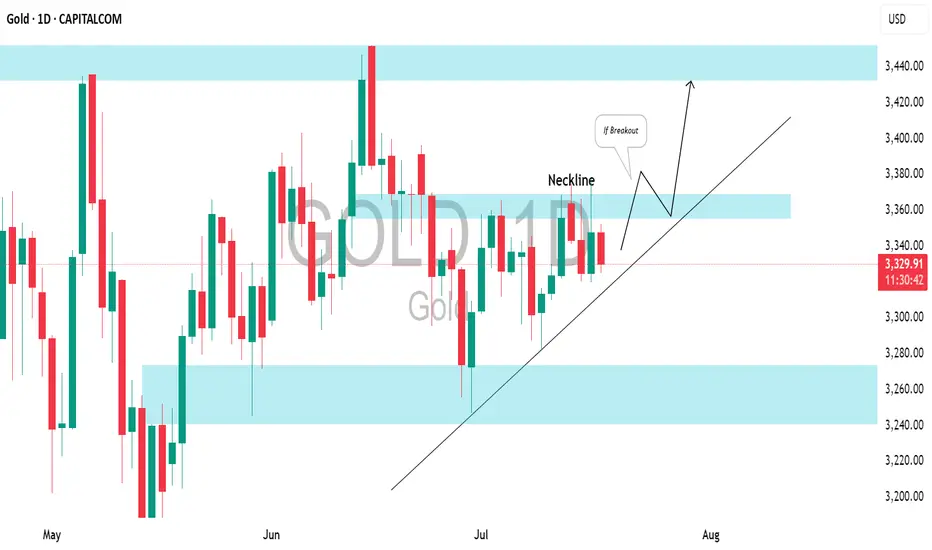
GOLD (XAUUSD): Bullish Accumulation PatternI spotted a clear ascending triangle pattern on a daily time frame.
To validate a bullish continuation, we need a breakout above the neckline.
A daily candle close above 3370 will serve as a strong confirmation, and we can expect a move up to at least the 3440 resistance level.
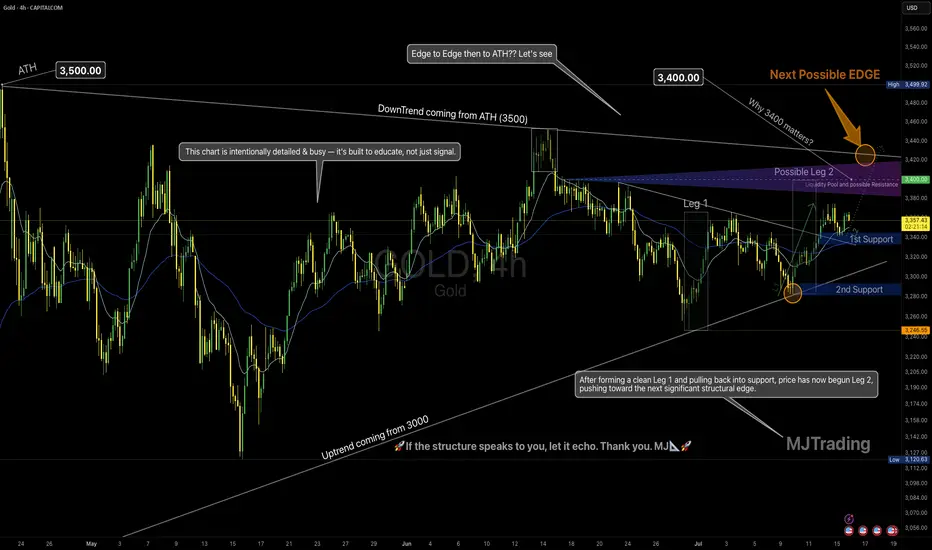
Leg 2 in Progress? | All Eyes on the Possible EDGE around 3400💡 GOLD 4H – MJTrading:
After forming a clean Leg 1 followed by a technical pullback into support, Gold has initiated Leg 2, pushing upward toward the next possible EDGE: 3400.
🟠 Why 3400 Matters
This zone is not just a round number:
It aligns with the long-term downtrend coming from the ATH (3500)
It’s the last reaction high before a deeper correction
There’s likely liquidity resting above — it’s where smart money may make decisions
This is where structure and psychology meet.
And end of 2 possible 2nd leg...
🔄 Possible Scenarios:
🟥 Scenario A – Rejection from the Edge (if could reach):
A reaction from this zone could lead to a pullback toward:
1st Support around 3340-3360
2nd Support near 3250 (also the uptrend line from 3000)
Use these zones to reassess momentum.
🟩 Scenario B – Breakout Above 3400:
A clean break above this structural edge opens the path for:
An “Edge to Edge” move back toward ATH (3500)
Possible higher timeframe trend shift — especially if retest holds
🧠 Our Strategy
We’re long-biased into the edge, not beyond it yet.
Let 3400 show its hand — we stay adaptive, not predictive.
🔍 This chart is intentionally detailed — it's built to educate, not just signal.
Focus on structure, sequence, and behavior — not just levels.
Lets Zoom in around the Breakout area...
And a Zoomout to Daily...
🧭 “If the structure speaks to you, let it echo.”
– MJTrading 🚀
📍#Gold #XAUUSD #TradingView #TechnicalAnalysis #ChartDesigner #MJTrading #MarketStructure #ForexIdeas #Edge
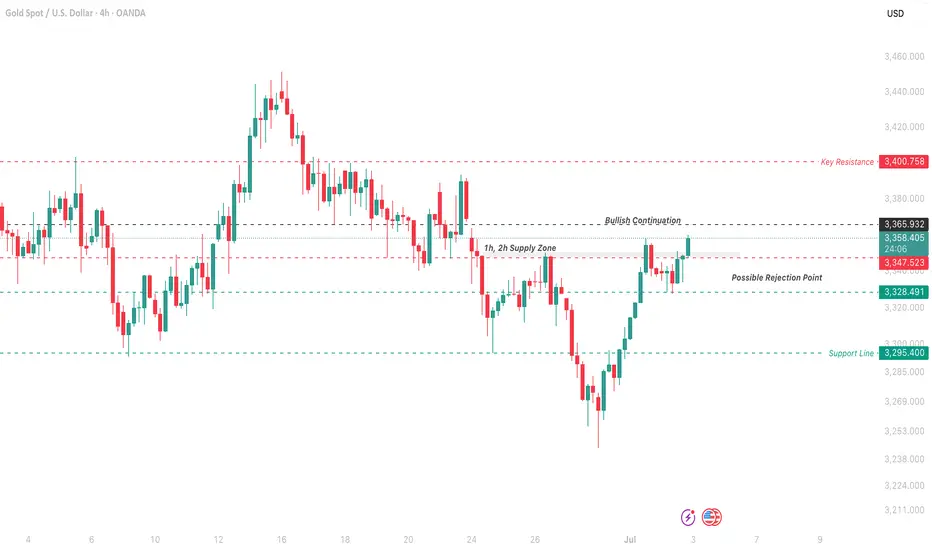
XAU/USD Struggles Below 3366, Bearish Pressure Remains ActiveXAU/USD Tests Supply Zone – Watching 3365 for Bullish Continuation
Gold is climbing amid global uncertainty and U.S. tariff concerns ahead of the July 9 deadline. But strong resistance is still in play.
The price is now testing the 1H–2H supply zone and has pushed past the pivot (3347–3352). A clear 4H close above 3365 will confirm bullish continuation.
Until then, upside remains capped. If price fails to sustain above 3365, a drop back toward 3328 and 3295 is likely.
Key Levels:
Resistance: 3352 – 3365 – 3400
Support: 3328 – 3295 – 3285
Pivot Zone: 3347–3352
Golden Opportunity Ahead: Wave 5 Bullish Breakout Incoming!After perfectly completing the **bearish Gartley pattern**, gold dropped precisely to the **target zone at 3,323**, just as predicted. This move confirmed the formation of **Wave 5**, signaling the end of the corrective phase.
Now, all signs point to a **strong bullish reversal**—and the next step is a powerful rally toward the predefined targets. This is a **prime buying opportunity** for traders looking to ride the wave!
### 🎯 **Buy Zone:**
- **Entry:** Around **3,323 USD**
### 📈 **Profit Targets:**
| Target | Fibonacci Level | Price (USD) |
|--------|------------------|-------------|
| TP1 | 1.0 | 13,447.875 |
| TP2 | 1.27 | 13,536.025 |
| TP3 | 1.618 | 13,649.640 |


Fake Pump, Real Dump?On the daily timeframe, XAUUSD is expected to be vulnerable to a correction toward the 3253–3325 area as the minimum retracement zone to potentially form a triangle pattern. However, in the worst-case scenario, indicated by the black label, XAUUSD may experience a deeper correction toward the 3093–3191 range.

XAUUSDXAUUSD shows short-term bearish pressure, with price failing to hold above recent resistance and momentum weakening.

XAUUSD
XAUUSD Updated in 15M :
The gold signal is marked on the chart based on the latest price changes and the supply and demand in the market. These points include the entry point, stop loss, and take profit.

Losing over and over again? Losing over and over again? The problem isn’t your strategy – it’s your mind.
Let’s be honest:
Are you repeating the same old mistakes… even though you know they’re wrong?
You know you shouldn’t enter a trade without confirmation – but you still do.
You know you should stick to your stop-loss – but you move it.
You know your mindset is unstable today – but you still open the chart and… click.
So stop blaming the market.
You’re not losing because the market is cruel.
You’re losing because you can’t control yourself.
💣 The most dangerous psychological trap: Knowing it's wrong – but doing it anyway
It’s not because you lack knowledge.
It’s not because your system doesn’t work.
It’s because your emotions are running the show.
Ask yourself:
Have you ever traded just to escape boredom, helplessness, or emotional emptiness?
Have you ever used the chart to hide from real-life pressure?
Have you ever placed a trade just to relieve stress?
If your answer is yes... then the problem isn’t technical.
It’s psychological – and deeper still, it’s emotional.
👹 The 3 emotional demons controlling your trading – and you don’t even realise it
1. FOMO – You fear being left behind more than you desire to win
You see price running → you see others making money → you feel the pressure.
You think: “I can’t miss this move!”
→ You jump in impulsively, without analysis.
FOMO reflects a lack of trust in yourself.
You don’t believe more opportunities will come.
You’re not trading with clarity – you’re reacting from fear.
2. Revenge Trading – You can’t accept the feeling of being “wrong”
Every loss feels like humiliation.
You can’t handle being “mistaken.”
So you fight the market back – like someone who’s lost all reason.
But the market doesn’t care if you’re hurt.
You’re projecting your frustration onto a system that has no emotion.
→ In that moment, you’re no longer a trader – you’re a gambler trying to ease emotional pain.
3. Overtrading – You measure your worth by how many trades you win
You only feel valuable when you’re making money.
You hate “doing nothing” – it makes you feel useless.
So you keep trading – endlessly, irrationally.
Overtrading reflects a deep fear of stillness and lack of control.
You seek validation… from your trading account.
🔍 Painful truth: You’re not losing because of the market – you’re losing because of unrealistic expectations
You expect to always be right.
You expect to get rich quickly.
You expect to prove something – to others and to yourself.
You pressure yourself to perform – and when results don’t come, your psychology collapses.
You’re not trading to beat the market.
You’re trading to fix something inside yourself.
✅ The solution? It’s not more knowledge – it’s emotional honesty
Stop trading the moment you feel out of control – whether you're winning or losing.
Keep an emotional journal daily – even on days you don’t trade. Be raw. Be real. No excuses.
Ask the right questions:
Am I trading to make money – or to soothe an emotional void?
Am I entering because of a setup – or because I’m afraid of missing out?
Do inner work outside of trading: meditate, exercise, heal emotionally, take breaks, talk to someone who gets it.
💬 Final thought:
Losing isn’t scary – what’s scary is never facing the real reason behind your losses.
Stop searching for the next shiny indicator.
Stop chasing strategies with a “90% win rate.”
You just need a decent system – and a strong mind to execute it.
True success comes when you no longer use trading to prove yourself –
but treat it like a calm, patient profession.
#TradingPsychology #EmotionalDiscipline #FOMOTrading #RevengeTrading #Overtrading
#MindsetMatters #TraderGrowth #SelfAwareness #TradingUK #ForexEducation #InnerGameOfTrading #ConsistencyIsKey #MentalEdge

XAUUSD – The assassin returnsGold is showing a weak reaction around the 3,375 zone — a previous supply area — with RSI dipping into oversold territory but failing to bounce significantly. The chart reveals layered FVG traps, hinting at a potential -1.5% drop toward 3,324 within the next 18 hours.
Bearish catalyst: The U.S. jobless claims have dropped to a 3-month low → labor market remains strong → Fed likely to keep interest rates high → stronger USD, weaker gold.
Preferred setup:
SELL if price gets rejected at 3,375
SL: 3,390
TP: 3,324 – 3,310

Xauad techinical analysis.Xausd techinical analysis next move posibale at h1 time frame not finchinical advice.

Today Gold Phucqed All Buyer today i think there is some us terriffs news which began gold to dump very badly , market liquidate the buyers , I am also a buyer and lost 9% today but here we go , im still a buyer , there is no strong logic behind it it's a gut feeling strategy 😅 now i am going for prayer ,

Gold Outlook for Today Todays outlook for Gold - I really cant share my strategy, if you want it, just send me a message and I will, It very simple, I think trading is simple, we just over think and complicate things
XAUUSD on swing Gold is currently holding rising channel along with the Range of 3340-3375
What's possible scanarios we have?
▪️I'm looking for Buying trade 1st we have 3342-3345 support area for potential buying spot.
Other then we have pending liquidity below 3340-3335 which I'm expecting the perfect buyying opportunity keep buy set targets at 3370 then 3400.
•Also we have buyying option If h4 closed above 3380 I will buy and target will be 3400.
▪️ keep in mind below 3330 we have sellers gap and our targets will 3305 then 3290
#XAUUSD


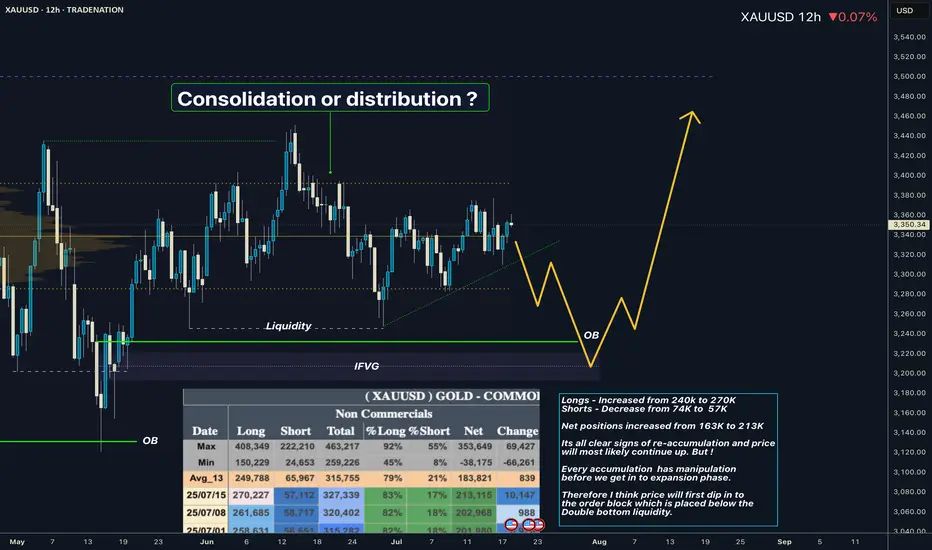
XAUUSD I Whats playing out in the range? COT overviewHey what up traders welcome to the COT data and Liquidity report. It's always good to go with those who move the market here is what I see in their cards. I share my COT - order flow views every weekend.
🎯 Non Commercials added significant longs and closed shorts at the same time. So for that reason I see the highs as a liquidity for their longs profits taking.
📍Please be aware that institutions report data to the SEC on Tuesdays and data are reported on Fridays - so again we as retail traders have disadvantage, but there is possibility to read between the lines. Remember in the report is what they want you to see, that's why mostly price reverse on Wednesday after the report so their cards are hidden as long as possible. However if the trend is running you can read it and use for your advantage.
💊 Tip
if the level has confluence with the high volume on COT it can be strong support / Resistance.
👍 Hit like if you find this analysis helpful, and don't hesitate to comment with your opinions, charts or any questions.
Analysis done on the Tradenation Charts
Disclosure: I am part of Trade Nation's Influencer program and receive a monthly fee for using their TradingView charts in my analysis.
"Adapt what is useful, reject what is useless, and add what is specifically your own."
— David Perk aka Dave FX Hunter ⚔️
Weekly Outlook: Gold Builds Pressure – Is the Big Move Coming?📆 Big Picture View
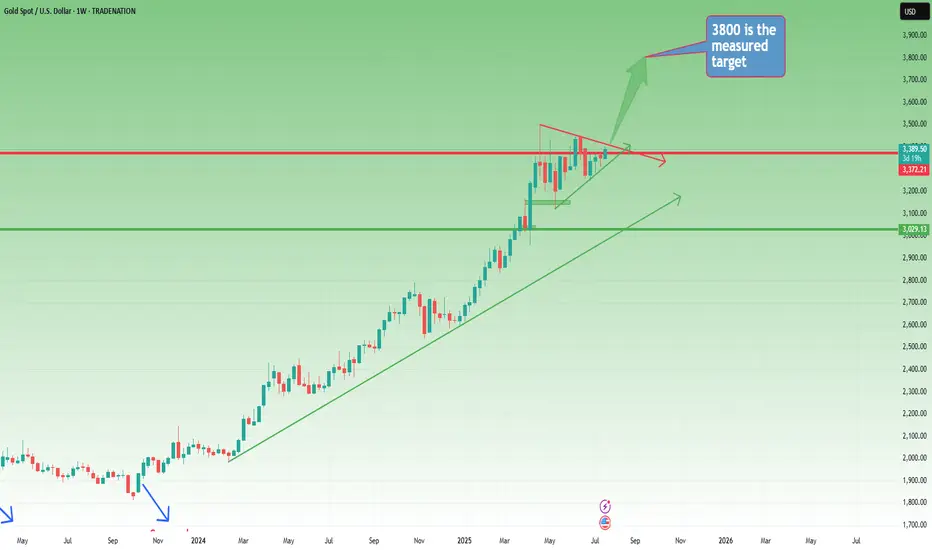
Since the start of 2024, Gold has been moving in a well-defined long-term bullish trend.
Yes, there were meaningful pullbacks along the way — but the direction was never in doubt. Step by step, Gold climbed over 15,000 pips in just over a year, reaching a new all-time high in late April.
📉 Post-ATH: A Period of Stabilization
After peaking, Gold shifted into consolidation mode, with price gravitating around the 3300 zone.
This sideways movement has been ongoing for the past three months, but it’s not a sign of weakness — it’s the market catching its breath.
On the weekly chart, this consolidation is now forming a symmetrical triangle, a classic continuation pattern that often appears mid-trend.
📐 The Technical Setup
- The symmetrical triangle shows compression of volatility
- Buyers and sellers are slowly converging toward a decision point
- A breakout is approaching, and when it comes, it could be explosive
🎯 What’s the Trigger?
- A confirmed break above 3450 would validate the triangle breakout
- That opens the door to quickly test the 3500 round figure
- The measured target for the triangle sits at 3800
Given the time Gold has spent consolidating (3+ months), this target could realistically be reached by year’s end
🧭 Strategic Takeaway
- As long as Gold holds above 3300, the bullish structure remains valid
- Breakout above 3450 is the green light for the next leg up
- Until then, the consolidation continues, and smart money prepares
📌 Conclusion:
Gold is building pressure. The weekly triangle is maturing.
This isn’t the end — it’s the pause before the next move.
Stay patient. Stay focused.
Because if 3450 breaks… 3800 is not a dream — it’s a destination. 🚀
Disclosure: I am part of TradeNation's Influencer program and receive a monthly fee for using their TradingView charts in my analyses and educational articles.
P.S: Here you have a short term analysis on Gold