#XAUUSD(GOLD): Strong Sellers Hold, Further Drop Incoming! God dropped from our area of entry yesterday as we initially expected. However, since the massive drop, we are now seeing some short-term correction in the prices. In the coming time, we can expect further price drops around 3280 or 3250.
If you like our idea, please like and comment.
Team Setupsfx_
XAUUSDK trade ideas
Double Top + Zigzag Complete: Are Bears About to Take Over Gold?Yesterday, the financial markets in general, including Gold ( OANDA:XAUUSD ) , acted like a roller coaster after the news of Powell's dismissal . After this news was denied , Gold returned to its main trend, which I published in my previous idea .
Gold is currently re-attacking the Support line , Support zone($3,326-$3,325) and 50_SMA(Daily) .
In terms of classic technical analysis , it seems that gold has formed a Double Top Pattern for support breakdowns, where a Support line breakdown can also be accompanied by a neckline breakdown .
From the perspective of Elliott Wave theory , it seems that Gold has managed to complete the Zigzag Correction(ABC/5-3-5) , and we should wait for the next bearish waves .
I expect Gold to break its supports and move towards $3,290 ; support breaks are best done with high momentum . An important price that can change the direction of Gold's downside is $3,350 .
Note: If Gold breaks the Resistance lines and forms an hourly candle above $3,351(Stop Loss (SL)), we can expect further Gold gains.
Gold Analyze (XAUUSD), 2-hour time frame.
Be sure to follow the updated ideas.
Do not forget to put a Stop loss for your positions (For every position you want to open).
Please follow your strategy; this is just my idea, and I will gladly see your ideas in this post.
Please do not forget the ✅ ' like ' ✅ button 🙏😊 & Share it with your friends; thanks, and Trade safe.

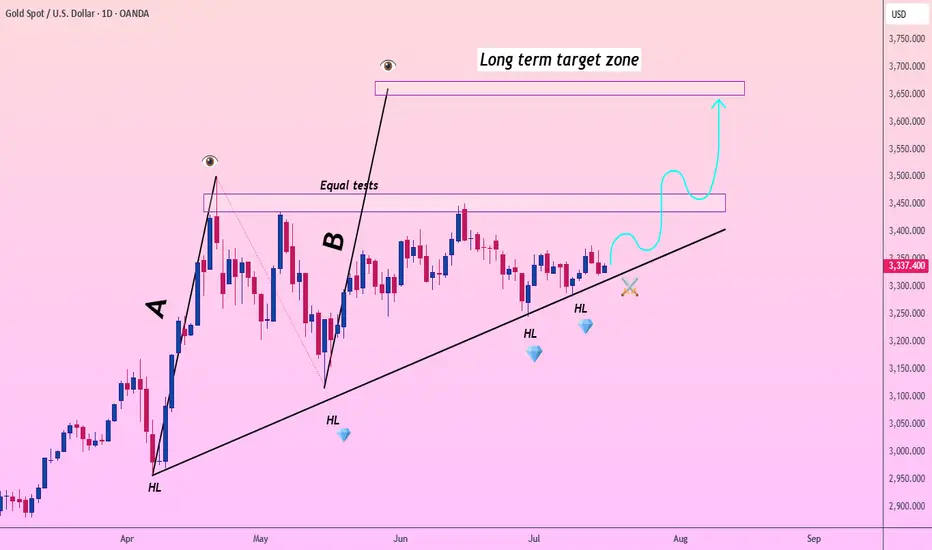
Lingrid | Gold ready to Make BoostOANDA:XAUUSD maintains a solid bullish structure with a clear series of higher lows (HLs) forming along the ascending trendline. After strong impulsive waves labeled A and B, price has repeatedly tested the resistance zone around 3450–3460, creating a double-top-like structure with equal tests. A confirmed close above 3460 would unlock the next leg higher in this ongoing uptrend.
📉 Key Levels
🔼 Buy trigger: Break and close above 3460
🟢 Buy zone: 3320–3340 (near HL and trendline)
🎯 Target: 3650–3700 (long-term breakout objective)
🚫 Invalidation: Drop below 3275 and trendline failure
💡 Risks
-Potential fakeout above 3460 without volume support
-Broadening consolidation range if breakout fails
-Macroeconomic catalysts (FOMC, CPI, geopolitical tensions)
If this idea resonates with you or you have your own opinion, traders, hit the comments. I’m excited to read your thoughts!
Learn What is PULLBACK and WHY It is Important For TRADING
In the today's post, we will discuss the essential element of price action trading - a pullback.
There are two types of a price action leg of a move: impulse leg and pullback.
Impulse leg is a strong bullish/bearish movement that determines the market sentiment and trend.
A pullback is the movement WITHIN the impulse.
The impulse leg has the level of its high and the level of its low.
If the impulse leg is bearish , a pullback initiates from its low and should complete strictly BELOW its high.
If the impulse leg is bullish , a pullback movement starts from its high and should end ABOVE its low.
Simply put, a pullback is a correctional movement within the impulse.
It occurs when the market becomes overbought/oversold after a strong movement in a bullish/bearish trend.
Here is the example of pullback on EURJPY pair.
The market is trading in a strong bullish trend. After a completion of each bullish impulse, the market retraces and completes the correctional movements strictly within the ranges of the impulses.
Here are 3 main reasons why pullbacks are important:
1. Trend confirmation
If the price keeps forming pullbacks after bullish impulses, it confirms that the market is in a bullish bearish trend.
While, a formation of pullbacks after bearish legs confirms that the market is trading in a downtrend.
Here is the example how bearish impulses and pullbacks confirm a healthy bearish trend on WTI Crude Oil.
2. Entry points
Pullbacks provide safe entry points for perfect trend-following opportunities.
Traders can look for pullbacks to key support/resistances, trend lines, moving averages or Fibonacci levels, etc. for shorting/buying the market.
Take a look how a simple rising trend line could be applied for trend-following trading on EURNZD.
3. Risk management
By waiting for a pullback, traders can get better reward to risk ratio for their trades as they can set tighter stop loss and bigger take profit.
Take a look at these 2 trades on Bitcoin. On the left, a trader took a trade immediately after a breakout, while on the right, one opened a trade on a pullback.
Patience gave a pullback trader much better reward to risk ratio with the same target and take profit level as a breakout trader.
Pullback is a temporary correction that often occurs after a significant movement. Remember that pullbacks do not guarantee the trend continuation and can easily turn into reversal moves. However, a combination of pullback and other technical tools and techniques can provide great trading opportunities.
❤️Please, support my work with like, thank you!❤️
I am part of Trade Nation's Influencer program and receive a monthly fee for using their TradingView charts in my analysis.
XAUUSD LIVE OUTLOOK – JULY 23, 2025Good evening, traders—let’s get this right, no mistakes. Gold hit 3,438, then pulled back and found support exactly in the 3,380–3,390 zone. Here’s your precise update:
🔸 HTF OVERVIEW (H4 → H1)
New High & Liquidity Sweep: A clean breakout to 3,438 invalidated every old supply.
Primary Demand: Price settled into the 3,380–3,390 H4 order block (untested FVG beneath). H1 confirms this blue zone as the critical buy area.
Invalidated Supply: No valid sell zones until we carve fresh structure above 3,438.
🔹 LTF PRECISION (M30 → M15)
M30 Flow: Spike to 3,438, then instant drop into 3,380–3,390. Volume spiked on the decline, then eased as price held.
M15 Structure: Inside 3,380–3,390, watch for a clean BOS above 3,395—that’s your bull‑bear pivot. Until then, this zone is the edge of the knife.
🎯 KEY ZONES & TRIGGERS
Buy Zone #1 (Live): 3,380–3,390
Confluence: H4 order block + unfilled FVG + H1 swing low
Trigger: M15 BOS above 3,395 and retest.
Buy Zone #2 (Backup): 3,350–3,360
For a deeper pullback—untested H4 demand.
Sell Zone: 3,420–3,438
Confluence: unfilled H4 FVG + premium supply
Fade only on clear M15 rejection (pin‑bar/engulf).
Decision Pivot: 3,395
Above = bullish continuation; below = stand aside.
➡️ ACTION PLAN
Longs: Enter on M15 close above 3,395 and retest; targets at 3,420 then 3,438.
Shorts: Only on rally into 3,420–3,438 with a decisive rejection candle.
Invalidation: A sustained break below 3,380 warns of a deeper flush toward 3,350–3,360.
🚀 CALL TO ACTION
If this nailed your edge, smash that Like, Follow @GoldFxMinds for daily sniper updates, and Boost this post so your fellow traders don’t miss these live levels! Drop a 🔥 if you’re ready to strike the next move.
Disclosure: I’m part of TradeNation’s Influencer program and receive a monthly fee for using their chart feed.
— GoldFxMinds

Gold Market Update – Key Zones for the Next MoveHey gold lovers! As the NY session wraps up, the chart is a painting of tension: gold boxed tight between major structure — and the real action is only about to start.
Bias:
At this stage, gold remains in a short-term bullish structure as long as price holds above the 3421–3428 decision area. A break and hold below this zone would shift the bias to neutral or bearish for the next sessions.
🎨 What’s drawn on the chart?
🟥 3472–3478 Supply Zone:
The ceiling, still untouched — this is where every failed breakout has left a “scar” on the chart. If we finally reach this zone, watch for wicks, rejections, or that rare, clean breakout candle. Sellers and patient bulls are both watching for “the drawing” to be complete.
🟩 3383–3390 Demand Zone:
The real floor. On your chart, it’s the base built by strong bounces and those long wicks buyers left behind. If price falls here, it’s not just a line: it’s a zone where new rallies are born and the market might “paint” a major reversal.
🟦 The Middle is Just Noise
Price is coiling, painting confusion in the center — but the edge zones are where structure and opportunity live.
Don’t be the trader who gets erased in the chop. Let price draw the story at supply or demand before making your move.
💡 Plan for Tonight
Wait for price to reach 🟥 supply or 🟩 demand.
Watch the “drawing” — will you see a wick, a rejection, or a true breakout?
Only trade once the story is clear at the edges.
Drop your best chart art or scenario below!
like🚀🚀🚀and 🔔 Follow for real structure updates & daily market stories — let’s turn trading into a masterpiece, together.
GoldFxMinds

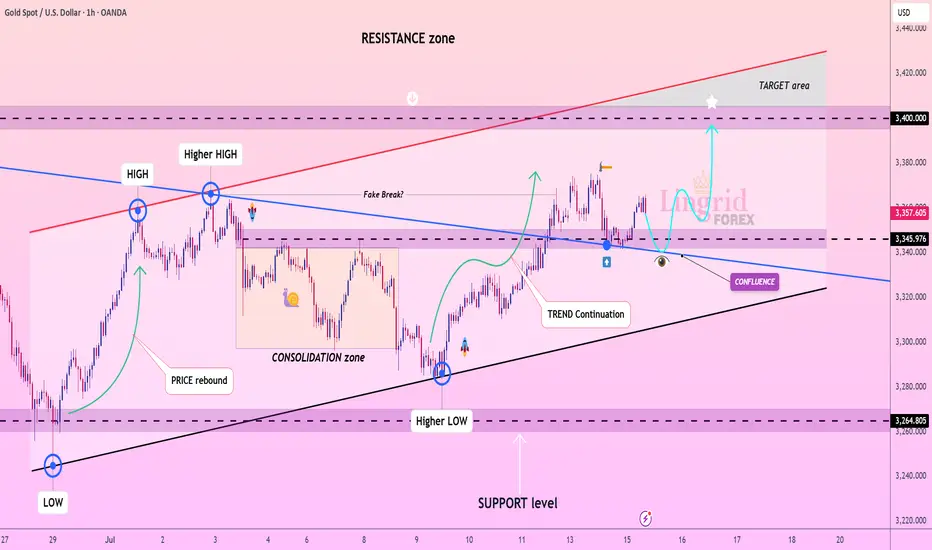
Lingrid | GOLD potential Bullish Move From Confluence ZoneOANDA:XAUUSD is forming a higher low above trend support, following a breakout from the consolidation zone and a bullish continuation leg. Price is currently pulling back toward the 3345–3350 region, which aligns with the previous breakout and key structure support. A successful retest of this area would provide confirmation for a renewed push toward the 3400 resistance zone. Momentum favors further upside if bulls defend the support and reclaim bullish control.
📉 Key Levels
Buy trigger: bullish bounce from 3345 with reclaim above 3360
Buy zone: 3345–3360 (trend support and previous breakout)
Target: 3400
Invalidation: drop below 3345 with sustained pressure cancels bullish thesis
💡 Risks
Weak volume on bounce could lead to range-bound price action
Global macro shifts may interfere with expected trend continuation
Another fake breakout near 3400 could trigger sharp rejection
If this idea resonates with you or you have your own opinion, traders, hit the comments. I’m excited to read your thoughts!
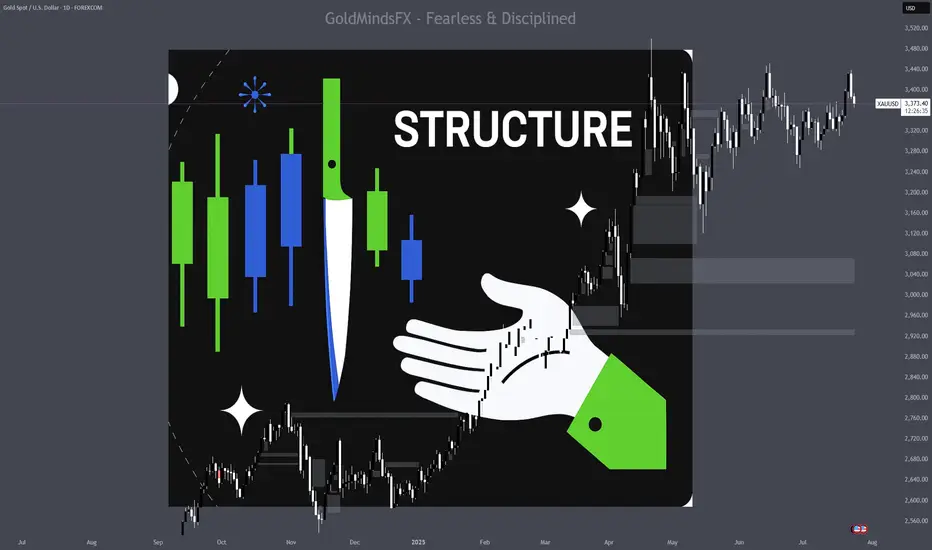
The Myth of Gold Reversals – Why Traders Keep Catching the KnifeGold is a master of deception.
It shows a clean wick into a zone, but reacts just enough to pull in early buyers or sellers — then rips straight through their stops like they weren’t even there.
The reversal looked real and the candles seemed perfect.
But the move? It was never meant for them.
This isn’t bad luck, but traders who survive aren’t trying to guess, they are the ones reading the reaction after the trap.
Let’s break down how these traps happen — and how Smart Money actually operates when XAUUSD is loading a real move.
🟥 Sell Trap – The "Instant Short" Mistake
Price pushes up into a clear reaction zone — maybe an OB, maybe an imbalance, a FVG, or a gap.
Structure looks stretched. Traders recognize a premium zone and decide it’s time to short.
The trap? Jumping in immediately on the touch, with no confirmation.
This is where Gold loves to trap sellers.
No M15 CHoCH/ BOS on M5 or real liquidity swept. Just a blind move and hope.
Price often pulls slightly higher — sweeping internal liquidity, triggering SLs — then shows a real rejection.
📌 Here’s what needs to happen before selling:
• First: look for a liquidity sweep (equal highs or engineered inducement)
• Then: price must shift — CHoCH or BOS on M15 or M5
• Finally: confirmation via bearish engulf, imbalance fill, or break + retest
• For experts: M1 can offer refined sniper triggers with minimal drawdown
💡 If none of this appears, it’s not a setup — it’s a trap.
🟩 Buy Trap – The "Wick Bounce" Illusion
Price taps a demand zone — again, a refined OB or imbalance, liquidity zone.
A long bullish wick forms. Some candles pause. It looks like a reversal.
But there’s no shift.Just hovering.
Many jump in long the second they see the wick. And then price breaks straight through.
📌 Here’s how to flip this trap into a real buy:
• Let price sweep liquidity below the zone — signs of a purge - true wick bounce
• Watch for a CHoCH or BOS on M15, M5, or even M1
• Look for a strong bullish engulf from the reactive level
• Confirm via imbalance fill or price reclaiming broken structure
📍 If all that happens — the trap becomes your entry.
If not? Stand down.
📊 What Smart Traders Actually Do Differently
They don’t chase wicks.
And never enter just because price tapped a line.
IT IS ALL ABOUT READING STRUCTURE AND PRICE ACTION.
Here’s how:
• Mark the highest probability reaction zones — above and below current price;
• Set alerts, not blind entries;
• Wait for price to come into their zone and then watch what it does there;
• Look for confirmation: CHoCHs, BOS, engulfing candles, FVG fills, clean rejections;
• And always keep one eye on the news — because Gold reacts fast and violently when volatility hits.
• Repeat this work daily until they learn how to recognize signs faster and more secure.
That’s the difference between chasing the reversal… and trading the move after the trap.
Because in this game, patience isn’t just a virtue — it’s survival.
And Gold? Well, XAUUSD has no mercy for those in a hurry and not studying its moves day by day, month after month and so on. Learn structure and price action even if you join any channel for help if you are serious about trading this amazing metal.
If this lesson helped you today and brought you more clarity:
Drop a 🚀 and follow us✅ for more trading ideas and trading psychology.
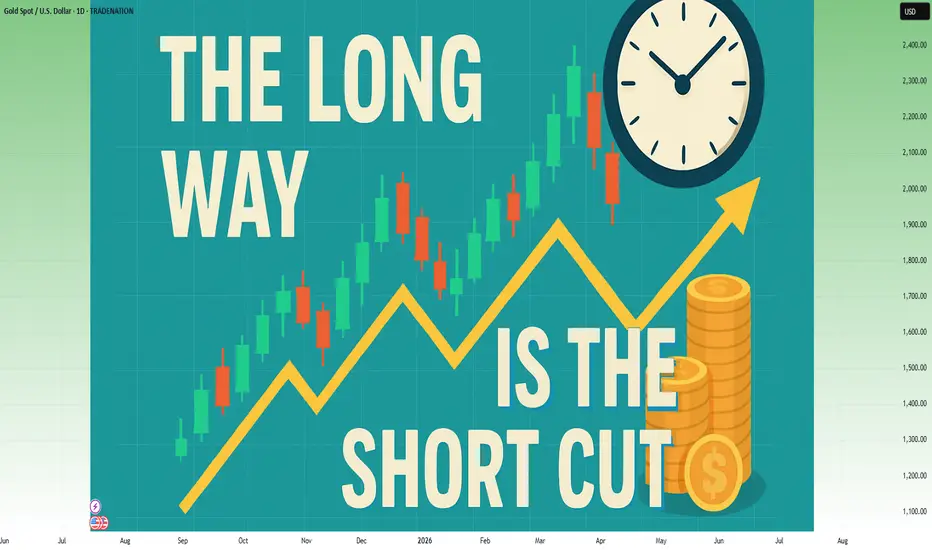
In trading, the long way is the shortcut⚠️ The Shortcut Is an Illusion — And It Will Cost You
In trading, everyone wants to arrive without traveling.
They want the profits, the freedom, and the Instagram lifestyle — even if it’s fake.
What they don’t want is the process that actually gets you there.
So they chase shortcuts:
• Copy signals without understanding the reason behind them
• Over-leverage on “the perfect setup”
• Buy indicators they don’t know how to use
• Skip journaling and backtesting
• Trade real money without trading psychology
And then they wonder…
Why is my account bleeding?
Why does this feel like a cycle I can't break?
Because:
Every shortcut in trading is just a fast track to disaster.
You will lose. You will restart. And it will take even longer than if you just did it right the first time.
🤡 The TikTok Fantasy: “1-Minute Strategy That Will Make You Millions in 2025”
This is the new wave:
A 60-second video showing you a magical indicator combo.
No context. No testing. No risk management.
Just fake PnL screenshots and promises of millionaire status before next summer.
“This 1-minute scalping strategy made me $12,000 today!”
And people fall for it… because it’s easier to believe in shortcuts than to accept that real trading is boring, repetitive, and hard-earned.
If it fits in a TikTok video, it’s not a strategy. It’s clickbait.
________________________________________
❓ Looking for a System Without Knowing the Basics
Here’s the paradox:
Most people are desperate to find a “profitable strategy” — but they haven’t even mastered the basic math of trading.
• They don’t know how pip value is calculated
• They don’t understand how leverage works
• They confuse margin with risk
• They size positions emotionally, not based on their account
• They can’t define what 1% risk per trade actually means in dollars
But they’re out here, loading indicators, watching YouTube “hacks,” and flipping accounts with 1:500 leverage.
Imagine trying to perform surgery before learning anatomy.
That’s what trying to trade a strategy without knowing pip cost looks like.
________________________________________
🛠️ The Long Way Is the Fastest Way
You want the real shortcut?
Here it is:
• Learn price structure deeply
• Backtest like a scientist
• Journal like a professional
• Risk small while you're learning
• Stay on demo until your edge is proven
• Master basic math: leverage, margin, pip value, position sizing
This is the long way.
But it’s the only way that doesn’t end in regret.
________________________________________
⏳ Most Traders Waste 2–5 Years Looking for a Shortcut
And in the end?
They crawl back to the long path.
Broke, humbled, and wishing they had just started there from the beginning.
The shortcut is a scam.
The long way is the only path that leads to consistency.
You either take it now… or take it later — after your account pays the price.
________________________________________
✅ Final Thought
Don’t ask how fast you can get profitable.
Ask how solid you can build your foundation.
Because in trading:
❌ The shortcut costs you everything
✅ The long way gives you everything
And the longer you avoid it, the longer it takes.
GOLD Melted , 2 Best Places To Sell Clear , Don`t Miss 200 Pips Here is My 30 Mins Gold Chart , and here is my opinion , we Again Below 3377.00 and we have a 30 Mins Candle closure below this strong res , so i`m waiting the price to go back and retest this res and new support and give me a good bearish price action to can enter a sell trade and we can targeting 200 pips , and we have a good res @ 3365.00 we can sell from it also if the price didn`t reach 3377.00 and targeting from 100:200 pips , and if we have a Daily Closure below This res this will increase the reasons for us , just wait the price to back a little to retest it and then we can sell it . if we have a daily closure aboveit this idea will not be valid anymore .

Gold: holding flat grounds Gold was traded relatively flat during the previous week, moving within a range of $3.370 and $3.313. The safe-haven asset was holding relatively steady on eased geopolitical and economic tensions. The US Dollar gained a bit last week on better than expected inflation and jobs data posted during the week. Analysts are in agreement that current concerns related to the U.S. debt growth and further trade tariffs updates will certainly support the price of gold in the near future period.
The RSI was holding relatively steady modestly above the level of 50. This indicates that investors are still not ready to take the move toward the oversold market side. The MA50 modestly slowed down its divergence from MA200, however, two lines are still holding a higher distance between them, in which sense, cross is certainly not in store for some time in the future.
Charts are indicating that the price of gold continues to be well supported around current levels. There is some potential for a small move toward the down side, till the levels around $3.310. Also, the $3.3K support line might be tested. On the opposite side, any news related to geopolitical or economic tensions might swiftly push the safe-haven asset toward the upside, at least till the level of $3.370.

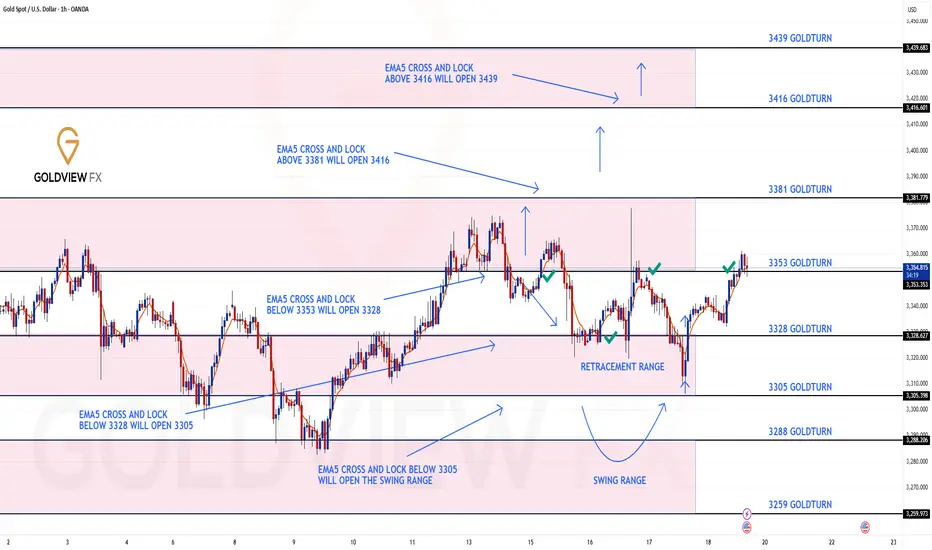
GOLD ROUTE MAP UPDATEHey Everyone,
End of week update following up on yesterday’s 1H chart outlook.
✅ 3353 was hit and respected to the pip, just as we mapped out and highlighted yesterday.
We saw the EMA5 cross and lock above 3328, confirming continuation.
The market respected structure beautifully
Rejections gave us clean dip buying entries
EMA5 methodology guided our execution
High probability Goldturn levels played out exactly as planned
Our discipline and patience were rewarded, yet again. Another strong end to the week.
We will now come back Sunday with a full multi timeframe analysis to prepare for next week’s setups, including updated views on the higher timeframes, EMA alignments, and structure expectations going forward.
Thanks again for all your likes, comments, and follows.
Wishing you all a fantastic weekend!!
Mr Gold
GoldViewFX
Gold 30Min Engaged ( 3355 Bearish Entry Detected )Time Frame: 30-Minute Warfare
Entry Protocol: Only after volume-verified breakout
🩸Bearish Reversal 3355 Zone
➗ Hanzo Protocol: Volume-Tiered Entry Authority
➕ Zone Activated: Dynamic market pressure detected.
The level isn’t just price — it’s a memory of where they moved size.
Volume is rising beneath the surface — not noise, but preparation.
🔥 Tactical Note:
We wait for the energy signature — when volume betrays intention.
The trap gets set. The weak follow. We execute.

XAU/USD Elliott Wave Setup : Triangle Ends, Impulse BeginsThe 8-hour XAU/USD chart presents an Elliott Wave structure, currently in the final stages of Wave 4 within a larger impulsive cycle. The complex correction in Wave 4 has unfolded as a WXYXZ (triple-three pattern), forming a contracting triangle (ABCDE) — a classic consolidation phase that typically precedes a sharp impulsive breakout.
Wave E has recently completed near the lower boundary of the triangle, supported by the ascending trendline drawn from the April low. This suggests the correction is mature and Wave 5 is ready to ignite.
Target 1 (T1) : 3434.845
Target 2 (T2) : 3500.535
Stop Loss (SL) : 3309.729
The triangle (Wave 4) breakout structure suggests bullish continuation.
Multiple internal WXY corrective waves have completed, signaling exhaustion.
Volume and candle structure support the possibility of impulsive buying in Wave 5.

XAUUSD Expecting bullish Movement Gold is showing potential for a bullish reversal from the key support zone between 3390 to 3395. Price has formed a base in this range, and if it holds, we may see an upside breakout above the descending trendline
Buy Zone: 3390 – 3395
First Target: 3355.50
Second Target: 3380.50
A successful breakout and hold above the trendline resistance could trigger a move toward our short-term targets. Watch for bullish confirmation before entering. Manage risk accordingly

Gold trend analysis: bullish but not chasing the rise.Gold, last Thursday's daily line closed with a long lower shadow, bottomed out and stabilized, and once again stabilized at the lower track support point of the large convergence triangle. Combined with the cyclical movement after the two stabilizations at 3247 and 3282, it was three consecutive positive rises; therefore, last Friday, and at least these two days on Monday this week, there will be consecutive positive rises; today gold rose as expected, the Asian and European sessions continued to be strong, and there was a second rise in the U.S. session. Since the U.S. session went directly higher before and after, the current support below has moved up to the 3377-75 area, where a top and bottom conversion position will be formed. Therefore, if it falls back to 3375-77 in the evening, you can continue to go long and look to above 3400. If it falls below 3370, it will fluctuate. The upper short-term resistance level is 3387-3393, the previous high. If the market touches here for the first time, you can try to see a double top decline.

Gold sets sights on 3,500 USD – will the rally continue?Hello traders, do you think gold will keep rising?
Today, OANDA:XAUUSD is trading around 3,380 USD after a slight pullback from the 5-week high of 3,438 USD reached on Tuesday. Despite this short-term dip, the overall trend remains bullish, supported by both technical structures and market expectations.
On the news front, the US Dollar Index (DXY) has dropped to 97.4 – its lowest level in weeks. This reflects growing expectations that the Federal Reserve may cut interest rates by the end of the year, as recent data points to slowing inflation and weakening consumer spending. A softer dollar typically strengthens gold’s appeal.
From a technical perspective, the daily chart reveals a clear bullish structure supported by the rising trendline and the EMA34 and EMA89. Price is consolidating just above the trendline, forming a potential bullish continuation pattern. The resistance zone near 3,440 USD is being repeatedly tested – and if gold breaks out with strong volume, the path toward 3,500 USD could open up quickly.
From my perspective, I expect gold to make new highs above this level soon. What’s your take? Drop your thoughts in the comments!

Completion of rising wedge Gold is currently still holding rising channel along with the swing moves we were on buy at 3410 and my optimal target was 3425-3430 which is achieved now I'm expecting the reversal move!!
What's possible scanarios we have?
▪️I'm looking for sell opportunity from 3430-3435 area by following our structural strategy, also we have previous moves on Rising channel, market always respect its prevoius BOS and my Selling trade target will be 3405 then 3395 in extension.
▪️if H4 candle closing above 3435-3438 this Parallel moves will be invalid.

GOLD (XAUUSD): Bullish Move Ahead?!
I think that Gold is going to rise soon.
The price is now entering a strong demand area
based on a horizontal support and a rising trend line.
The price may pull back to 3376 level.
❤️Please, support my work with like, thank you!❤️
I am part of Trade Nation's Influencer program and receive a monthly fee for using their TradingView charts in my analysis.

XAUUSD: Market analysis and strategy on July 22.Gold technical analysis
Daily chart resistance level 3450, support level 3330
Four-hour chart resistance level 3420, support level 3375
One-hour chart resistance level 3402, support level 3375.
Gold rose sharply on Monday, fluctuated upward in the Asian session, and the NY market accelerated its rise, with the daily line rising sharply to 3400. The fundamentals of the bull market have not changed, and this time it is believed that the factor that triggered the unilateral rise is the expectation of the Fed's interest rate cut. Yesterday I mentioned that the 1-hour bottom structure appeared, and a new bullish opportunity appeared again!
Yesterday's idea was very clear. The Asian session stepped back to confirm the top and bottom conversion support level of 3344, and finally the NY market rose sharply, directly breaking through the key position of 3377.
Gold price stood firm at 3360, preparing to break through the key position of 3377 and then accelerate its rise. Yesterday's increase broke through the highest level in the past month. After all, the strength after the breakout after such a long period of volatility will not be small. In the previous few trading days, it returned to the previous high to complete the conversion of top and bottom. Today, pay attention to the support of the top and bottom conversion position of 3377. If it falls back during the day, you can continue to buy on dips based on the support of 3375. The bulls are accumulating momentum to break through the suppression of the 3400 mark. If it stands firm at 3400 after the breakthrough, it will be a large-scale increase.
In terms of intraday operations, buy more near 3377/75 after the retracement.
Buy: 3375 near
Buy: 3402near

Gold Surges to Five-Week High Amid Growing UncertaintyHello everyone! Let’s take a closer look at XAUUSD today.
Gold prices have rallied strongly, breaking above the 3,400 USD level and currently hovering around 3,420 USD — up 1.2% in the past 24 hours, equivalent to a gain of 34.7 USD.
This surge marks the highest level in five weeks, driven by heightened uncertainty surrounding U.S. President Donald Trump's looming August 1 tariff deadline. With tensions rising, gold is likely to remain on an upward trajectory. The immediate resistance stands at 3,420 USD per ounce, while support is seen near 3,350 USD.
Investors are also eyeing next week’s Federal Reserve policy meeting, where rates are expected to stay unchanged — but a rate cut could come as early as October. Meanwhile, the U.S. dollar continues to face renewed pressure heading into August, a factor that may further boost gold’s appeal.
Do you think gold will keep rising from here? Drop your thoughts in the comments — and good luck with your trades!

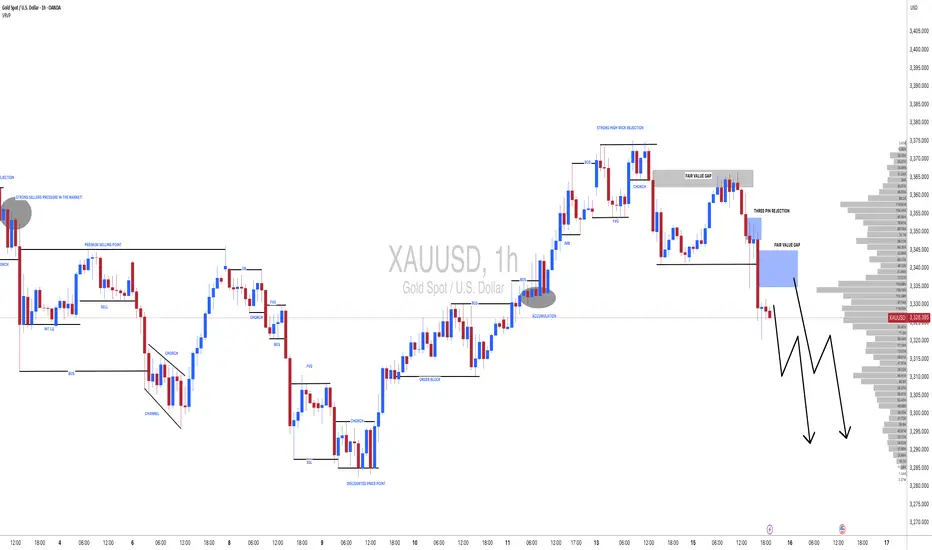
XAUUSD Analysis – Smart Money Perspective XAUUSD Analysis – Smart Money Perspective
🧠 Market Structure & BOS (Break of Structure):
The chart clearly shows multiple Break of Structure (BOS), confirming bullish intent.
After the final BOS around 3,370, price aggressively broke above resistance, forming a new high at 3,397.
This indicates bullish market momentum backed by strong demand.
🔎 Key Zones Identified:
🔼 Strong Resistance (3,390 – 3,400 Zone)
This level has been tested and now shows potential exhaustion, possibly trapping late buyers.
Price currently rejecting this zone with a bearish reaction.
🔽 Support Zone (3,300 – 3,320)
Prior consolidation and BOS originate from here.
Strong bullish OB and demand lie here—key area for future long setups.
📉 Expected Short-Term Move:
The projection arrow indicates a potential retracement toward 3,360, a previous BOS + potential FVG area.
This aligns with Smart Money's tendency to rebalance inefficiencies before continuation.
🔺 Volume Analysis (VRVP - Volume Profile):
Notice how high volume nodes align with the support and resistance zones.
Price is currently sitting in a low-volume gap, supporting the idea of a retracement to a more balanced area.
⚡ Momentum Shift Signal:
The steep angle of the last move up suggests possible liquidity grab above resistance.
Expectation: Price may dip to mitigate demand or OB before resuming the uptrend.
✅ Conclusion:
This chart illustrates a textbook SMC scenario:
Bullish BOS confirms structure shift.
Liquidity sweep above resistance may lead to a retracement.
3,360 is a key price point to watch for FVG fills or bullish continuation.

Gold price maintained above 3400⭐️GOLDEN INFORMATION:
Gold prices surged over 1% on Monday as both the US Dollar and Treasury yields declined sharply, driven by ongoing uncertainty surrounding trade negotiations, despite a generally positive risk tone in broader markets. At the time of writing, XAU/USD trades at $3,397, having rebounded from daily lows of $3,338.
While risk sentiment has improved ahead of upcoming US corporate earnings releases, anxiety lingers as the August 1 tariff deadline set by the White House approaches. Investors remain cautious about potential trade disruptions between the US and its key partners—the European Union (EU), Canada, and Mexico.
Meanwhile, reports from Bloomberg indicate that EU officials are preparing to convene this week to finalize a retaliation strategy, should trade talks with President Trump collapse. This backdrop of trade tension continues to support gold’s safe-haven appeal.
⭐️Personal comments NOVA:
Gold price continues to increase before FED's statement, market's expectation of early interest rate cut, setting new ATH in Q4/2025
⭐️SET UP GOLD PRICE:
🔥SELL GOLD zone: 3450- 3452 SL 3457
TP1: $3435
TP2: $3422
TP3: $3405
🔥BUY GOLD zone: $3332-$3330 SL $3325
TP1: $3345
TP2: $3358
TP3: $3370
⭐️Technical analysis:
Based on technical indicators EMA 34, EMA89 and support resistance areas to set up a reasonable BUY order.
⭐️NOTE:
Note: Nova wishes traders to manage their capital well
- take the number of lots that match your capital
- Takeprofit equal to 4-6% of capital account
- Stoplose equal to 2-3% of capital account
