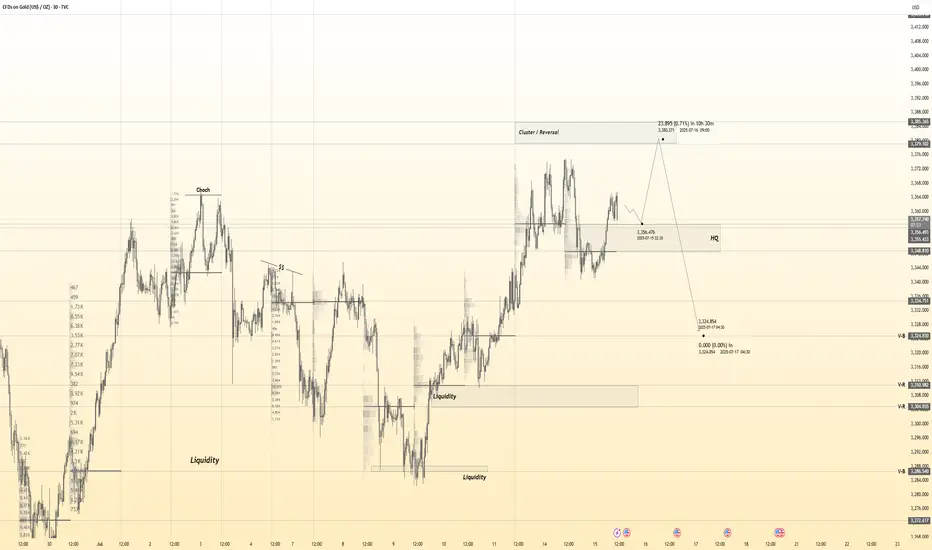
Gold 30Min Engaged ( Dual Entry's Detected )Time Frame: 30-Minute Warfare
Entry Protocol: Only after volume-verified breakout
🩸Bullish Reversal 3357 Zone
🩸Bearish Reversal 3357 Zone
➗ Hanzo Protocol: Volume-Tiered Entry Authority
➕ Zone Activated: Dynamic market pressure detected.
The level isn’t just price — it’s a memory of where they moved size.
Volume is rising beneath the surface — not noise, but preparation.
🔥 Tactical Note:
We wait for the energy signature — when volume betrays intention.
The trap gets set. The weak follow. We execute.
XAUUSDK trade ideas
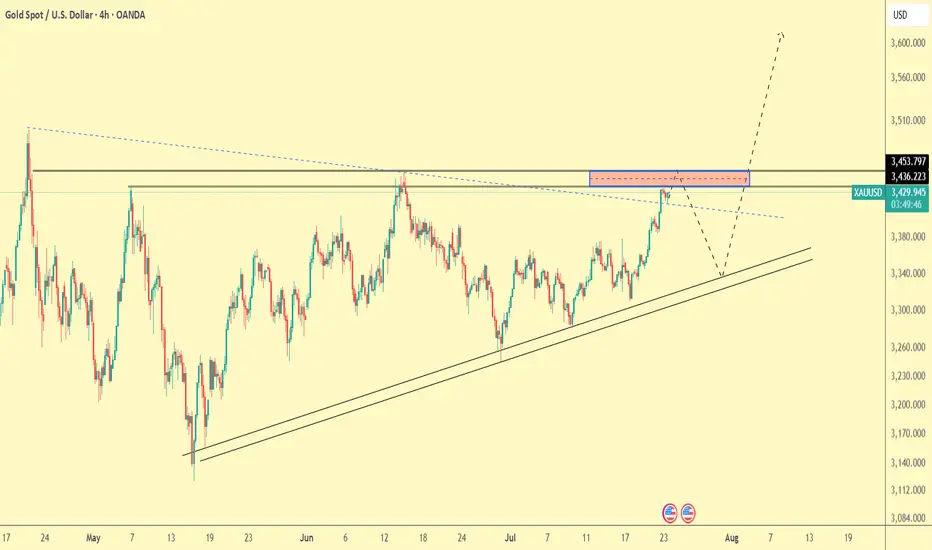
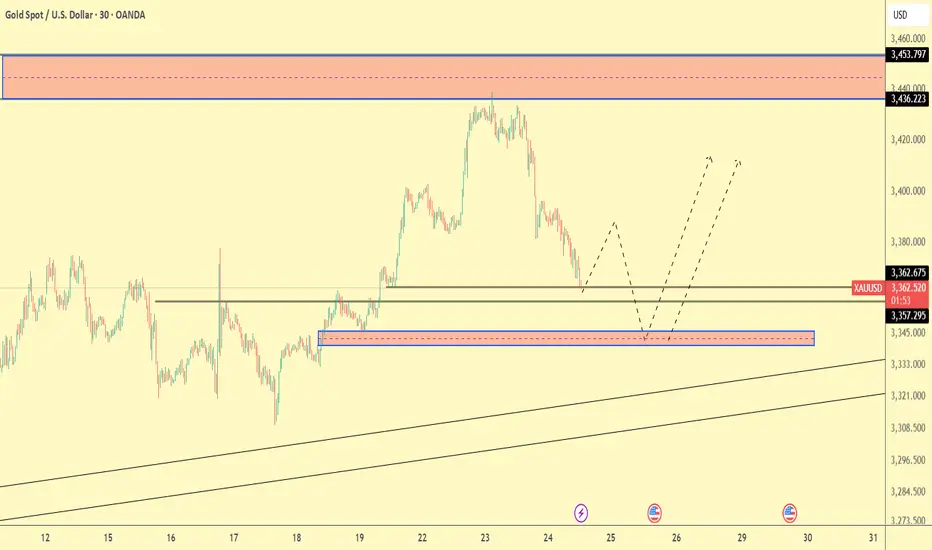
SWING TRADE OPPORTUNITY 〉LONGAs illustrated, I try to visualize what the next bullish impulse could look like if price holds 3300 as a key psychological and algorithmic price level.
Illustrated are the potential buy areas (a current one and an extended one in case a pullback occurs to manipulate lower levels in the next 24-48 hours).
This projection, if valid, could hold from now until next week, so it can be considered a swing trade to hold at least the next week and into the following one).
--
After this post, I will upload another analysis on the Daily timeframe projecting the longer term move, so make sure to go in my profile to check it out.
GOOD LUCK

xauusdxauusd sell 3432 Gold is in an ascending channel. I think it could pull back from these areas. We need to see how the next 4-hour candle will close.

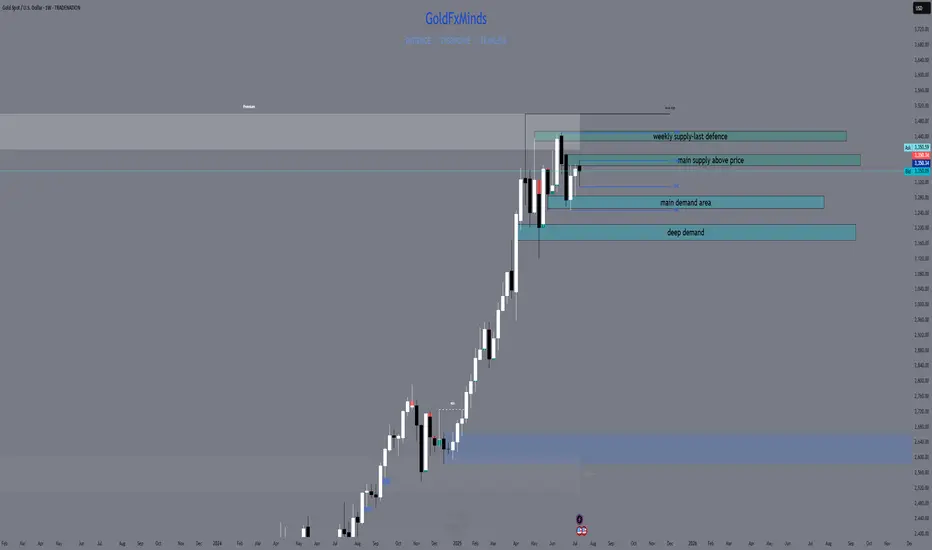
Weekly XAUUSD Outlook | July 21–25GoldFxMinds | Structure-Based HTF Plan
Hello traders,
This week we’re back in key HTF territory. Price is compressing inside a premium structure zone, between clean supply and demand areas. Trend is still bullish, but momentum is weakening — so we focus on structure to guide us.
🟨 Weekly Bias: Neutral | Range Structure in Play
We currently have no confirmed bullish or bearish bias on the weekly timeframe.
Gold remains trapped in a macro range between:
🟥 Upper Resistance Zone: 3355–3380
🟦 Lower Demand Zone: 3280–3240
Last week’s movement created a wick grab near 3375 followed by a strong push down, but without a clean break of structure — meaning we’re still inside a distribution–accumulation trap.
📌 Until we see a clear breakout (above 3380 or below 3280), the weekly bias remains neutral.
This is not a time to force directional trades on the weekly.
Instead, we wait for Daily and H4 confirmation, and position ourselves around the edges of this weekly range.
🔹 Last Week Recap
Weekly candle created a wick into 3377, rejecting just under previous week’s high. No BOS, no liquidity sweep with continuation — just a clear rejection inside supply, confirming premium trap.
Weekly candle closed with a top wick and small body — price is compressing under resistance. Still bullish structure, but not impulsive.
🔹 Weekly Key Structure Zones
🔸 3365–3390 (Supply)
→ Reason: Rejection from prior weekly high (3377), aligned with clean OB and FVG left behind from June breakout.
→ Structure context: No bullish BOS above 3375. This is now an unbroken supply zone with strong wick rejections. Liquidity sits above.
→ Use: Wait for price to tap back in → look for M15–H1 reaction for possible sell if no BOS above 3390.
🔸 3430–3450 (Supply - Last Line)
→ Reason: Unmitigated impulsive candle OB from prior macro swing high. This zone marks the final structure before a full continuation toward new highs.
→ Structure context: If this breaks with a strong BOS, macro structure flips bullish again.
→ Use: Only engage if price clears 3390 with strong volume and closes → watch this for last reaction zone.
🔸 3285–3260 (Demand)
→ Reason: Last bullish OB + FVG combo from early July, unmitigated. Price never retraced to this base since the rally.
→ Structure context: No BOS down yet, so this is still valid bullish origin.
→ Use: If price pulls back aggressively this week, watch this zone for LTF confirmation (CHoCH or BOS bullish). This would be a clean discount buy.
🔸 3210–3180 (Deep Demand)
→ Reason: Higher timeframe CHoCH origin zone, aligns with Fibonacci 61.8% retracement from entire May–July swing.
→ Structure context: Only in play if 3260 fails and we get clean BOS down on Daily.
→ Use: This is your swing buy zone if market breaks structure lower. Strong confluence for reaction.
🔹 HTF Structure Recap
Weekly trend: Still bullish (no BOS down), but compression under resistance
Structure range: Between 3390 and 3260 — price inside premium, no breakout yet
EMA Flow: Bullish but extended. Space for retracement.
RSI: Divergence above 3350 — supporting possible retrace.
🔹 Macro Events This Week
Tuesday: Powell speaks 🗣️ (volatility risk)
Thursday: Flash PMIs (usually directional)
Friday: Durable Goods & Home Sales 🏡
⚠️ Be patient on high-impact days. Let price come into your marked zones — don’t chase inside noise.
🔹 Summary & Plan
We are inside a macro range between 3390 (supply) and 3260 (demand). Structure is not broken — so we play both sides:
Sell Setup: If price taps back into 3365–3390 with no BOS → watch for reaction
Buy Setup: If price retraces into 3285–3260 → look for clean bullish CHoCH to validate
Middle area = chop. Wait for price to get to structure zones — don’t guess.
Thanks for reading 💛
We’ll drop daily and intraday outlooks once price moves closer to one of these structure zones. Until then:
🎯 Trade the reaction, not the prediction.
🔥 If you want these levels and sniper plans every day, follow , like 🚀🚀🚀 and drop a comment if you caught the move!
Stay focused, stay sharp, and never force a trade.
GoldFxMinds
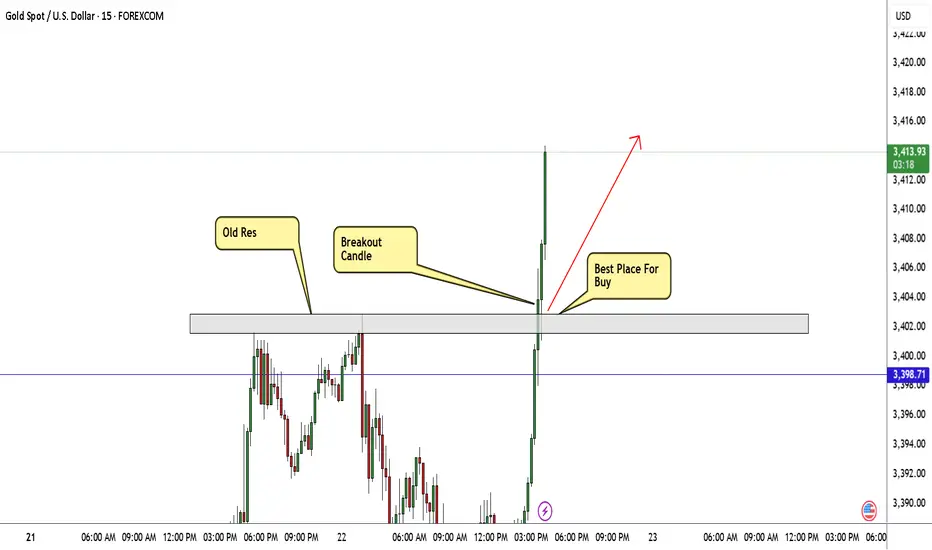
GOLD Still Bullish , Are You Ready For New Wave ? 200 Pips ValidHere is My 15Mins Gold Chart , and here is my opinion , we finally above 3400.00 and we have a 30 Mins Candle closure above this strong res , so i`m waiting the price to go back and retest this res and new support and give me a good bullish price action to can enter a buy trade and we can targeting 200 pips , and if we have a 4H Closure Above This res this will increase the reasons for buyers , just wait the price to back a little to retest it and then we can buy it . if we have a daily closure below it this idea will not be valid anymore .
Gold Trade Plan 23/07/2025Dear Traders,
What we see on the chart is that the price is trying to reach the previous pivot around the 3450 area. I expect a correction from this level towards the 3370 area.
Regards,
Alireza!
XAU/USD Chart Analysis: Bulls Break Important ResistanceXAU/USD Chart Analysis: Bulls Break Important Resistance
When analysing the XAU/USD chart last week, we:
→ noted that the ADX indicator had reached its lowest level since the beginning of 2025 – a clear sign of declining gold price volatility;
→ highlighted the formation of a large-scale triangle with its axis around the $3,333 level, bounded by a resistance line (marked in red) and the lower boundary of the ascending channel.
Since then, the price has climbed above $3,400 – reaching its highest level since mid-June. According to media reports, the uptick in demand may be driven by escalating geopolitical risks, renewed optimism regarding potential monetary policy easing in the US, and consistent gold buying from central banks.
This suggests that the balance has shifted in favour of the bulls, who have made an attempt to break through the resistance line – an attempt that, so far, appears promising and points towards a potential resumption of the upward trend.
However, today's XAU/USD chart shows that the bulls are now facing a key resistance level at $3,440 – a level that has reversed gold prices downward both in May and June. What will happen in July?
It is possible that, following a prolonged consolidation near the lower boundary of the channel, the bulls have built up sufficient momentum to finally break through this critical level and push gold prices towards line Q, which divides the lower half of the long-term channel into two quarters.
This article represents the opinion of the Companies operating under the FXOpen brand only. It is not to be construed as an offer, solicitation, or recommendation with respect to products and services provided by the Companies operating under the FXOpen brand, nor is it to be considered financial advice.

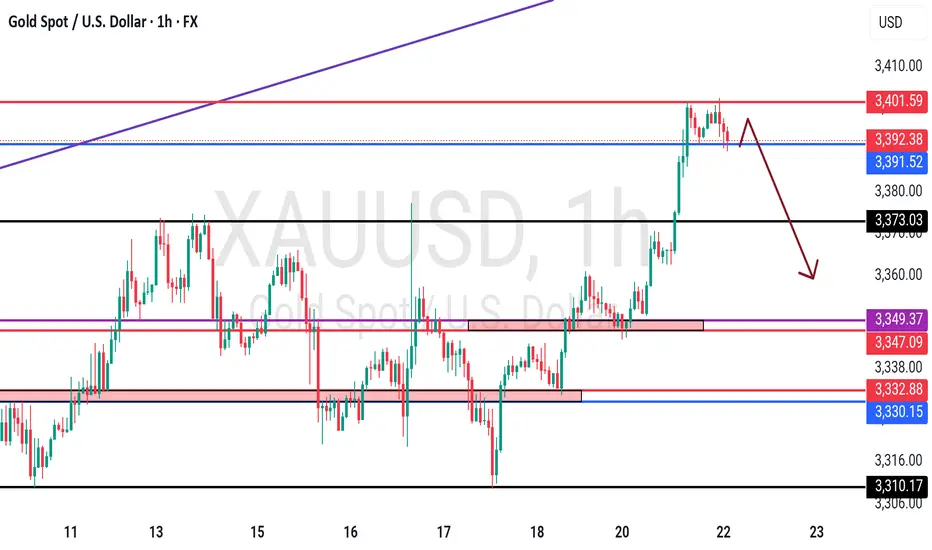
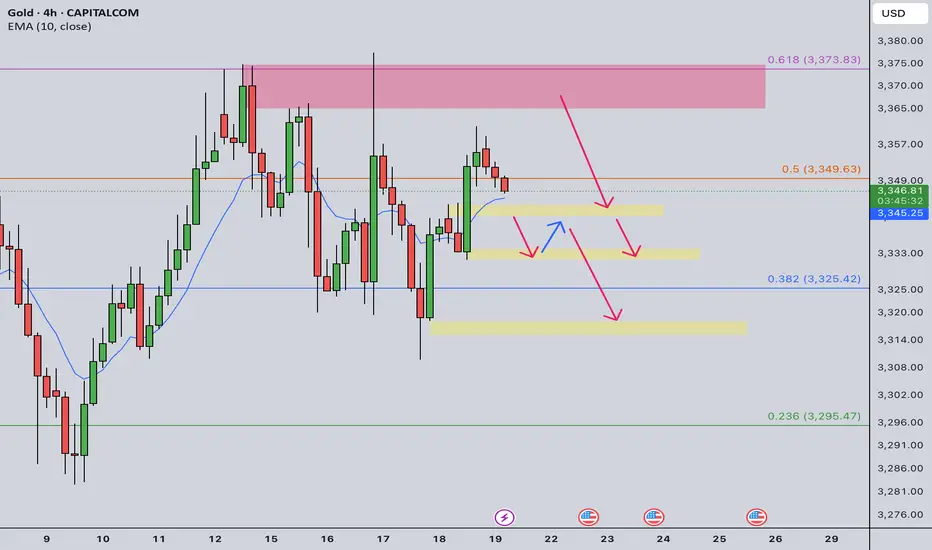
Gold Intraday Trading Plan 7/21/2025As explained in my weekly post, I am bearish in gold as long as 3373 resistance holds. For today's setup, there could be two scenarios for selling opportunity:
1. If price tests 3365-3373 resistance and it holds, I will sell towards 3345, and final target is 3330
2. If 3340 is broken, upon retest, I will sell towards 3320.
XAUUSD FULL WEEKLY STRUCTURE MAPHello traders! 🌟
We’re stepping into a pivotal week for gold (XAUUSD), and the weekly chart tells a story of tension, liquidity hunts, and potential big moves. Let’s dive into the three truly critical zones, backed by SMC/ICT logic, Fibonacci, EMAs, RSI, and fair‑value gaps — all in one elegant map. 🎨✨
🔹 HTF Overview & Macro Pulse
Current Price: 3336
Weekly Trend: Bullish overall, but momentum is fading as price coils under premium highs.
EMAs (5/21/50/200):
EMA5 & EMA21 are flattening beneath price, hinting at stall.
EMA50 sitting near 3120 as a deep support magnet.
RSI (Weekly): Cooling from ~75 down to ~66, showing bearish divergence vs those upper wicks.
Fair‑Value Gaps:
Unfilled 3365–3405 zone above — institutional imbalance still waiting.
Partially filled 3280–3320 below — common reaction pocket.
Fibonacci Extensions (1984 → 3365 high): 127.2% at 3405, 161.8% at 3439 — the exact top of our supply wick.
Macro Catalysts This Week
Wed (Jul 30): FOMC + Fed Statement
Thu (Jul 31): Core PCE + Unemployment Claims
Fri (Aug 1): NFP + ISM Manufacturing
Prepare for violent spikes into one of our zones — then trade the reaction.
🔸 The Three TRUE Weekly Zones
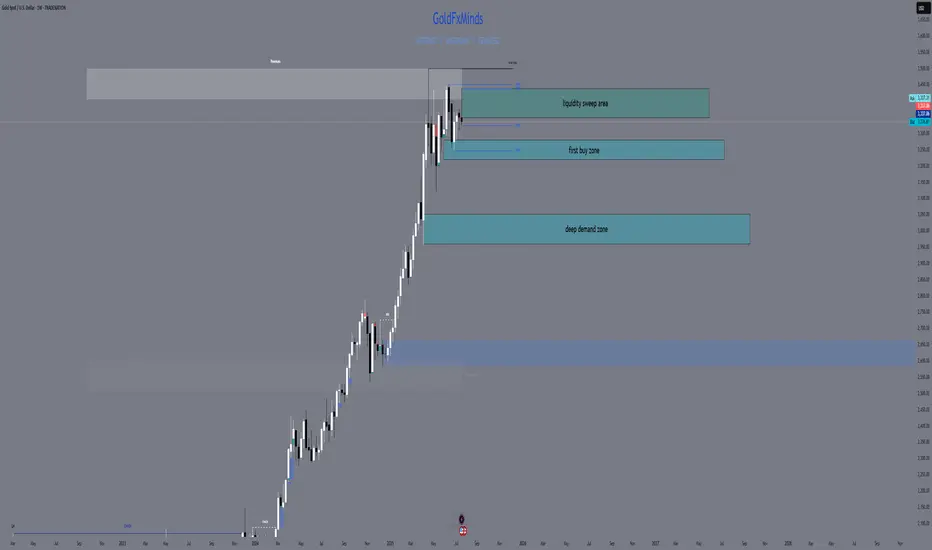
W1 Supply (Ultimate Wick Zone)
🔥 3350 – 3439
This entire wick from May–July is YOUR one and only supply zone on weekly.
Pure liquidity sweep area
Confluence: unfilled fair‑value gap, 127–161.8% Fib, RSI divergence
Every touch here is a short‑trap until we see a full weekly close above 3439.
W1 Demand (Primary Buy Zone)
🌊 3220 – 3285
The last robust order block & BOS base before gold ran vertical.
Confluence: filled FVG, weekly OB body, EMA21 target, RSI back at 50
Ideal sniper entry after a news‑driven sell‑off into this range.
Deep Discount Block
🛡️ 2960 – 3050
The origin of the full 2024–2025 bull trend — true institutional accumulation.
Confluence: March 2024 CHoCH base, EMA50/200 proximity, 78.6–88.6% Fib retrace
Only for a major quarterly reset; not on the immediate radar unless USD spikes dramatically.
🧭 Strategy & Execution
Short Bias: Wait for a liquidity spike into 3350–3439 (likely around FOMC/NFP), then watch for a clean rejection candle.
Long Bias: After a thrust down into 3220–3285, look for wick‑based rejection plus EMA21 hold and a bullish engulf on weekly.
Avoid the mid‑zone between 3285–3350 — that’s noise, not structure.
Patience is everything. Let price sweep, then let us strike. The real power trades this week will be born from clear structure — not guesswork.
💬 What’s your favorite zone to watch? Drop a comment below!
👍 Smash that like🚀🚀🚀 if you found this map helpful, and hit follow for more GoldFxMinds sniper blueprints.
Disclosure: Analysis based on Trade Nation’s TradingView feed. I’m part of their Influencer Program.
GoldFxMinds 💛
GOLD Drops $60 – Bearish Bias Holds Below 3365GOLD | OVERVIEW
As expected, gold continued its bearish momentum, dropping from the 3430 level and delivering a move of approximately $60.
For today, the bearish bias remains valid as long as the price stays below 3365, with potential targets at 3337 and 3320.
However, if the price reverses and stabilizes above 3365, it could signal a shift to bullish momentum.
Key Levels:
Support: 3355 · 3337 · 3320
Resistance: 3374 · 3388

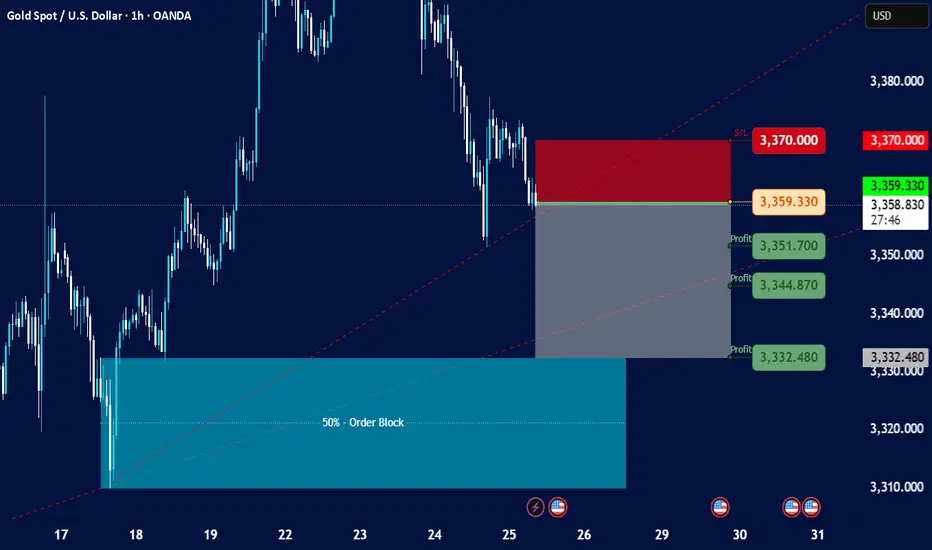
Gold Spot / U.S. Dollar - 1h on TradingView, dated July 25, 202Current Price and Trend:
The current price is shown as 3,359.330, and the last traded price is 3,359.005.
The chart indicates a downtrend in recent sessions, with the price having fallen significantly from higher levels around 3,380.000 to 3,390.000 down to the current levels.
There's a dashed red line (possibly a trendline or resistance) indicating a downward slope.
Key Zones and Levels Identified:
Resistance/Stop Loss Zone (Red Rectangle):
This zone is marked from approximately 3,365.000 up to 3,370.000.
A "S/L" (Stop Loss) level is explicitly marked at 3,370.000. This suggests that a short position (selling) is being considered, with a stop loss placed above this resistance.
Entry Point (Grey Line):
An entry point for a trade is indicated by a grey horizontal line at 3,359.330. This is very close to the current price, suggesting a potential entry for a short trade.
Profit Target Zones (Grey Rectangle with Green Labels):
Three "Profit" levels are identified below the entry point:
3,351.700
3,344.870
3,332.480
These levels suggest potential targets for taking profit on a short position. The grey shaded rectangle represents the area where these profit targets lie, extending downwards from the entry point.
50% - Order Block (Teal Rectangle):
At the bottom left of the chart, there's a large teal-colored rectangle labeled "50% - Order Block."
This typically represents an area where significant institutional buying interest (or an accumulation of orders) is expected, potentially acting as strong support. The price has previously bounced off this area.
Possible Trading Strategy Implied:
The setup suggests a potential short-selling strategy for Gold Spot / USD, likely based on a continuation of the downtrend or a retest of previous resistance levels.
Entry: Around 3,359.330 (current price level).
Stop Loss: At or above 3,370.000, to limit potential losses if the price moves against the short position.
Take Profit: Phased profit-taking at 3,351.700, 3,344.870, and 3,332.480.
Target Support: The ultimate target appears to be within the "50% - Order Block" zone, suggesting the expectation of the price reaching or testing this strong support area.
Considerations and Further Analysis Needed:
Confirmation: The chart doesn't show any specific indicators (e.g., RSI, MACD) that might confirm the downtrend or potential entry.
Volume: Volume analysis would be beneficial to assess the strength of price movements.
News/Fundamentals: Any upcoming economic data or geopolitical events could significantly impact gold prices.
Risk-Reward Ratio: A calculation of the risk-reward for each profit target would be useful to determine the attractiveness of the trade.
Market Structure: A deeper analysis of the market structure (higher highs/lows, lower highs/lows) could provide more context.
Gold Trade Plan 24/07/2025Dear Traders,
The price is currently near the demand zone in the range of 3358-3362. If the price holds above the support line, it could rise towards the 3388-3390 zone and then enter a correction again. However, if the 3362-3358 zone is broken, I expect a drop towards around 3350, followed by a potential rise towards the 3400 zone.
regards,
Alireza!
XAU / USD 1 Hour ChartHello traders. Wow, what a push up for gold today. I have marked my current area of interest. Gold usually takes a few days to carve out it's potential paths for the week, so let's see if we continue up or start pushing down for a retest after such a move up. Big G gets a shout out. Be well and trade the trend. Happy Monday.

GOLD - SHORT TO $2,880 (UPDATE)Gold sellers have now pushed down to where price opened on Monday, turning the weekly candle bearish. A huge move down, compared to where price was at on Tuesday high!
R.I.P to those who bought the top. But this is what happens when you trade without a strategy or guidance⚰️


Gold Potential UpsidesHey Traders, in today's trading session we are monitoring XAUUSD for a buying opportunity around 3,310 zone, Gold is trading in an uptrend and currently is in a correction phase in which it is approaching the trend at 3,310 support and resistance area.
Trade safe, Joe.
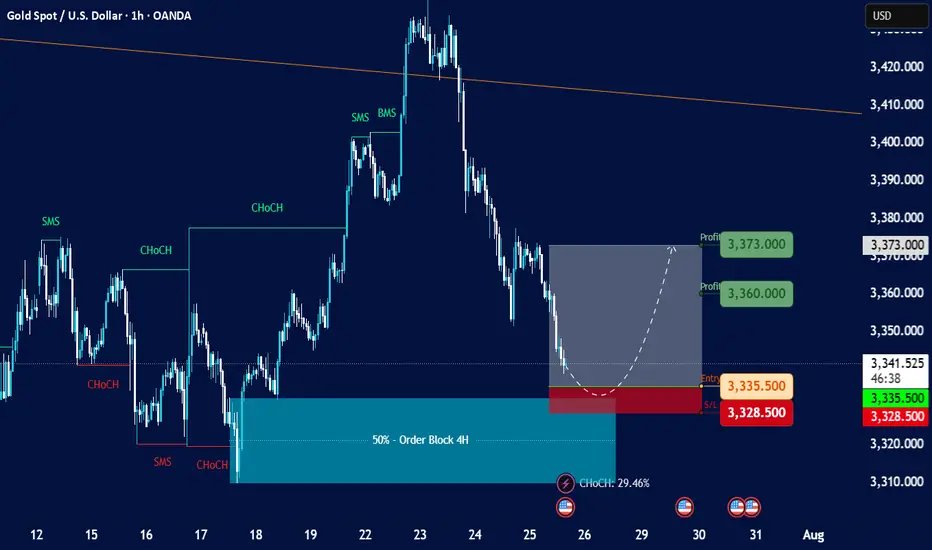
Gold Spot / U.S. Dollar (XAU/USD) with a 1-hour timeframeOverall Trend and Market Structure:
The chart displays a mix of bullish and bearish movements, but recent price action (from around July 23rd onwards) shows a significant downturn after a peak.
There are "SMS" (Structural Market Shift) and "ChoCH" (Change of Character) labels, indicating shifts in market structure. Initially, there were bullish shifts, but the recent price action suggests a potential bearish shift or at least a significant retracement.
A large "50% - Order Block 4H" is highlighted in blue, which acted as support and led to a strong upward move previously.
Current Price Action and Setup:
The current price is around 3,340.670.
There's a proposed short-term trading setup, indicated by:
Entry: 3,335.500 (red dashed line)
Stop Loss (SL): 3,328.500 (red shaded area)
Profit Targets (TP):
3,360.000 (green shaded area, "Profit 3,360.000")
3,373.000 (green shaded area, "Profit 3,373.000")
The setup is highlighted with a gray shaded area, indicating the potential path of price for this trade. It appears to be a long (buy) setup, anticipating a bounce from the current levels.
The "CHOCM: 29.46%" at the bottom suggests some kind of indicator or calculation related to market character.
Key Observations and Considerations:
Previous Bullish Momentum: The price rallied strongly after touching the "50% - Order Block 4H" around July 17-18, reaching a high near 3,430.
Recent Bearish Retracement: Since July 23rd, the price has pulled back significantly from its peak, almost revisiting the higher levels of the previous order block.
Potential Support: The proposed entry point for the long trade (3,335.500) is within a zone that previously acted as support or a level from which price bounced. It's also near the top of the "50% - Order Block 4H" area, suggesting this could be a retest or a bounce from a key support zone.
Risk-Reward: The setup shows a relatively tight stop loss compared to the potential profit targets, which is generally favorable for risk management.
Gold Hits Supply Zone — Short-Term Sell OpportunityHello traders!
Gold has reached a supply zone and is starting to bounce back from it.
With the overall trend still bullish, we can look for a short-term sell position here.
The target is around 3394.
Manage your risk and trade safe!

GOLD Rebound Ahead! Buy!
Hello,Traders!
GOLD is falling down now
But will soon hit a horizontal
Support level of 3375$
And as we are bullish biased
We will be expecting a rebound
And a local bullish correction
Buy!
Comment and subscribe to help us grow!
Check out other forecasts below too!
Disclosure: I am part of Trade Nation's Influencer program and receive a monthly fee for using their TradingView charts in my analysis.

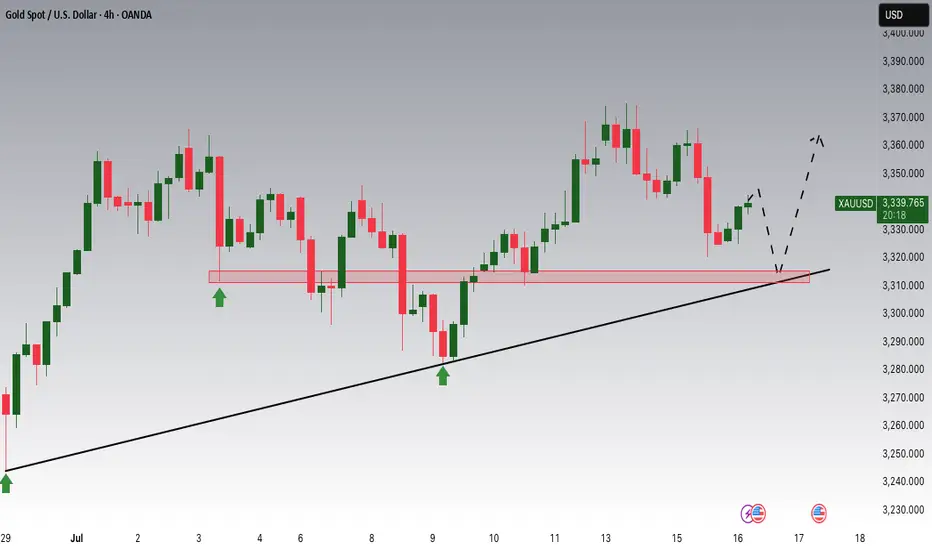
XAUUSD - Parabolic move ahead in GOLD.Gold currently at 3339 is retesting its trendline breakout, setting the stage for a potential move to $4,000 as momentum builds. I expect all metals, particularly precious ones, to perform strongly moving forward.
If you like this idea, do boost and share :)

Gold didn't managed to recover #3,400.80 benchmarkAs discussed throughout my yesterday's session commentary: "My position: I spotted that many Traders Sold Gold throughout yesterday's session which was a mistake personally as Gold will remain strong on each next session due global Fundamentals. Firstly I have Bought #3,385.80 Bottom with #4 orders. First one I have closed near #3,400.80 benchmark, second two I have closed at #3,407.80 since Profit was already great and left final runner which I closed on #3,424.80 / expecting #3,434.80 final destination which was delivered. I will keep Buying every dip on Gold as long as #3,400.80 benchmark holds as an Support from my key re-Buy points."
Technical analysis: Price-action came even closer to my projected #3,357.80 Support fractal. As expected the #3,400.80 - #3,405.80 structure acted effectively as an Resistance zone as it was places within last MA periods. Daily chart is again marginally Bearish on its vast majority, only Supported now by the #3,352.80 - #3,357.80 which is interval level, and if Support zone gets invalidated, #3,342.80 Support in extension will be set in motion (Daily chart suggests an even Lower Support base towards #MA50 which is reasonable configuration to expect considering the wide frame on my Volume formula).
My position: I have Bought Gold many times above #3,400.80 benchmark however as it got invalidated, I Bought #3,390.80 again late U.S. session and closed my set of Buying orders on #3,395.80 nearby extension. I left one runner (#3,390.80 entry point) with Stop on breakeven expecting Asian session to recover #3,400.80 benchmark, however it was closed on break-even as Gold extended Selling sequence. I will continue Selling every High's on Gold and if #3,357.80 gives away, expect #3,352.80 and #3,342.80 contact points to be met.

Gold (XAU/USD) 1H Analysis: Sell Zone Identified with Downside This chart shows a technical analysis of Gold (XAU/USD) on the 1-hour timeframe. Price is approaching a Sell Zone near resistance around $3,431, with two downward target levels marked at $3,403.787 and $3,382.674. The chart also highlights a Fair Value Gap (FVG) suggesting potential bearish retracement.

GOLD - at cit n reverse area? What's next??#GOLD... market perfectly moved as per our video analysis and now market just reached at his current ultimate swing area
That is around 3402
So if market holds 3402 in that case selling expected otherwise not.
NOTE: we will go for cut n reverse above 3402 on confirmation.
Good luck
Trade wisely