Gold Trading on my predicted valuesTechnical analysis: As discussed, as long as #3,400.80 mark (Xau-Usd numbers) holds, Gold is more likely to push towards #3,442.80 strong Resistance and #3,452.80 benchmark in extension for a Higher High’s Upper zone test invalidating the Hourly 4 chart’s Neutral Rectangle. This Trading week is packed with the U.S. reports, so Fundamentally the real trend will be revealed after those, since today’s E.U. session delivered indecision movements only (Spinning Top’s formation) however Bullish bias is here to stay. The Short-term Price-action has turned Bullish just over the Hourly 4 chart’s former Support at #3,363.80, while Technically, Gold is critically Bearish. It is interesting to mention that even the Daily chart is to a certain extent is Bearish however Technical rules do not apply on Fundamentally driven sessions. Everything depends upon the DX (and to a lesser extent Bond Yields), so I can't make any Short-term recommendation other than the Bullish break-out points that I am already Trading on. See also how Xau-Usd (spot price) and GC (Futures price) are finally closing the gap and getting into tight range again. Regarding today’s session - two straight red Hourly 1 candles (after Bullish rejection) so far which indicate (unless broken) that #3,427.80 is a Double Top. Most likely Gold is going towards #3,416.80 - #3,420.80 to test the Support zone and then if Price-action gets rejected (most likely it will), then Hourly 4 chart’s Resistance zone test should be next - and potentially stay Neutral for a few sessions in a symmetrical manner as April #14 - 16.
My position: I spotted that many Traders Sold Gold throughout yesterday's session which was a mistake personally as Gold will remain strong on each next session due global Fundamentals. Firstly I have Bought #3,385.80 Bottom with #4 orders. First one I have closed near #3,400.80 benchmark, second two I have closed at #3,407.80 since Profit was already great and left final runner which I closed on #3,424.80 / expecting #3,434.80 final destination which was delivered. I will keep Buying every dip on Gold as long as #3,400.80 benchmark holds as an Support from my key re-Buy points.
XAUUSDK trade ideas

Gold Trade Plan 25/07/2025Dear Trader,
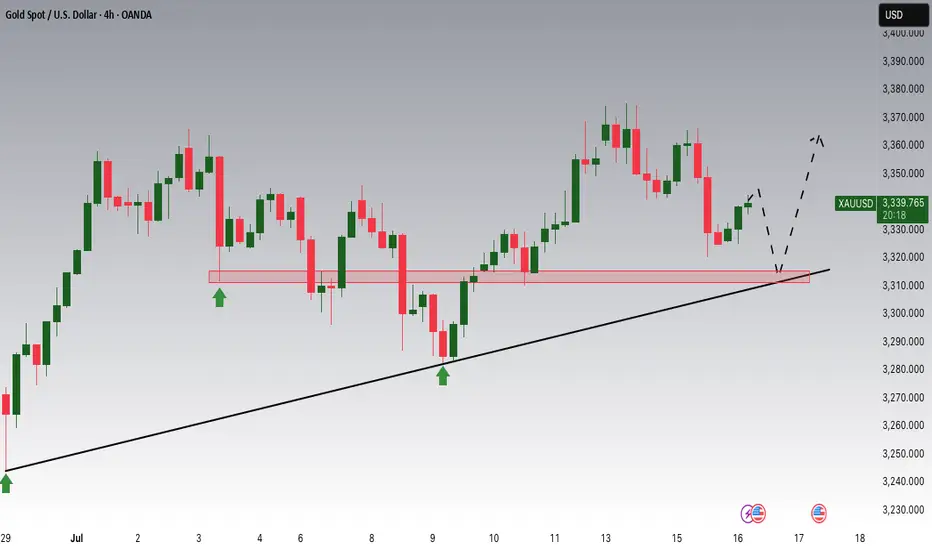
Gold (XAU/USD) is currently in a corrective phase, reaching near the support zone at around 3,340. The price is testing the trendline, and we may see a potential bounce towards the resistance level at 3,400-3,420. If the price breaks below this support, we could expect a further drop towards the next support levels near 3,325-3,310. The market will likely consolidate in this range until we see a breakout in either direction. The key levels to watch are 3,340 (support) and 3,400-3,420 (resistance). Monitor the price action closely as a reversal or continuation can occur here.
Regards,
Alireza!
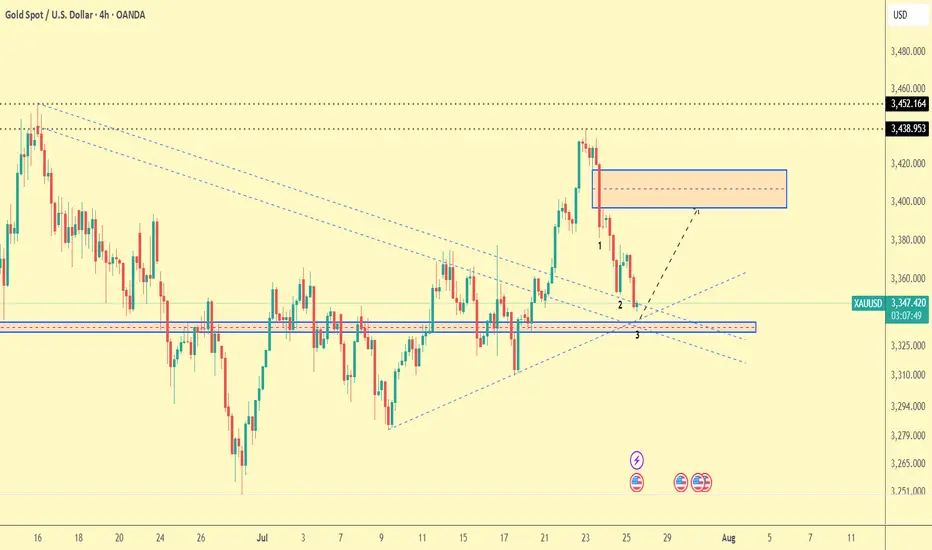
Gold. Could this be the final "shape" of triangle? 26/July/25XAUUSD. back to previous ideas that we possible having a contracting /symmetrical triangle pattern on gold chart..Probarly a "big surprise" on 31 July FED/FOMC meeting?

Gold energy buildup supported at 3308The Gold remains in a bullish trend, with recent price action showing signs of a continuation breakout within the broader uptrend.
Support Zone: 3308 – a key level from previous consolidation. Price is currently testing or approaching this level.
A bullish rebound from 3308 would confirm ongoing upside momentum, with potential targets at:
3387 – initial resistance
3400 – psychological and structural level
3435 – extended resistance on the longer-term chart
Bearish Scenario:
A confirmed break and daily close below 3308 would weaken the bullish outlook and suggest deeper downside risk toward:
3290 – minor support
3268 – stronger support and potential demand zone
Outlook:
Bullish bias remains intact while the Gold holds above 3308. A sustained break below this level could shift momentum to the downside in the short term.
This communication is for informational purposes only and should not be viewed as any form of recommendation as to a particular course of action or as investment advice. It is not intended as an offer or solicitation for the purchase or sale of any financial instrument or as an official confirmation of any transaction. Opinions, estimates and assumptions expressed herein are made as of the date of this communication and are subject to change without notice. This communication has been prepared based upon information, including market prices, data and other information, believed to be reliable; however, Trade Nation does not warrant its completeness or accuracy. All market prices and market data contained in or attached to this communication are indicative and subject to change without notice.

Gold Breaking Previous Highs — Bullish Trend ContinuesHello everybody!
Price is continuing its bullish trend and has broken some significant resistance.
According to the market structure, we’re looking for it to go higher, up to the 3430 area.
The break of the downward trendline is a confirmation for a buy position.
Manage your risk and trade safe!
Closing all of my orders in ProfitAs discussed throughout my yesterday's session commentary: "My position: I will continue Buying every dip on Gold as stated many times throughout my recent remarks maintaining #3,377.80 and #3,400.80 benchmark as an Medium-term Targets."
I have closed set of Buying orders engaged within #3,360.80 - #3,363.80 Support belt / some on #3,377.80 Resistance and some above. My #3,400.80 Medium-term Target I mentioned many times throughout my remarks was hit successfully.
Technical analysis: Gold continues to Trade under heavy gains and prior to Fundamental expectations, it is important to monitor independently what the result will be, either Gold closing above #3,400.80 benchmark or vital for Sellers / reversal. Each result - except a very surprising spikes all along however sequence will not be DX friendly. Based on my estimations, I do believe that generally Gold will continue with an aggressive Medium-term Bullish values and so called Risk aversion will disappear. When Risk taking is returning to the markets the DX will gain further against all major currencies. From my personal point of view, the best opportunity is to keep Buying Gold on the Long-run and even if I am usually Gold Bear, I cannot Sell Gold at all costs currently with Gold Bullish non-stop since October #2023 Year. I continue Buying Gold on each dip.

XAU / USD 2 Hour ChartHello traders. With the Gold market opening shortly, I wanted to publish my 2 hour chart analysis. I have marked my area of interes / no trade zone in orange. I can see the potential for scalp buy / sell trade set ups. I will post after the market is open for a bit, otherwise I will wait to see how the overnight sessions go. Big G gets all my thanks. Let's see how things play out. Be well and trade the trend. This is going to be a great week, I can feel it.

Gold Potential UpsidesHey Traders, in tomorrow's trading session we are monitoring XAUUSD for a buying opportunity around 3,320 zone, Gold is trading in an uptrend and currently is in a correction phase in which it is approaching the trend at 3,320 support and resistance area.
Trade safe, Joe.

Gold Trade SetupI will risk!!!
It seems we are near at the end of correction wave...
The first target R/R is 2 and the second is 4...


Gold Potential UpsidesHey Traders, in today's trading session we are monitoring XAUUSD for a buying opportunity around 3,310 zone, Gold is trading in an uptrend and currently is in a correction phase in which it is approaching the trend at 3,310 support and resistance area.
Trade safe, Joe.
GOLDGOLD needs some more upside, reaction zone is 3380-3395, will see how gold reacts at that level.
Disclosure: We are part of Trade Nation's Influencer program and receive a monthly fee for using their TradingView charts in our analysis.

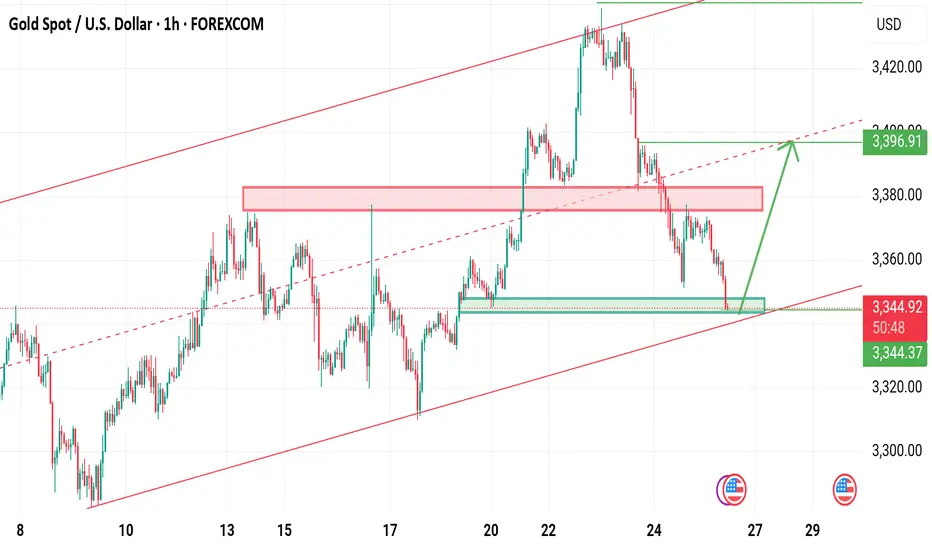
XAUUSD Last hope for buyers Gold is currently still holding rising channel last hope for buyers the bottom trendine .
Below 3335 buyers will be liquidate
What's possible scanarios we have?
▪️I'm gonna take buy trade from 3340-3338 area by following our rising Trend along with structural liquidity sweeps strategy, my target will be 3357 then 3368 in extension.
▪️if H4 candle closing below 3335 this Parallel moves will be invalid and don't look for buy till confirmation

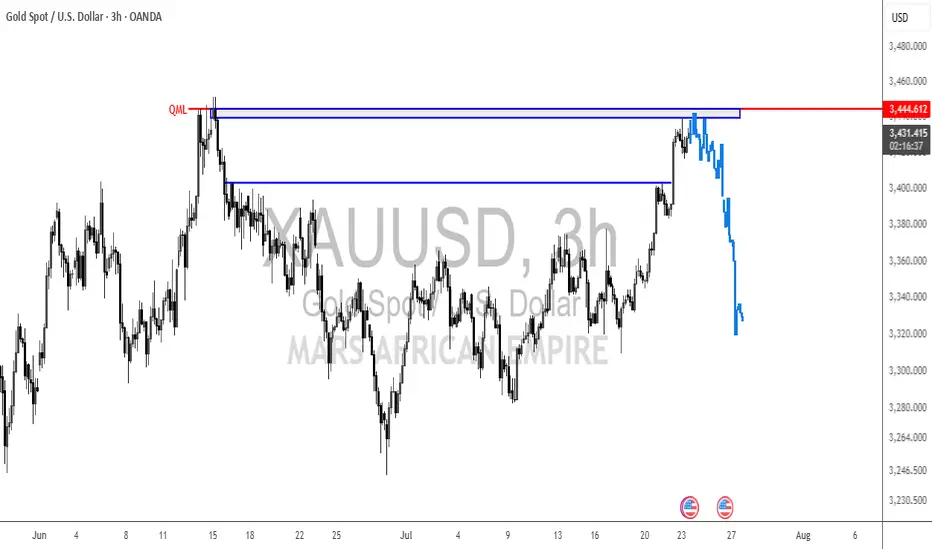
Gold Building Momentum for Potential Upside MoveGold is holding strength above the ascending trendline while testing a critical resistance zone on the 3-hour chart, indicating a potential bullish continuation pattern. The recent 35% tariff on Canada and 15% to 20% on other countries announced by Trump is helping gold to rise as traders seek safety amid rising trade tensions and potential inflationary pressures. Price action shows buyers defending dips near the support zone while respecting the Ichimoku cloud structure, signalling readiness for a breakout if resistance is cleared. Market uncertainty is driving demand for gold, aligning with the bullish structure as the trendline remains intact. Volatility is expected to increase with the tariff developments, and a clean breakout above resistance can open the way for further upside, while maintaining disciplined risk management remains essential in this environment. Continue to monitor price action near the resistance zone for confirmation of continuation toward higher levels in the coming sessions.
Entry: Buy 3320/3326
Target: 3400
Stop Loss: 3304
If you found this analysis helpful, don’t forget to drop a like and comment. Your support keeps quality ideas flowing—let’s grow and win together! 💪📈

XAUUSD--SHORT--second shoulder of "head and shoulder" pattern is about to form.
--next week, pullback to near to crossection point o two orange line, between levels 3369 and 3355
--then downward movement to the level 3283

Gold Sell 4hGold ready to sell ... See 4 Hour timeframe to get entry with your own confirmations..get partial entries with your confirmations.. check the fundamental analysis too
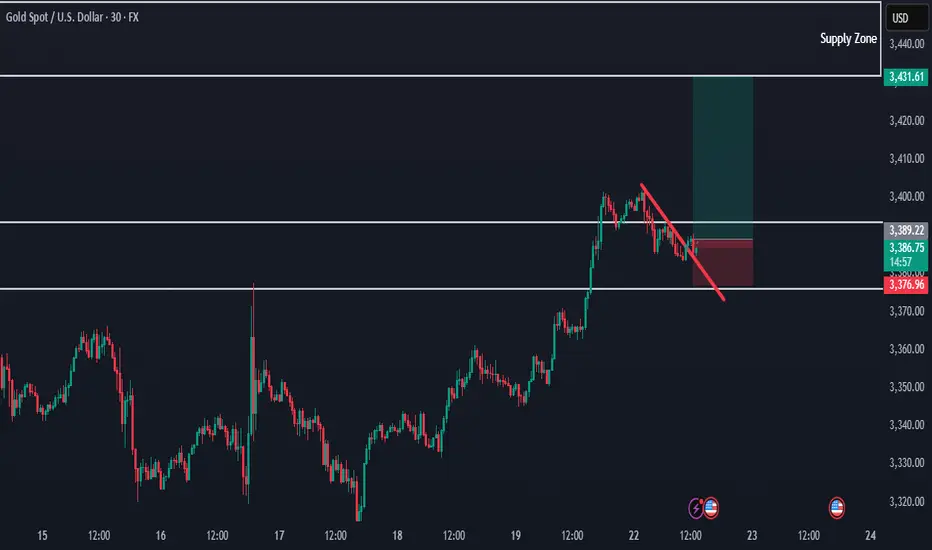
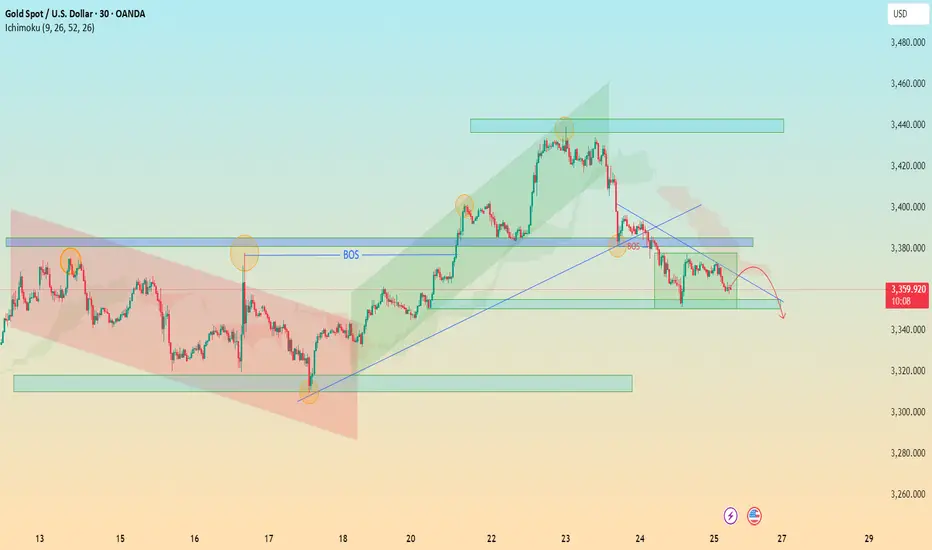
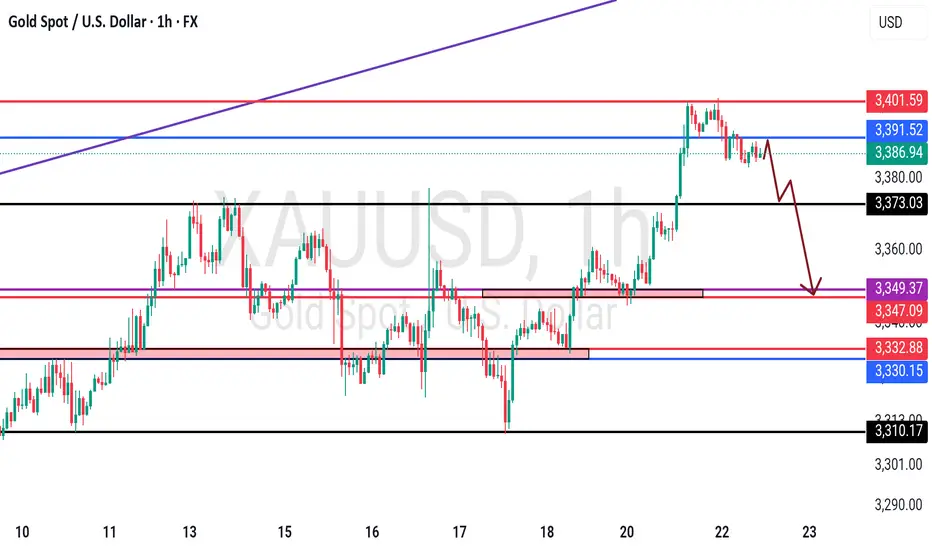
XAU/USD Bearish Retest in Motion – Watch 3340 for Breakout 🔍 XAU/USD (Gold) – Bearish Reversal Outlook
Timeframe: 30-Minute
Date: July 25, 2025
Indicators Used: Ichimoku Cloud, BOS (Break of Structure), Trendlines, Support & Resistance Zones
---
⚙ Technical Breakdown:
1. Previous Market Structure – Accumulation to Expansion:
Descending Channel (Red Box): Market moved within a bearish channel until the breakout occurred.
Key Break of Structure (BOS) around 3365 level signaled the beginning of bullish momentum — a textbook shift from accumulation to expansion phase.
Rally towards 3445 zone: Strong impulsive wave followed by higher highs and higher lows within a green rising channel.
2. Bull Trap and Structural Breakdown:
At the 3445-3460 resistance zone, price failed to maintain momentum and formed a double top / distribution setup.
The second BOS near 3385 confirmed a shift from bullish to bearish market structure.
Ichimoku Cloud also flipped bearish — price is now trading below the cloud, signaling potential continued downside.
3. Current Consolidation and Bearish Retest:
Price is now trapped in a bearish flag / rectangle pattern between 3360 – 3380.
Recent rejections from the descending trendline and overhead supply zone indicate weak bullish attempts and presence of strong selling pressure.
4. Anticipated Move – Bearish Continuation:
The projected red path suggests a retest of the diagonal resistance, followed by a breakdown toward key demand zone at 3340 – 3320.
If that zone fails, we may see a deeper move toward 3280.
---
📌 Key Technical Zones:
Zone Type Price Level (Approx.) Description
Resistance 3445 – 3460 Double Top / Strong Supply
Support 3340 – 3320 Historical Demand Zone
Short-term Resistance 3375 – 3385 BOS Retest + Trendline
---
🎯 Trading Insight:
📉 Bias: Bearish
⚠ Invalidation Level: Break above 3385 with volume
📊 Potential Target: 3340 → 3320
🧠 Trade Idea: Look for short entries on weak retests near descending trendline or cloud rejection.
---
🏆 What Makes This Chart Unique for Editors’ Picks:
✅ Multiple Confluences: Structural shifts (BOS), trendlines, Ichimoku, and classic patterns (channels, flags).
✅ Clear Visual Storytelling: Logical flow from bearish to bullish and back to bearish structure.
✅ Forward Projection: Predictive outlook based on strong technical context — not just reactive analysis.
✅ Educational Value: Useful for beginners and intermediate traders alike to understand structure transitions and key levels.
GOLD - Cut n Reverse Area? What's next??#GOLD... Perfect holdings upside as we discussed in our video and last idea.
Now 3390-91 is major key level because only above that you can see again bounce otherwise not.
NOTE: we will cut n reverse above 3390-91 on confirmation.
Good luck
Trade wisely
Gold on the Move – Major Resistance Levels to Watch AheadThe current price action looks strong, and if the bullish momentum continues, we have three main target levels in mind.
The first target is $3,380. This is an important level we expect gold to reach soon if the trend continues upward.
If the price breaks above $3,380, the next target is $3,433. This level is likely to act as a strong resistance, meaning the price might slow down or pull back here. But if gold can push through it with strength, that’s a strong signal of continued upside.
After that, the third target is $3,495, which would mark a strong extension of the current bullish trend.
As long as gold stays above key support levels, we believe the bullish outlook remains valid, and these targets are possible in the coming days or weeks.

Gold Reload at 3360? Let the Fib Do the Work3360 lines up with key support and the 0.618 Fib—ideal zone for bulls to step back in.
If price holds this level, we may see a continuation toward 3389 and 3400
Plan stays simple: buy the dip, let the trend do the heavy lifting.

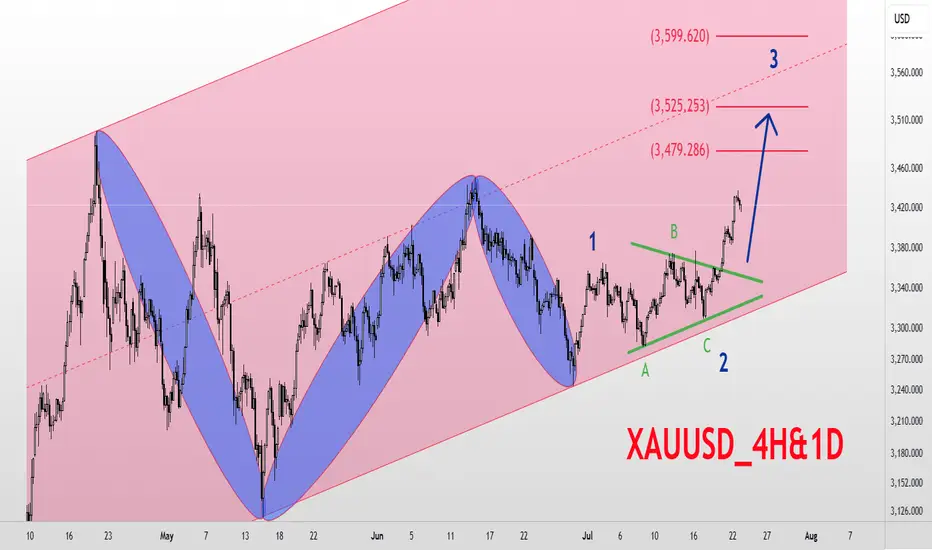
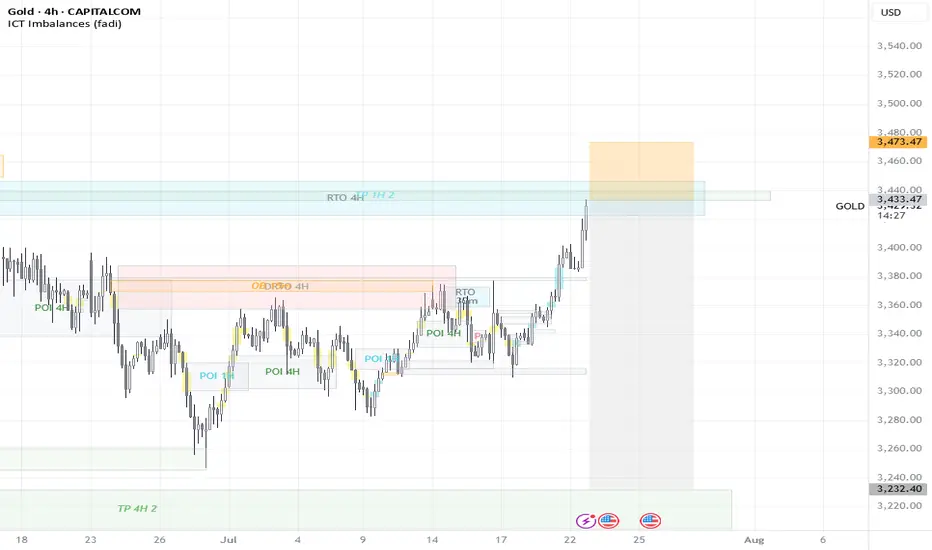
XAUUSD_4H&1D_BuyGold Analysis 4-hour and Daily Medium-term Time Frame Elliott Wave Analysis Style Gold is in a long-term ascending channel Based on Elliott Waves, the market is expected to have entered a new upward trend and has broken waves 1 and 2 and is currently in a large wave 3. The targets for wave 3 are $3480, $3525, and $3600, respectively. Good luck and wish everyone abundance and wealth 💚💚💚