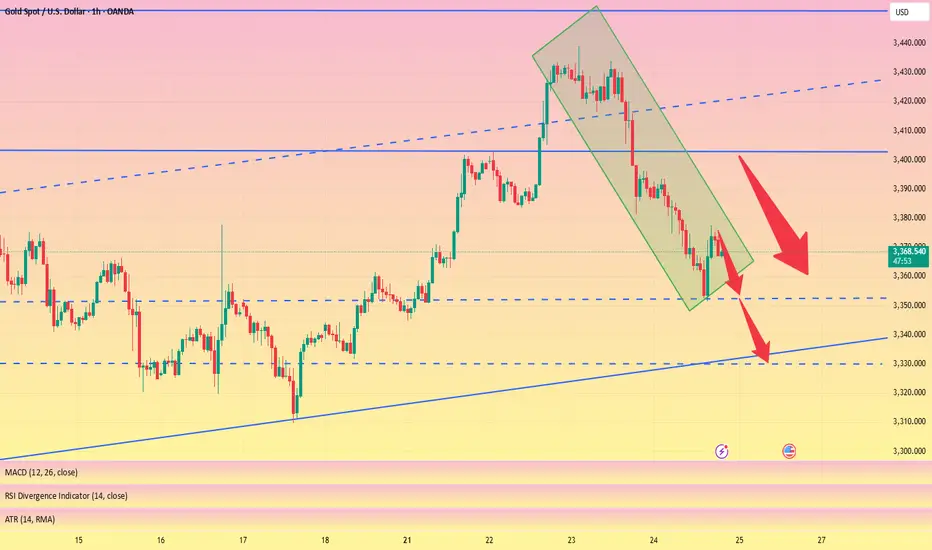
Gold 1H Intra-Day Chart 23.07.2025Option 1: Gold rejects from $3,430 zone & drops towards $3,260.
Option 2: Gold buyers hold around $3,260 & push price back up.
Which scenario do you find more likely?
XAUUSDK trade ideas

GOLD - single supporting area, further bounce??#GOLD - market perfectly moveed as per our video analysis and above our cut n reverse area as well.
Now market have single supporting area, tha tia around 3423-24
Keep close it and if market hold it then upside further bounce expected.
Good luck
Trade wisely
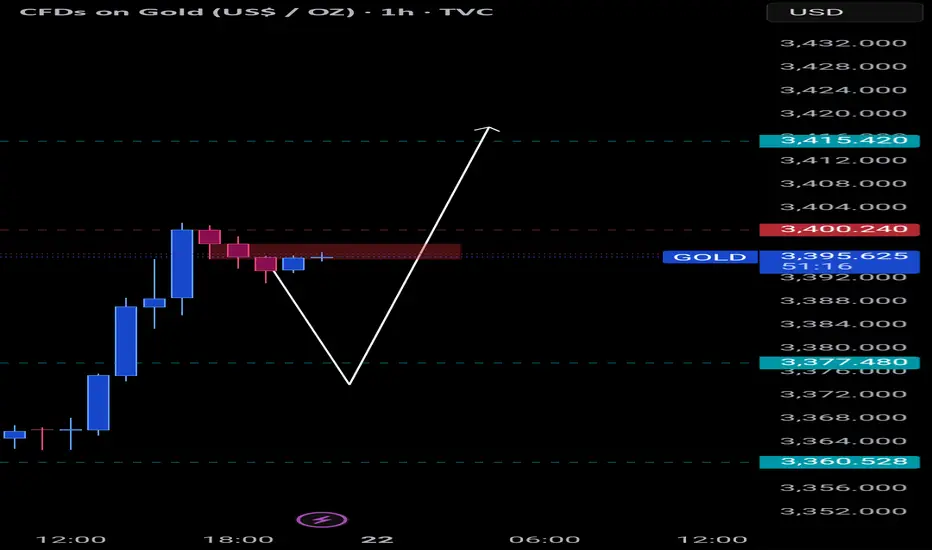
Double Down on Gold — Targeting 3400–3410!Obviously, gold did not give us the opportunity to short gold near 3440 today. In the process of its recent pullback, gold tested 3400 as expected, and after falling below 3400, it continued to fall to around 3385 as if it was planned by me. Although the lowest point had reached around 3381, it quickly rebounded above 3385. What is relatively regrettable today is that both of our plans to short gold ended in failure. The first time was when gold did not give us the opportunity to short near 3440. The second time was when we were preparing to short gold at 3400 and set the TP to 3385. However, we did not have time to create an order because the price fell too quickly, causing us to miss the gold short trade again.
At present, I have a trading order to go long on gold near 3386. And I go long on gold with twice the usual trading volume. Why am I still optimistic about the rebound of gold in the short term after the gold price fell by nearly $60? Because the area around 3385 is the short-term bull-bear dividing line, although gold has fallen sharply, as long as it stays above the area around 3385, gold is still in a bullish trend as a whole, and the bullish structure has not been destroyed, so in the short term, gold still has a lot of room for rebound after the pullback. This is why I dare to use twice the usual trading volume to buy gold near 3386.
However, because the current gold long and short continuity is not strong, and the market uncertainty is still increasing due to complex news, the gold market is prone to violent fluctuations in the short term, so we have to be more careful in trading. At present, I still hold a gold long position near 3386, and I hope that gold can continue to rebound to the target area: 3400-3410.

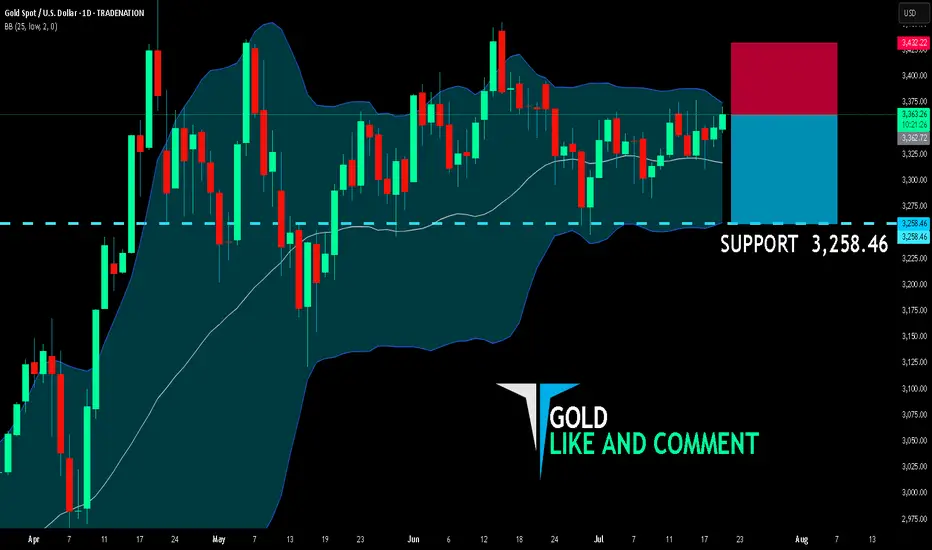
GOLD BEARS ARE GAINING STRENGTH|SHORT
GOLD SIGNAL
Trade Direction: short
Entry Level: 3,362.72
Target Level: 3,258.46
Stop Loss: 3,432.22
RISK PROFILE
Risk level: medium
Suggested risk: 1%
Timeframe: 1D
Disclosure: I am part of Trade Nation's Influencer program and receive a monthly fee for using their TradingView charts in my analysis.
✅LIKE AND COMMENT MY IDEAS✅
NordKern - XAUUSD InsightNordKern | Simplified Insight OANDA:XAUUSD possible scenarios
Gold saw some upside today, primarily driven by softer TVC:DXY and trade deadlines ahead. To be specific:
1. Softer U.S. Dollar (DXY)
The U.S. Dollar Index fell ~0.1–0.2% today, making gold more attractive for international buyers
Kitco confirms the decline in USDX, paired with weaker Treasury yields, is fueling bullion demand.
2. Cautious Market Ahead of Trade Deadlines
Markets are bracing for the August 1 U.S. tariff deadline, especially involving the EU. Investors are positioning defensively, increasing safe-haven interest in gold.
Heightened trade tensions and uncertainty including possible Trump-Xi talks boost demand for safe assets.
3. Falling Treasury Yields & Fed Policy Expectations
The U.S. 10‑year Treasury yield has slipped (~4.37%), reducing gold’s opportunity cost and supporting its attractiveness.
Market pricing shows increasing odds of a Fed rate cut at next week’s FOMC meeting, something analysts like Christopher Waller suggested.
4. Geopolitical & Trade Risk Premiums
Escalating trade risk (tariffs looming) and geopolitical uncertainty are prompting safe-haven inflows into gold.
India’s MCX mirror those sentiments: gold rose ~0.5% on local contracts amid global trade nerviness.
To sum it up:
Gold is rallying today primarily because of the softer dollar, lower yields, and elevated trade risks ahead of the August 1 tariff deadline all of which reinforce its safe-haven allure.
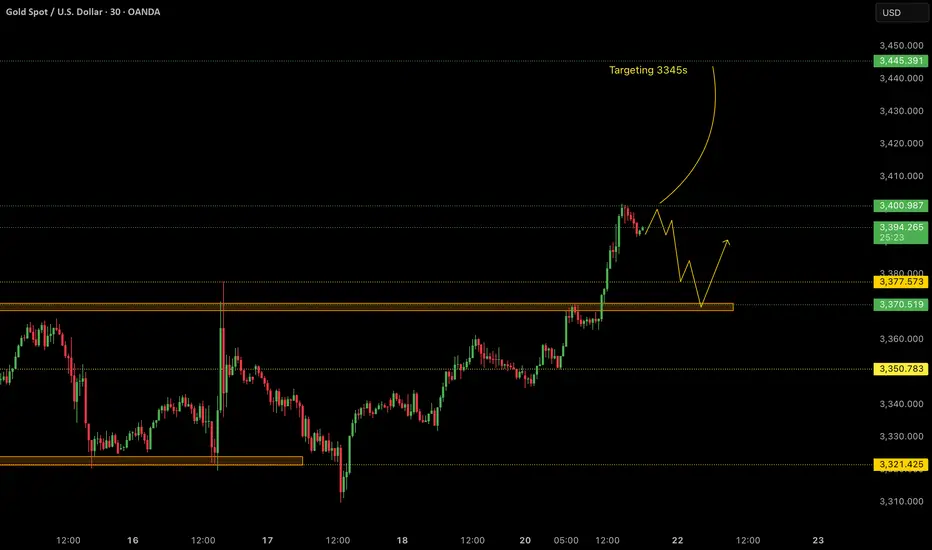
Trade Setup - Shorts; if we retest 3370s
- We would primarily look to enter into lower risk buys on gold at more preferable levels such as 3370. After breaking to the upside from the consolidation area, a pullback and a retest to that area would not be out of the ordinary.
Trade Setup - Buys; if we break above 3400
- In case of the dollar remaining soft, we can expect gold to continue its upside rally without any major pullbacks. In this case, we would be looking for the breaks of 3400 and continue to hold until around 3345s.
Key Notes:
- Softer Dollar
- Possible retest of 3370s
- Watch for potential breaks of 3400
This remains a tactically driven setup. Manage risk appropriately and stay alert for any renewed political developments.
Gold Bounces Back After Testing Key Support📊 Market Drivers
• Gold dropped to around $3,352, touching a key support zone, then quickly rebounded to $3,373, gaining over +20 points.
• The rebound is supported by continued weakness in the US Dollar and slight easing in Treasury yields, keeping gold attractive as a safe haven.
• Although some optimism around US-Japan trade negotiations slightly reduced risk aversion, it wasn’t enough to push gold below support.
📉 Technical Analysis
• Key Resistance:
o $3,397 – $3,400: psychological resistance and near the next bullish breakout zone.
o If breached, next target lies around $3,420–3,445.
• Nearest Support:
o $3,356 – $3,364: recently confirmed support zone that triggered the current rebound.
o Deeper support at $3,326 – $3,320 if the rebound fails.
• EMA (EMA50):
o Price remains above the 50-period EMA, indicating bullish momentum in the short term.
• Patterns & Momentum:
o Market structure shows a "rising low" pattern — a bullish signal that buyers are stepping in at higher levels.
o RSI was briefly in oversold territory and now supports a recovery bounce.
o If $3,356 holds, the upside targets remain valid toward $3,397 → $3,439.
📌 Assessment
• Gold has confirmed strong support at $3,356–3,364, with the rebound from $3,352 as proof.
• Short-term uptrend remains intact, unless the USD strengthens sharply or unexpected macro news hits.
• If gold breaks below $3,356, it may retrace toward $3,326–3,320, but the upside potential is currently favored.
💡 Suggested Trade Setups
BUY XAU/USD: $3,356–3,364
🎯 Take Profit: 40/80/200 pips
❌ Stop Loss: $3,346
SELL XAU/USD: $3,397–3,400
🎯 Take Profit: 40/80/200 pips
❌ Stop Loss: $3,407

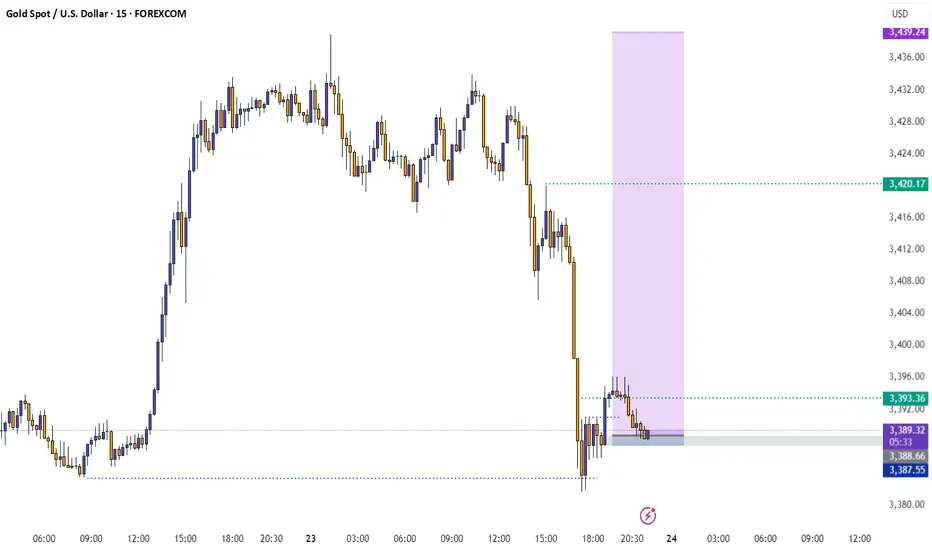
XAUUSD: Market analysis and strategy for July 24.Gold technical analysis:
Daily chart resistance 3440, support 3310
4-hour chart resistance 3390, support 3340
1-hour chart resistance 3375, support 3360.
Yesterday, according to news, the United States and the European Union were close to reaching a trade agreement, which led to the recent risk aversion sentiment to subside, and the bulls took profits. The gold price has fallen by nearly $80 from its peak.
From the current power comparison, the bears are temporarily dominant. Since yesterday, the candlestick chart of the 4-hour chart has completed 6 candles today (2 of which are sideways and 4 are falling sharply). It is expected that it will not rebound until today's NY market trading session.
Gold may reach 3359 or even 3340. At that time, we will observe the stabilization of the candlestick chart. Once the downward momentum is exhausted and it starts to close higher, we can buy. The upper pressure is 3380/3400.
Buy: 3359near
Buy: 3340near
Sell: 3380near
Sell: 3400near

Gold: ascending triangle sets up big opportunityGold has traded sideways for 93 days, but breakout traders should take note. A clear ascending triangle is forming, offering a high reward-to-risk setup. I walk through the key levels, breakout zone, and why this could lead to a 6x return. Bulls may be frustrated, but momentum is building. Are you ready?
This content is not directed to residents of the EU or UK. Any opinions, news, research, analyses, prices or other information contained on this website is provided as general market commentary and does not constitute investment advice. ThinkMarkets will not accept liability for any loss or damage including, without limitation, to any loss of profit which may arise directly or indirectly from use of or reliance on such information.

Gold analysis WednesdayHello guys today I update the gold price action analysis, some parts of my journey and plan, and how we must prepare for every scenario that would come. Thankyou for watching

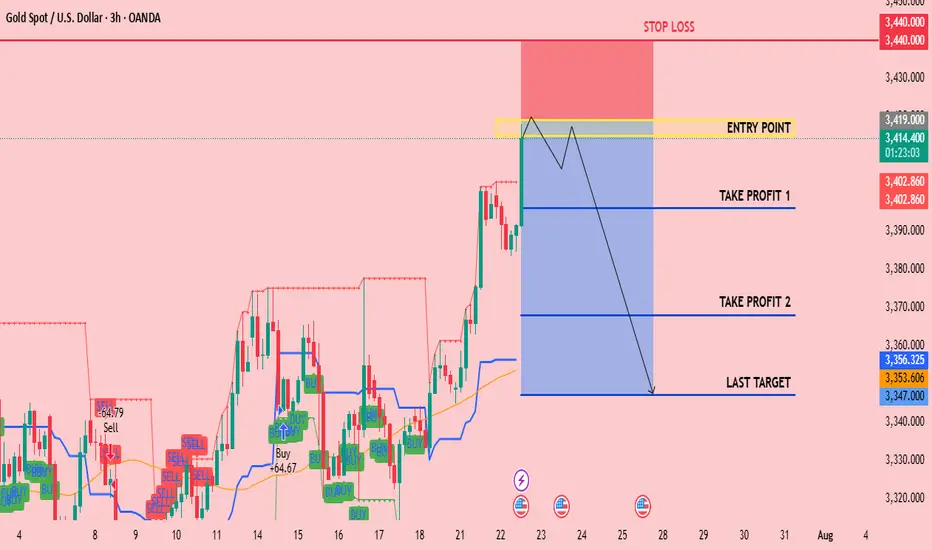
CHECK XAUUSD SIGNAL READ CAPTAINEntry Point: Around 3419 3415
Stop Loss: Around 3440
🎯 Target Levels
Take Profit 1:
3396
Take Profit 2:
3368
last target
3347
XAU / USD 4 Hour ChartHello traders. Happy Friday. Taking a look at the 4 hour chart, I have marked my current area of interest for potential scalp buy / sell trade set ups for gold today. We are curretnly retesting / revisiting the area where gold originally broke out from. Let's see if we move back up to take out any short positions in profit, or do we keep pushing down and break past the bottom of the channel. Trade the trend and never try to force or rush a trade. Shout out to Big G. Let's see how things play out over the next hour or so. If I take a trade, I will post a chart or update this one. Otherwise, have a great weekend. Be well and trade the trend.

Trend corrected, long funds reduced, sellers returned#XAUUSD
The current moving average is still spreading downward, and the 4-hour chart closed with a large negative line. The market has not yet given a clear feedback on the current trend. However, after a large amount of buying funds intervened, the gold price hit a high of around 3377 and then stagnated. The short-term bullish momentum has weakened, and there is a certain risk of a correction and decline. Sellers are beginning to return📉.
Currently, you can consider participating in short selling at 3370-3377💡. If it rebounds directly to 3400-3405, you can still short if it does not break🔍. The target is 3360 below, and 3350 or even 3330 if it breaks🎯.
🚀 SELL 3370-3377
🚀 TP 3360-3350
Gold Market Opens 4th Week of July with Bullish Continuation Gold market opens the 4th week of July maintaining a bullish trajectory, with price action looking to continue toward 3370’s through 3390’s. Market sentiment remains firm as bullish structure builds momentum.
Eyes on the upcoming levels for potential reaction and continuation signals. follow for more insights , comment and boost idea
Weekly analysis and key levels. (Game of probiblities)
Key Levels to Watch This Week
Resistance: 3,378 $ → 3,400 $ → 3,500 $ (ATH).
Support: 3,300 $ (psychological & weekly low cluster) → 3,270 $ (50‑day SMA) → 3,200 $.
Key Levels to Watch This Week
Resistance: 3,378 $ → 3,400 $ → 3,500 $ (ATH).
Support: 3,300 $ (psychological & weekly low cluster) → 3,270 $ (50‑day SMA) → 3,200 $.
Trading tactics (not advice)
Dip‑buyer: Scale in 3,315 $ ± 10 $ with stop under 3,295 $; aim 3,378 → 3,400 $.
Breakout trader: Add above 3,380 $ with tight 20 $ stop for a run at 3,450 – 3,500 $.
Short fade: If Fed surprises hawkish and price rejects 3,380 $, consider short to 3,265
Bullish continuation Daily or 4‑h close > 3,378 $ (last week’s top) 3,400 $ swing high → 3,500 $ record (Apr) Fresh momentum & CTA buying above range.
Range‑trade (base case) Holds 3,310 $–3,380 $ 70 $ box Summer liquidity, traders waiting on Fed.
Pullback risk Break < 3,300 $ 3,265 $ (38 % fib of Mar→Apr rally) then 3,200 $ Profit‑taking + stronger USD.

Gold bear (short term)I think gold going bear to 3370 isch.
All this pushing got gold exhausted and i think a retrace would be in place.
XAUUSD FORMING A CONTRACTING TRIANGLEXAUUSD is forming a contracting triangle which is much visual on the Daily T.F.
This is a continuation pattern.Since Wave 3 is completed,Wave 4 is forming a contracting triangle which is time consuming which can lead to permature trade entries or missed opportunities.
Best trade is to wait for the completion of Wave 4 at the 3055 level,which may push prices higher to the 3850 level a new high.

XAUUSD - Bullish Bias Holding StrongPair: XAUUSD (Gold)
Bias: Bullish
HTF Overview: Multi-timeframe structure aligned bullish. Market is in a clear uptrend across 4H and 1H, currently retracing toward key OB levels.
LTF Confirmation: Waiting on price to mitigate the 1H OB — once tapped, will drop to 15M and 5M for confirmation before any entries.
Entry Zone: 1H OB marked — setup strengthens if inducement or liquidity sweep occurs just before mitigation.
Targets: Short-term target is the previous high — extended target based on 4H continuation range.
Mindset Note: Alignment is there — now it’s about patience and waiting for execution clarity. Let price deliver the opportunity.
Bless Trading!

#3,377.80 Resistance remains strongMy position: I have Bought Gold many times above #3,400.80 benchmark however as it got invalidated, I Bought #3,390.80 again late U.S. session and closed my set of Buying orders on #3,395.80 nearby extension. I left one runner (#3,390.80 entry point) with Stop on breakeven expecting Asian session to recover #3,400.80 benchmark, however it was closed on break-even as Gold extended Selling sequence. I will continue Selling every High's on Gold and if #3,357.80 gives away, expect #3,352.80 and #3,342.80 contact points to be met.
As expected Gold delivered excellent #3,372.80 and especially #3,365.80 - #3,352.80 Selling opportunities throughout yesterday's session which I utilized to it's maximum. I have also Bought Gold on late U.S. session with #3,372.80 as an entry point / however since Gold was ranging, I closed my order on break-even and met Gold below #3,352.80 benchmark this morning personally on my surprise (I did expected #3,377.80 to be invalidated to the upside).
Technical analysis: Gold’s Price-action is performing well below both the Hourly 4 chart’s and Daily chart’s Resistance zones for the cycle. Selling direction of today’s session is directly correlated with Fundamentals leaving the scene which found Sellers near the Intra-day #3,377.80 Resistance and most likely DX will close the Trading week in green, however struggling to make Bullish comeback and if #3,327.80 - #3,342.80 reverses the Selling motion, Gold’s Daily chart’s healthy Technicals which preserved core uptrend values. If the Price-action gets rejected at #3,352.80 - #3,357.80 Resistance zone, then further decline (under conditions where I will have more information with U.S.’s session candle) is possible and cannot be ruled out. Notice that at the same time and manner, Bond Yields are on consecutive Selling spree as well which Fundamentally has a diagonal correlation with Gold. The slightest uptrend continuation there, should add enormous Selling pressure on Gold.
My position: I am Highly satisfied with recent results and will take early weekend break (no need to Trade more). If however you decide to Trade today, Sell every High's on Gold / no Buying until Monday's session (my practical suggestion).

XAU / USD 4 Hour ChartHello traders. Taking a look at the 4 hour chart, I have marked my areas of interest as we are part way through the overnight sessions or so. Let's see if we for support and push back up, or do we keep pusing down today? Patience is key. I will post when the Pre NY volume starts to come in about 4 hours or so from now. Be well and trade the trend, Big G gets a shout out.

BuyRejection Level
Daily Volume
Market Structure Shift
London Session
Trend Line Break
Untapped Order Point
XAU / USD 2 Hour ChartHello traders. We had a nice push up during the overnight sessions. We have Pre NY volume coming in about 20 minutes from this writing. Let's see if today we correct the move up and catch a scalp sell trade or do we keep pushing up to fill the wick to the left? Patience is key, as is entry. I am not trying to force or rush a trade on a Monday. There is plenty of time to wait for the best setup. Let's see how things play out. Big G gets a shout out. Be well and trade the trend.


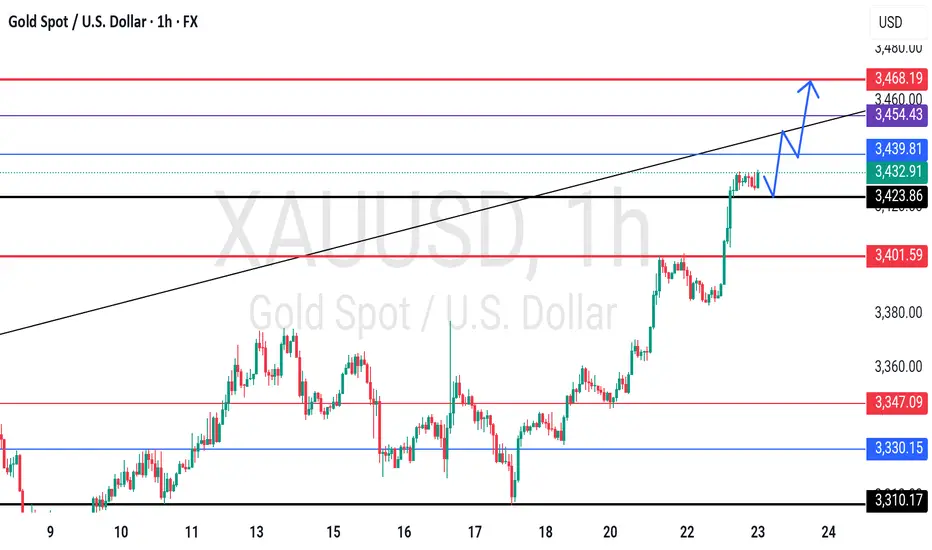
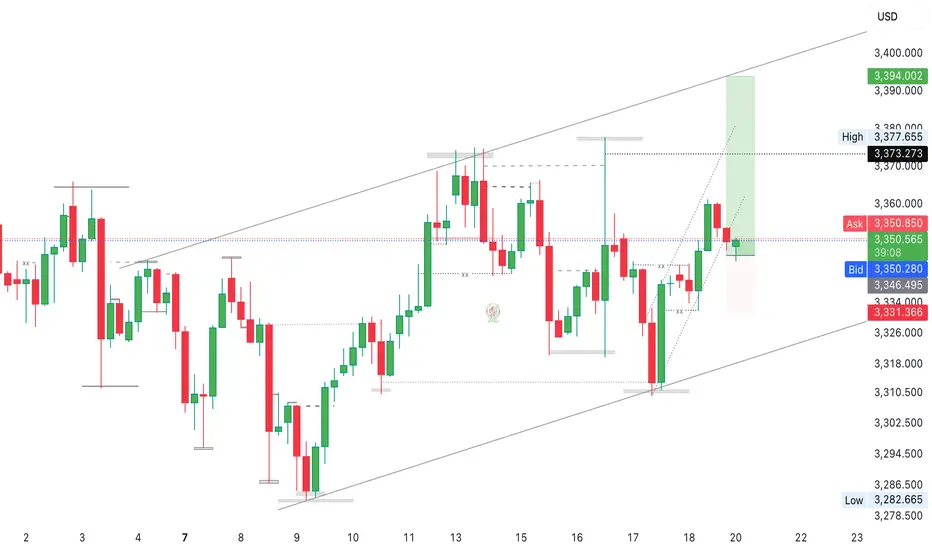
XAUUSD Continues Bullish Structure With Key Retracement OpportunTechnical Outlook – 22/07/2025
On the 1-hour chart, XAUUSD is maintaining a clear bullish market structure with a sequence of higher highs and higher lows. The projected price path drawn on the chart suggests a potential retracement before a continuation toward the 3,420 USD region. Let’s break down the key technical zones and strategies for today:
Key Levels to Watch
Immediate Resistance: 3,390 – 3,400 USD
This is the recent high. A breakout above this area could trigger momentum toward the projected 3,420 USD extension.
Support Zone: 3,345 – 3,350 USD
This zone aligns with the potential pullback as illustrated on the chart, offering a high-probability buy-the-dip opportunity. It coincides with previous structure resistance now turned support.
Trendline Support: The ascending yellow trendline has been respected multiple times and should act as dynamic support on any intraday retracements.
Indicators & Tools Used
EMA: Price is currently trading above the short-term EMA (not shown), suggesting intraday bullish bias remains intact.
RSI (Recommended Use): Look for RSI near 40–50 on the pullback for confluence at support.
Fibonacci Tool (suggested): If measuring from the swing low near 3,320 to the high of 3,390, the 0.618 Fib lies close to 3,345 – an ideal area to look for long entries.
Suggested Trading Strategies
🔹 Buy the Dip Strategy:
Wait for a corrective move into the 3,345–3,350 area. Confirm with bullish reversal candles or RSI support, then enter long targeting 3,400–3,420. Stop-loss ideally below 3,335 (structure break).
🔹 Breakout Continuation Strategy:
If price breaks cleanly above 3,390 with volume, a momentum trade toward 3,410–3,420 is viable. Use tight trailing stops to protect gains.
🔹 Avoid chasing highs – Patience at support zones or confirmation above resistance will offer better reward/risk setups.
Conclusion
Gold is respecting bullish market behavior on the 1H chart, and while a short-term correction is expected, the broader trend favors upside continuation. The 3,345–3,350 area will be critical for today's trading decisions.
Remember to follow for more updates and strategy insights. Save this post if you find it useful.
If you’d like, I can also add a version using RSI or Fib levels directly plotted. Let me know.
