Gold Market Analysis (XAU/USD) – MMC Analysis + Liquidity Target🧠 Market Context Overview:
Gold recently experienced a highly impulsive move from a major demand zone, suggesting strong smart money activity. The market is currently in the redistribution phase of the MMC (Market Maker Cycle), transitioning between a reversal impulse and a liquidity targeting move.
Let’s dissect the key zones, structure, and confluences that support the ongoing market narrative.
📍 1. Strong Demand Reaction (3X Demand Spike):
We start with a triple-tap demand rejection, where the price sharply reversed to the upside. This kind of movement typically represents:
Institutional Entry Points
Stop-Hunt Below Previous Lows
Liquidity Grab Before Expansion
This strong bullish engulfing candle signifies position building by smart money, often the beginning of a significant leg up.
🧱 2. Reversal Zone & Liquidity Imbalance:
The highlighted green zone between $3,370–$3,375 is crucial. Why?
It’s an inefficiency zone where price moved too fast with low resistance.
This created a liquidity void that typically needs to be revisited (also known as FVG – Fair Value Gap).
The area also coincides with structural resistance, making it a high-probability target for price to revisit and reject again or break through with intent.
📌 Smart money always returns to areas of unfilled liquidity to close their positions or trap late retail entries.
🔺 3. Volume Contraction (Wedge Pattern Formation):
After the explosive push upward, the market started compressing, forming a descending wedge — a classical volume contraction pattern.
What does this mean?
Volatility is decreasing
Liquidity is building up
Big breakout is expected
It’s like pulling a slingshot — the more it contracts, the stronger the release will be. The direction will depend on which side breaks first.
🔁 4. Previous Structure Flipped (Support turned Resistance):
You’ll notice a key level around $3,353–$3,355 acting as a flipped structure.
This was previously a support zone that got broken.
Now it’s acting as resistance — a classic example of support/resistance flip.
This adds confluence to the idea of a possible rejection or reaction in this area.
🧠 Structure flipping is a smart money trick — break structure, retrace to trap liquidity, and then run the opposite direction.
📊 5. MMC Logic – Market Maker Cycle in Play:
Here’s how the MMC is flowing:
Accumulation (bottom consolidation)
Manipulation (liquidity sweep below demand)
Expansion (aggressive upward move)
Contraction (volume dies, price slows down)
Now we’re waiting for the next manipulation or expansion phase.
The current wedge is the pause before the next move, which could fill liquidity in the reversal zone or go lower to sweep resting sell-side liquidity.
🎯 Trading Scenarios:
✅ Bullish Bias (if breakout happens):
Break and close above the wedge
Retest previous flipped structure successfully
Target: Liquidity zone at $3,370–$3,375
🎯 This move would fill the imbalance and potentially tag sell-side liquidity sitting at the top.
❌ Bearish Bias (if rejection holds):
Failure to break above flipped structure
Breakdown from the wedge
Target: Demand origin around $3,325–$3,315
🧲 A move lower would make sense if liquidity remains uncollected beneath the range.
🧵 Final Thoughts:
Gold is currently in a high-probability setup zone. We have:
✅ Clear demand reaction
✅ Imbalance above
✅ Volume contraction
✅ Flipped structure
✅ Strong MMC confluence
Now it's a waiting game. Let the market show its hand — either a clean breakout with volume or a fakeout/rejection and reversal.
📌 "Trade what you see, not what you think. Let the levels and liquidity guide your decision."
XAUUSDK trade ideas

XAU / USD 30 Minute ChartHello traders. Here is a quick 30 minute chart showing where I am looking for potential buy scalp and sell scap trade set ups. Let's see how the current 30 minute candle closes. Pre NY volume starts coming in about 40 minutes from this writing. Big G gets a shout out. Be well and trade the trend.

Xausd techinical analysis.This chart shows the Gold Spot price vs. the U.S. Dollar (XAU/USD) on a 1-hour timeframe, with some key technical analysis elements applied. Here's a breakdown of the key components:
---
🔍 Chart Analysis
1. Current Price:
The current market price is 3,344.875, down 0.32%.
2. Support Zones (Purple Rectangles at Bottom):
Around 3,335 – 3,340
Lower support around 3,325 – 3,330
3. Resistance Zone (Purple Rectangle at Top):
Around 3,370 – 3,375
4. **Trendline (Pink


GOLD - 1H VIEWStill looking for a move lower in the coming weeks. There are 2 possible zones I would like to see Gold sell off from:
Zone 1: $3,356 - $3,340 (CMP)
Zone 2: $3,406 - $3,426
Being patient, with no current sells. This analysis is just my current theory. If $3,450 (Wave 2 high) is taken out, then we are heading towards $3,600+

Short position profit, focus on 3355-3345 support📰 News information:
1. Focus on tomorrow's CPI data
2. Bowman's speech at the Federal Reserve
3. Tariff information outflows and countries' responses to tariff issues
📈 Technical Analysis:
The short-term bears have successfully hit the TP to realize profits, and the trading strategy is still valid. Continue to pay attention to the 3355-3345 support during the day. If effective support is obtained here, you can consider going long. For the rebound, the first TP can focus on the 3365 line. If the gold price breaks through 3380 in the future, it will not be far from 3400. If it falls below, pay attention to the support of 3330-3320 below. It is expected that this is the limit position of short-term bearishness. The impact of tariffs is still there, and the bullish trend remains optimistic in the short term, unless Europe, Japan and other countries have a new solution to tariffs.
🎯 Trading Points:
BUY 3355-3345
TP 3365-3380-3400
In addition to investment, life also includes poetry, distant places, and Allen. Facing the market is actually facing yourself, correcting your shortcomings, facing your mistakes, and exercising strict self-discipline. I share free trading strategies and analysis ideas every day for reference by brothers. I hope my analysis can help you.
OANDA:XAUUSD PEPPERSTONE:XAUUSD FOREXCOM:XAUUSD FX:XAUUSD TVC:GOLD FXOPEN:XAUUSD

Gold Price Analysis: Bearish Trend Likely to ContinueGold Price Analysis: Bearish Trend Likely to Continue
Gold prices have been forming lower lows, signaling a sustained **bearish trend in the market. This downward movement indicates weakening bullish momentum, with sellers dominating price action. Currently, the price is moving in a secondary trend (a short-term correction within the broader primary trend). However, in the upcoming trading sessions, this secondary trend may conclude, leading to a resumption of the primary bearish trend.
A key factor to watch is the emergence of a candlestick reversal pattern, such as a bearish engulfing or evening star formation, which could confirm further downside momentum. If such a pattern appears, gold prices may extend their decline, potentially testing the critical support level near $3,250. A decisive break below this level could accelerate selling pressure, opening the door for deeper corrections.
On the upside, $3,450 remains a strong resistance zone. Any rebound attempts could face rejection near this level unless there is a significant shift in market sentiment—such as a dovish Fed policy change or renewed safe-haven demand. Traders should monitor key economic data, including inflation reports and interest rate decisions, as these factors heavily influence gold’s direction.
Key Levels to Watch:
- Support: $3,250 (Break below may trigger further selling)
- Resistance: $3,450 (Reversal point if buyers regain control)
Trading Strategy:
- Short-term traders may look for selling opportunities near resistance levels, targeting $3,250.
- Long-term investors should wait for a confirmed trend reversal before entering bullish positions.

XAU / USD 4 Hour ChartHello traders. New week, gold opened with a nice push up. Taking a look at the 4 hour chart I have marked my areas of interest for me to see what happens during the overnight sessions. Wishing everyone a safe and profitable trading week. Shout out to Big G. Be well and trade the trend. I will post again in the later part of the London session or when Pre NY volume starts in the morning here in the US. Thanks so much.

The short-selling idea remains unchanged, defend 3355📰 News information:
1. Powell responds to White House issues
2. Will other countries impose reciprocal sanctions on tariffs?
📈 Technical Analysis:
Gold closed with a long lower shadow on the daily line yesterday and closed with a doji on the hourly line. In the short term, gold may continue to rise and is expected to touch the 3355 line. If gold cannot break through and stabilize above 3355, then gold may fall back. We can still consider shorting, and the target can be 3330. If the trend is as expected, it may form the embryonic form of a head and shoulders bottom. On the contrary, if the gold price breaks through 3355, stop loss on short positions and pay attention to the high resistance of 3375-3385.
🎯 Trading Points:
SELL 3340-3355
TP 3330-3320
In addition to investment, life also includes poetry, distant places, and Allen. Facing the market is actually facing yourself, correcting your shortcomings, facing your mistakes, and exercising strict self-discipline. I share free trading strategies and analysis ideas every day for reference by brothers. I hope my analysis can help you.
TVC:GOLD PEPPERSTONE:XAUUSD FOREXCOM:XAUUSD FX:XAUUSD OANDA:XAUUSD FXOPEN:XAUUSD

Daily live trade with XAUUSD in 15m/30m/1h 20250718Daily live trade with XAUUSD in 15m/30m/1h 20250718

Treat it as a long-short wash-out shock, and go long on pullback📰 News information:
1. Initial jobless claims data
2. June retail data
3. Beware of Trump's remarks about firing Powell
📈 Technical Analysis:
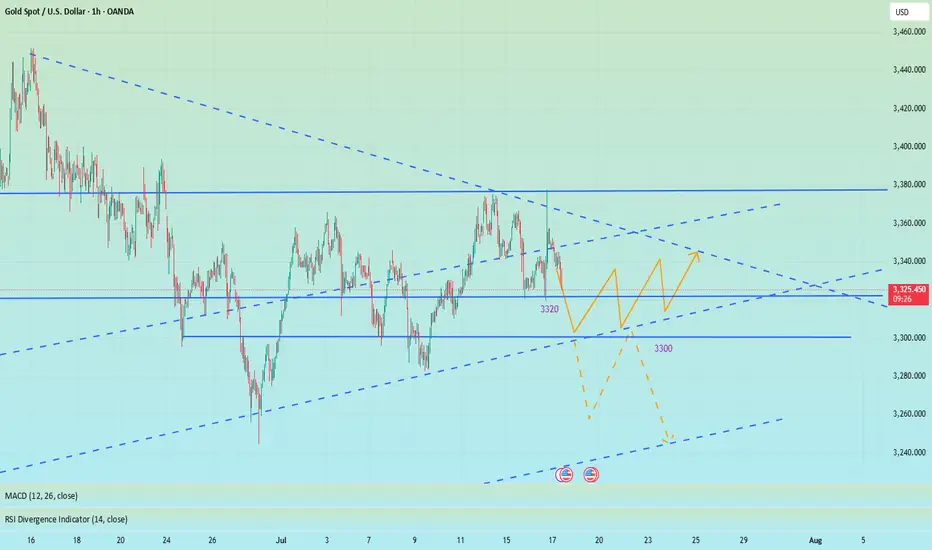
Last night, the daily line closed at around 3347. The current short-term daily line range is 3355-3300. The short-term support below is still 3320. Once it falls below 3320, it will look to 3310-3300. Short-term trading is still volatile. If the intraday retracement reaches 3320-3310, consider going long, and the defense is 3300, with the target at 3340-3350. Under the current rhythm of long and short wash, don't chase the rise and sell the fall, look at it rationally, and brothers who trade independently must bring SL.
🎯 Trading Points:
BUY 3320-3310
TP 3340-3350
In addition to investment, life also includes poetry, distant places, and Allen. Facing the market is actually facing yourself, correcting your shortcomings, facing your mistakes, and exercising strict self-discipline. I share free trading strategies and analysis ideas every day for reference by brothers. I hope my analysis can help you.
FXOPEN:XAUUSD OANDA:XAUUSD FX:XAUUSD FOREXCOM:XAUUSD PEPPERSTONE:XAUUSD TVC:GOLD
XAU / USD 1 Hour ChartHello traders. Taking a look at the hourly chart, I have marked my no trade zone / area of interest for the upcoming sessions. I also marked where I would look for a long position if we dipped down to said area. Let's see how the overnight sessions play out. Big G get all my thanks. Be well and trade the trend. Thank you for checking out my analysis.

GOLD - SHORT TO $2,800 (1H UPDATE)Taking a HIGH RISK ENTRY here for sell's. Bearish momentum seems to be kicking in, so I am willing to take a high risk entry, with a smaller lot size then usual.
Our second entry zone still sits higher around $3,400 so I am being careful here with tight risk management.

XAU/USD analysis & outlookWeekly Outlook: GOLD (XAUUSD)
This week, I’ll be monitoring different scenarios, as price is currently far from any of my key Points of Interest (POIs).
My nearest potential buy is around the 3-hour demand zone. While it's not the most ideal entry—since it isn’t located in a discounted area—I’ll still keep an eye on it.
That said, I would prefer to see a deeper retracement into the 6-hour demand zone, which is in a far more discounted region. This zone offers a stronger setup, and I could see price launching from there again if tapped.
We’ve already seen a strong bullish reaction from last week’s demand zone, and based on current momentum, I could see price continuing upward until it reaches my next sell opportunity—the 3-hour supply zone, which sits at a premium level.
Confluences for GOLD Buys:
✅ Bullish structure — price has broken to the upside and remains overall bullish.
✅ Fresh 3H and 6H demand zones formed, which price could return to.
✅ Liquidity above — including trendline liquidity and previous Asia highs.
✅ Fundamentals — potential tariff cuts could fuel long-term bullish momentum for gold.
✅ Bearish Dollar Index (DXY) aligns with the bullish gold outlook.
📌 If price doesn’t retrace and instead continues to push higher, I’ll wait for another break of structure to the upside on the way toward the supply zone before reassessing entries.
Let’s stay focused and let the market come to us. Wishing everyone a great trading week ahead! 👊📈


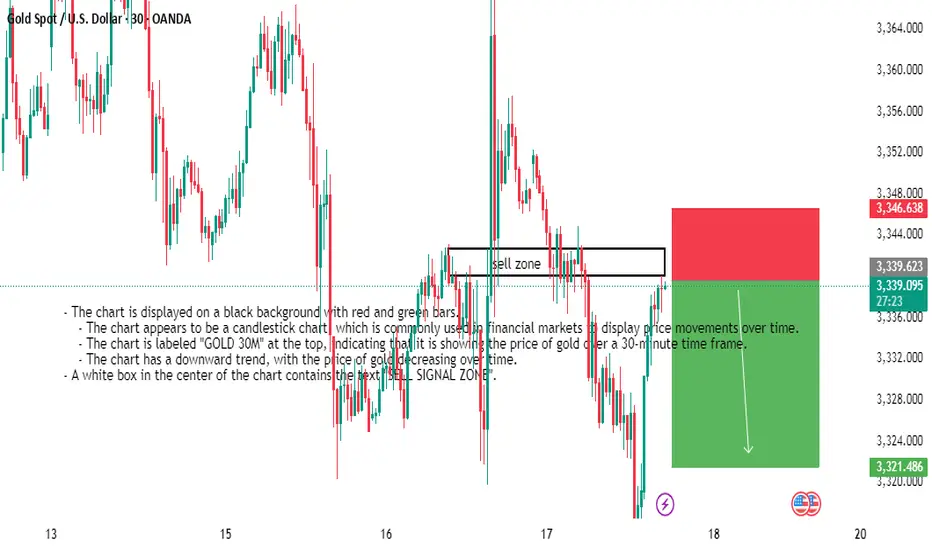
xauusd 30m analysis- The chart is displayed on a black background with red and green bars.
- The chart appears to be a candlestick chart, which is commonly used in financial markets to display price movements over time.
- The chart is labeled "GOLD 30M" at the top, indicating that it is showing the price of gold over a 30-minute time frame.
- The chart has a downward trend, with the price of gold decreasing over time.
- A white box in the center of the chart contains the text "SELL SIGNAL ZONE".
The firing of Powell set off the market, don't chase the longsTrump showed a draft of the letter to fire Powell, but whether Powell will be fired in the end remains to be seen, but the impact on the gold market is undoubtedly huge. The wolves have now smelled a very dangerous scent. Don’t chase high prices. Don’t chase high prices! ! ! After all, the impact of the news comes and goes quickly, and there is a high possibility of a reversal later in the evening. The final suppression position of the current gold daily line is 3340. If the closing line today can maintain above 3340, then gold will usher in a real bullish trend in the future.
OANDA:XAUUSD
Gold Spot / U.S. Dollar (XAU/USD) 4-Hour Chart4-hour chart from OANDA displays the price movement of Gold Spot (XAU/USD) against the U.S. Dollar, showing a current price of $3,329.145 with a decrease of $18.455 (-0.55%). The chart highlights key levels including a sell price of $3,328.920 and a buy price of $3,329.370, with a recent trading range between $3,355.339 and $3,312.393. The data spans from late June to mid-July 2025, with notable price fluctuations and a shaded area indicating a potential trading zone.

XAUUSD: Market analysis and strategy for July 16.Gold technical analysis
Daily chart resistance level 3382, support level 3300
Four-hour chart resistance level 3365, support level 3320
One-hour chart resistance level 3342, support level 3325.
Yesterday, the lowest price fell to 3320, then fluctuated upward, and rebounded to 3343. As the price fell below 3341 yesterday and accelerated downward, a transition from support to resistance was formed here. Focus on the high point of the NY market rebound yesterday, 3352. Whether it can break through here will determine whether the market continues to rise or is blocked and then falls back like yesterday.
It is worth noting that the trend of the past two days is that Asia is rising and rebounding, and the NY market is falling. Today may be a cycle of yesterday and the day before yesterday. At present, gold is fluctuating and rebounding at 3320. If the NY market cannot break through 3352, it will continue to fall. For the time being, it can be sold high and bought low in this range. After falling below 3320, the next short-term target is 3310~3300.
BUY: 3324 SL: 3320
SELL: 3320 SL: 3325
SELL: 3352 SL: 3357

Excellent Profits / quick updateAs discussed throughout my yesterday's session commentary: "My position: My strategy remains the same, Buying every dip on Gold on my calculated key entry points which Gold respects and ultimately, anticipating #3,377.80 Resistance break-out to the upside."
I have broken my personal record throughout yesterday's session (#200.000 EUR Profit) using #25 and #50 Lots, Buying Gold with set of Scalp orders within #3,340's, #3,330's and final #3,327.80 reversal zone. I will not make any more moves today, will call it for the session and await tomorrow's E.U. session Highly satisfied with Profit. Needless to mention, #3,377.80 and #3,400.80 mark remains my Medium-term Target zones as I continue Buying every local Low's for us.

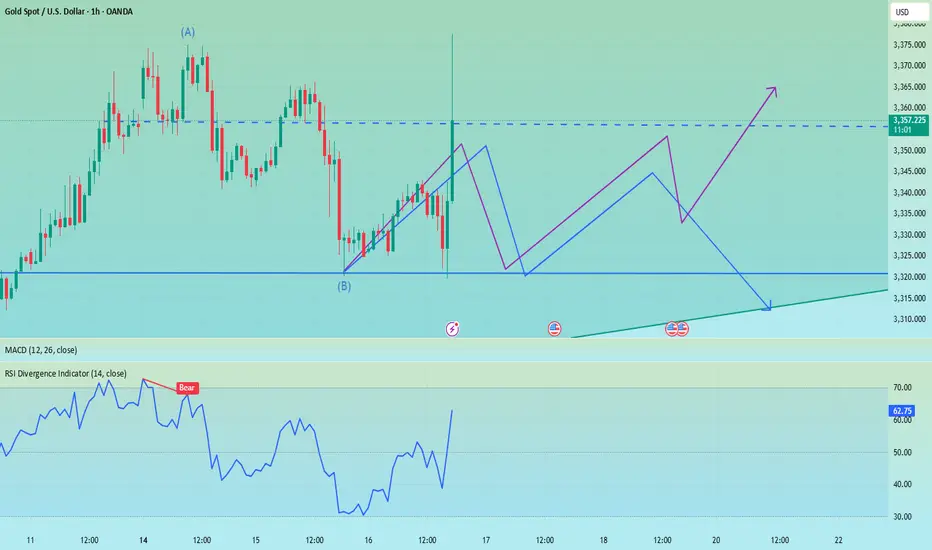
XAUUSD Trade Plan | 15 July 2025After observing the recent low breakdown and a clear liquidity grab, we saw a strong direction confirmation breakout. This suggests that the market is likely to continue its upward momentum.
🔄 Breakdown/Seller Trap triggered the reversal
🔹 Last Important Low respected
📈 Breakout confirms bullish direction
✅ Plan:
I’ll be watching for a pullback into the grey demand zone (highlighted area) for a potential long entry.
🕵️♂️ No FOMO — I’ll only enter after price shows clear bullish behavior in this zone.
🎯 Target: 3,365.89 resistance
📍 Entry Zone: Grey box (based on previous structure)
Let me know your thoughts — are you also watching this zone?
#XAUUSD #GoldAnalysis #LiquidityGrab #SmartMoneyConcepts #PriceAction #TradingPlan #TradingView

Gold----Buy near 3348, target 3369-3389Gold market analysis:
Looking back at last week's market, the market performance on Monday and Tuesday last week was quite abnormal, belonging to the rhythm of a big oscillation. The following three trading days were basically relatively normal, and the market rose all the way after the buy-in. The overall market was a bottoming-out and rebounding market. Recently, investors are very confused about whether the general trend is bullish or bearish? First of all, we need to distinguish how long the general trend cycle is? If you look at the weekly line, you can at least see a 2-4 week trend. If you want to see a trend for a month, then you have to look at the weekly K-shaped and monthly trend. I understand that the long-term trend is at least a trend of one month to half a year. With the current instability of the international situation, the trend of Russia and Ukraine, the situation in the Middle East, and Trump's global tariff war, I think the half-year trend is bullish. We are short-term traders, and basically can't see that far. Looking at the trend of one week at most is the limit. Playing with long-term trends requires a 100-point mentality, and playing with short-term trends only requires technology. The first thing every Monday is to figure out the trend of the week. Buy short-term climb at the weekly close. This week's thinking is bullish first. We estimate that there will be a decline in the second half of the week. Today's weekly line is treated as a low-price buy first, and pay attention to the retracement to the support to buy. The low point of Friday's retracement near 3348 is a new support, and it is also the starting point of the pattern support 3344. In addition, the hourly stepping point is near 3342. If it does not break 3342 today, insist on buying. If it breaks, adjust the thinking to be bearish in time. A small step on the Asian session is also an opportunity to get on the train.
Pressure 3397, support 3348, 3345, 3342, the watershed of strength and weakness in the market is 3342.
Fundamental analysis:
Last week, Trump increased tariffs on Canada and will soon increase tariffs on Brazil. There is no signal of stopping the tariff war. It is long-term bullish for gold. The situation in the Middle East has not completely stopped, and it is also a long-term suppression of the US dollar to support gold.
Operation suggestion:
Gold----Buy near 3348, target 3369-3389
