Gold opening market trend analysis.Last week, the gold price rebounded after hitting the low of 3310. The 4-hour chart shows that the Bollinger Bands failed to open downward, and the current market still maintains a volatile trend. Although the short-term price is easy to rise and difficult to fall, it should be noted that the three-month adjustment cycle is coming to an end when the fundamentals of the bull market remain unchanged, and the daily level change window is approaching. It is recommended to focus on preventing risks (especially short-term operation risks) at the opening today and wait patiently for the unilateral market start signal. In terms of short-term operations, the hourly chart price broke through the key level of 3344 after stepping back to the support of 3332. Today's overall trend is volatile and bullish. It is recommended to wait for the price to fall back to the 3337-3342 range to arrange long orders in batches at the opening today. Focus on the 3356-3366 resistance band above. If you encounter resistance, you can try short-term operations. Be sure to strictly stop losses to prevent the risk of false breakthroughs.
XAUUSDK trade ideas

Gold in Correction modeAs you can see in the analysis now gold is in correction mode and according to CRT also gold have to tap 3277 so be ready for 3277 by anytime as trade tentions are also cooling down which lead to dollar go up and gold go down.
Gold Market Completes Bullish Wedge at 3439Gold market lures to 3439, completing the bullish wedge formation as anticipated.
A retracement is now setting in, with price action expected to sweep through 3391—a key zone that may determine the next leg of the trend.
Watch closely for confirmation at this level for a potential bullish continuation or deeper correction. follow for more insight , comment and boost idea
XAU/USD(20250723) Today's AnalysisMarket news:
White House officials plan to visit the Federal Reserve headquarters on Thursday local time.
Technical analysis:
Today's buying and selling boundaries:
3416.02
Support and resistance levels:
3465.76
3447.17
3435.12
3396.94
3384.89
3360.33
Trading strategy:
If the price breaks through 3435.12, consider buying, the first target price is 3447.17
If the price breaks through 3416.02, consider selling, the first target price is 3396.94

Gold at $3400: Time to Capitalize on the Surge!FUNDAMENTAL ANALYSIS
After a monumental 500-pip bullish run this morning, gold now stands at $3400. This significant upward momentum presents a prime opportunity for a strategic reversal.
We are issuing a SELL signal from $3400!
Technical Resistance: After such a sharp bullish move, gold is likely to encounter significant technical resistance levels at or around the $3400 mark, potentially triggering profit-taking and a reversal. Overbought indicators on technical charts could also signal an imminent pullback.
Don't miss this opportunity to capitalize on the market's dynamics. The recent surge may have set the stage for a profitable downturn.
ENTRY POINT 3400
TARGET 3380
STPLOSS 3410

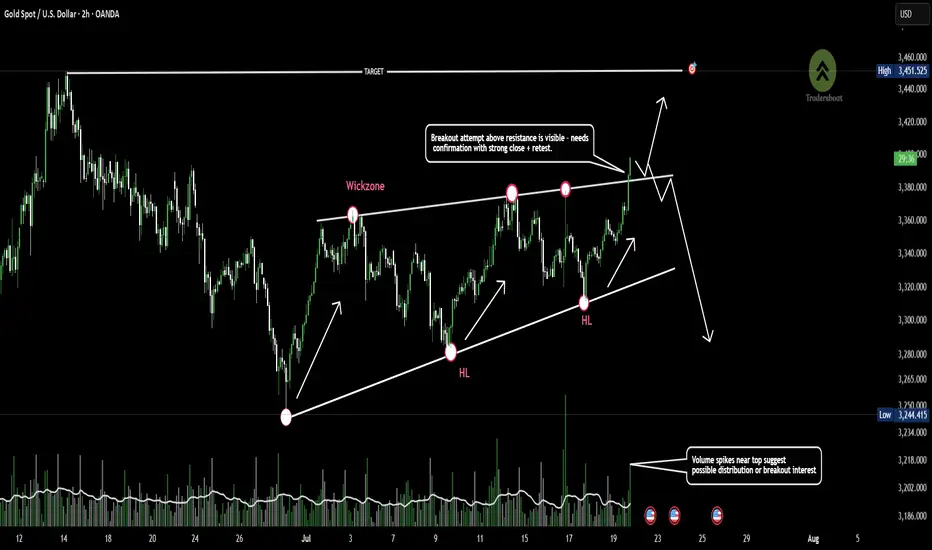
Gold approaches wedge resistance -Breakout or Fakeout incoming?Gold is trading within a rising wedge pattern, showing consistent higher lows and repeated rejections near the 3400 resistance zone.
Price is now approaching the upper trendline, an area of prior wick rejections and potential liquidity grab.
A confirmed breakout could signal continuation, while failure to sustain above this level may indicate bearish divergence or a reversal setup.👀📉
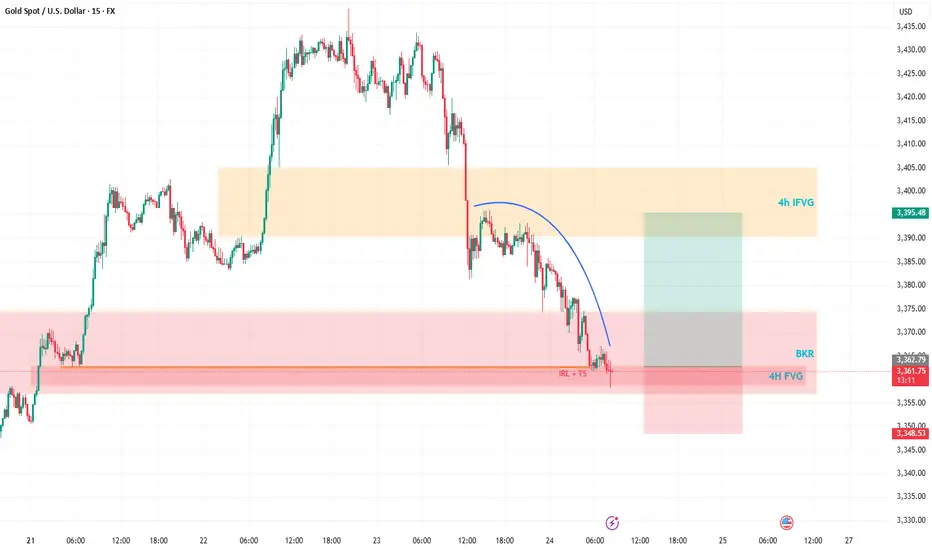
Gold’s Wild Ride: A Trader’s Take on What’s NextHey Fellow Traders! 👋
Gold’s been an absolute beast this week, smashing through both buyers and sellers like it’s playing a high-stakes game of market whack-a-mole! 😅 After Wednesday’s wild moves and today’s follow-up, Gold’s keeping us all guessing.
Right now, I’m not locking in a long-term bias—Gold’s too unpredictable for that. But here’s the exciting part: I’m eyeing a short-term long opportunity. Why? The price just dipped into a 4H Fair Value Gap (FVG) and tagged a Breaker, setting up a potential bounce. 📈
My plan? I’m expecting Gold to sweep up the highlighted liquidity and charge toward the 4H Inversion Fair Value Gap (IFVG). Once it hits that zone, I’ll be glued to the charts, watching for its reaction to decide the next move. 🧐
As always, trade smart! Set your stops, size your positions wisely, and don’t let Gold’s volatility catch you off guard. Protect your capital first—always! 💡
What’s your take on Gold right now? Are you jumping on this setup or waiting for more confirmation? Drop your thoughts in the comments below, give this post a like, and follow for more updates! 👇 Let’s keep the trading convo going! 🔥
Gold (XAUUSD) Technical Analysis UpdateGold is currently consolidating within the narrow range of 3425–3430, following a strong uptrend. Price action remains bullish overall; however, the market is currently pausing below immediate resistance.
📊 Key Observations:
Trend: Market structure remains in an uptrend.
RSI (14): The RSI on the 1H timeframe is in the overbought zone, suggesting that momentum may be cooling off short term.
Support Zone: If the H1 candle closes below 3420, it may indicate weakness, potentially triggering a pullback toward the support zone between 3385–3370.
Upside Potential: A confirmed break above 3430 with strong momentum could open the path toward the next resistance levels at 3450 and 3465.
🕵️♂️ What to Watch:
1H candle close above 3430 = continuation bias
1H candle close below 3420 = possible retracement
RSI divergence or volume confirmation for breakout or reversal signals
This is a technical perspective only and not financial advice. Always manage your risk appropriately.
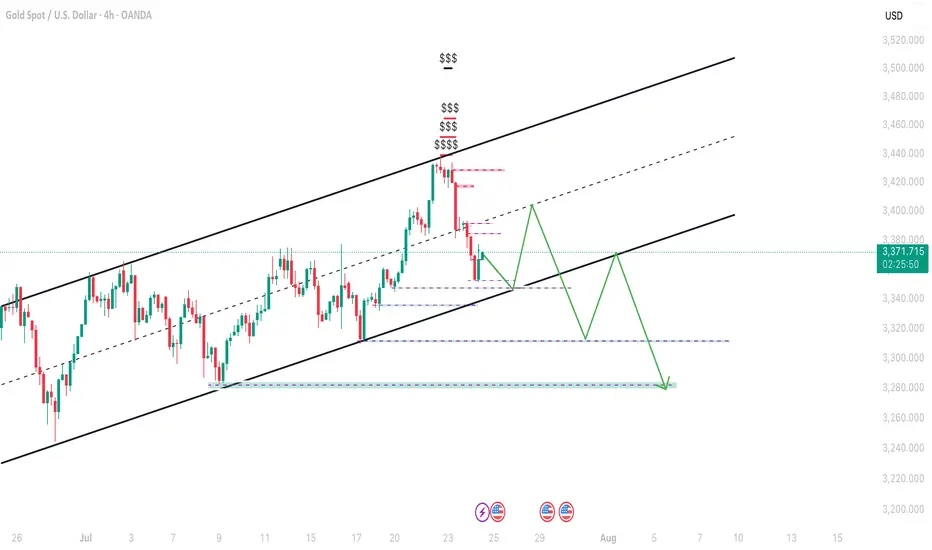
XAU/USD /IDEAGold continues its second consecutive aggressive bullish move, but the structure is beginning to show signs of a potential correction.
During this rally, highs and liquidity were taken,
and previously unfilled FVG zones from about a month ago have now been filled.
I'm watching for a possible correction toward the discount zone around 3360, where the following are located:
– A daily FVG
– A 4H FVG
– 1H Equal Lows, with clear liquidity resting below
If price sweeps the liquidity below these equal lows and reacts around 3360, I will anticipate a continuation of the bullish trend.
However, if a solid setup forms before that, I may enter a short position targeting 3360, where I’ll be looking to close the trade and potentially position for a reversal.
No entry yet – watching closely and waiting for price confirmation.

Correction in Play, Long-Term BUY Opportunity Ahead XAUUSD 24/07 – Correction in Play, Long-Term BUY Opportunity Ahead
🧭 Market Outlook
Gold has dropped sharply from the 343x region, exactly as outlined in yesterday’s plan. Price has broken below the ascending trendline on the H1 chart and is now tapping into lower liquidity zones (FVG + OBS), signaling continuation of the short-term bearish move.
Key context to watch:
Traders are awaiting final decisions on US global trade policy agreements.
Next week’s FOMC meeting may confirm expectations of an interest rate cut.
Later today, markets will react to US PMI data and Jobless Claims, which could trigger volatility.
📊 Technical View
While the higher timeframe trend (D1/H4) remains bullish, the short-term structure has broken, and the market is now exploring unfilled liquidity pools below. Once these are swept, we anticipate a strong long-term BUY opportunity.
🎯 Trading Plan for Today
📌 Short-Term Strategy:
Look for short-term SELL setups on retracements toward resistance zones. Wait for clear rejection signals before entering.
📌 Mid/Long-Term Strategy:
Prepare to BUY from major Key Levels once price taps into deep liquidity zones. Ensure confluence and good risk/reward before entering.
🔎 Key Levels to Watch
🔺 Upper Resistance Zones:
3393 – 3404 – 3414 – 3420 – 3428
🔻 Lower Support Zones:
3375 – 3366 – 3352 – 3345 – 3330
🔽 Trade Setups
✅ BUY ZONE: 3352 – 3350
SL: 3345
TP: 3356 → 3360 → 3364 → 3370 → 3375 → 3380 → 3390 → 3400
🔻 SELL ZONE: 3414 – 3416
SL: 3420
TP: 3410 → 3406 → 3400 → 3395 → 3390 → 3380
⚠️ Risk Reminder
No major economic news is scheduled for today, but unexpected political statements or geopolitical tensions could cause price spikes.
✔️ Always follow your SL/TP strictly.
✔️ Avoid entering without solid confirmation.
✔️ Watch how price reacts to the levels above.
📣 Follow MMF on TradingView
If this trading roadmap helps your strategy,
📌 Follow the MMF team on TradingView for daily actionable setups, real levels, and no-nonsense analysis based on real market conditions.
🎯 Real trades. Real zones. Real discipline.

Gold 1H Intra-Day Chart 24.07.2025We saw a perfect rejection from our $3,437 zone and a drop into our first TP of $3,380. What's next?
Option 1: Gold keeps dropping lower into $3,360.
Option 2: Gold buyers hold around $3,380 & push price back up.
Which scenario do you find more likely?

Trendline BreakThe price looks to go long after the price broke a trendline and made a pullback
WE ONLY TRADE PULLBACKS

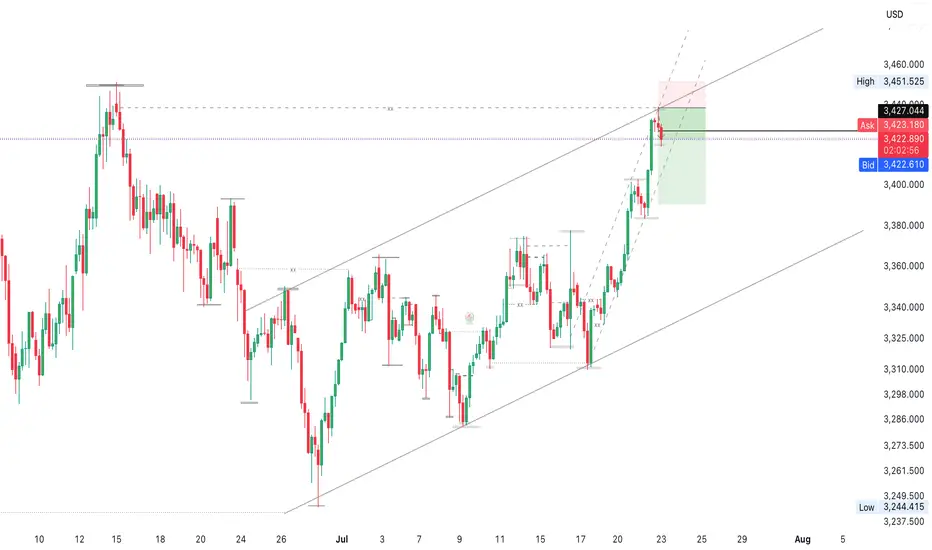
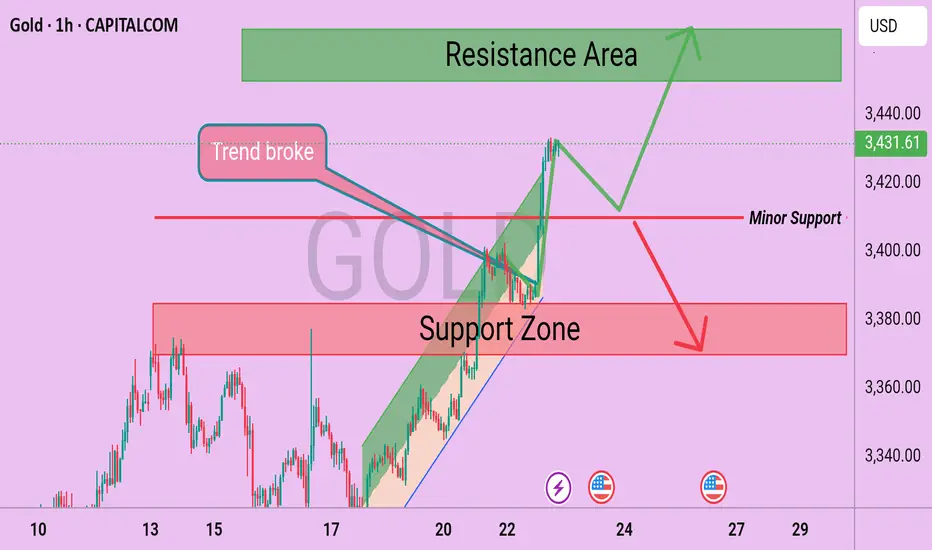
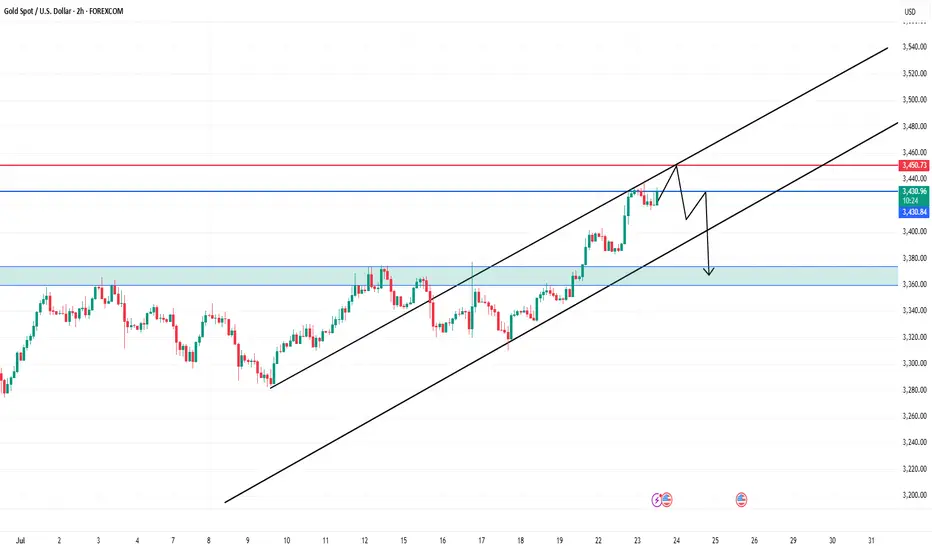
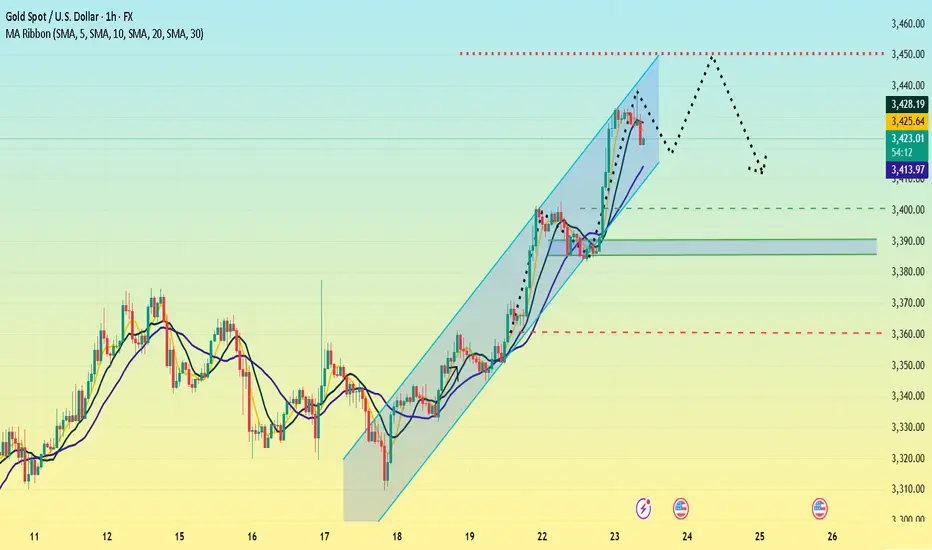
Gold at Key Resistance – Bearish Pullback Ahead?Technical Analysis (2H Chart)
1. Trend Structure:
Price is moving in a clear ascending channel (black trend lines).
Currently testing the upper boundary of the channel, which may act as resistance.
2. Resistance Zones:
$3,431–$3,450: Strong resistance zone.
Horizontal resistance at $3,450.73 (marked in red).
Price may form a lower high before reversal, as the black arrow suggests.
3. Support Zones:
$3,374 – $3,360: Previous structure and demand zone (highlighted green).
Strong potential bounce zone if price drops.
4. Price Action Expectation:
Possible fakeout or retest near $3,450 → followed by a rejection and drop toward the $3,360 area.
Bearish bias indicated by the projected path.
XAU / USd 1 Hour Chart Hello traders. It was an impulse buy, but it worked out well. The chart shows it all. Perfect mvoe up, did well for my 1 trade this week thus far. Big G gets a shout out. Be well and trade the trend.

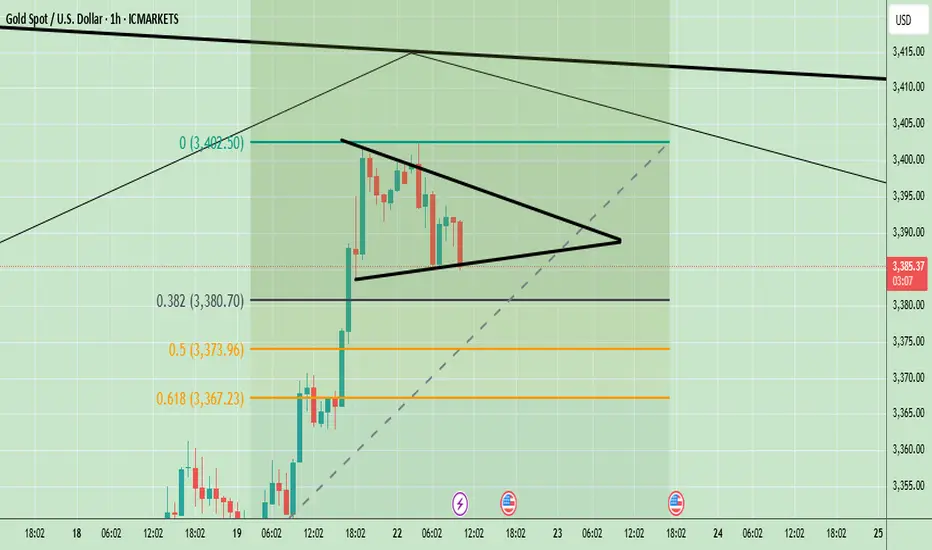
XAUUSD Technical Analysis – Triangle Breakout Ahead?Gold is currently consolidating in a symmetrical triangle pattern around $3,389. If it breaks above $3,402, we can expect a bullish continuation toward $3,420 and beyond. Key support lies at $3,367; a breakdown below this level would turn the trend bearish. The overall trend is still bullish, but a breakout is needed for confirmation.
📈 Potential Scenarios:
✅ Bullish Breakout Scenario:
- Break above $3,392–$3,402 zone.
- Targets: $3,420 > $3,450 > $3,480
- Supported by strong upward BOS (Break of Structure) and higher lows.
❌ Bearish Breakdown Scenario:
- Breakdown below $3,373–$3,367 zone.
- Targets: $3,355 > $3,345
- Would invalidate current bullish structure and form a lower low.
🔮 Trend Bias:
Bullish Bias remains intact as long as price stays above $3,367 and maintains higher lows. However, consolidation suggests waiting for breakout confirmation from the triangle before entering new trades.
🧭 Trend Outlook:
Gold is currently consolidating in a symmetrical triangle pattern, which typically precedes a breakout — either upward or downward. The price is holding above the key Fibonacci support levels and the overall market structure is bullish, suggesting an upward continuation is more likely if buyers maintain momentum.
Note
Please risk management in trading is a Key so use your money accordingly. If you like the idea then please like and boost. Thank you and Good Luck!
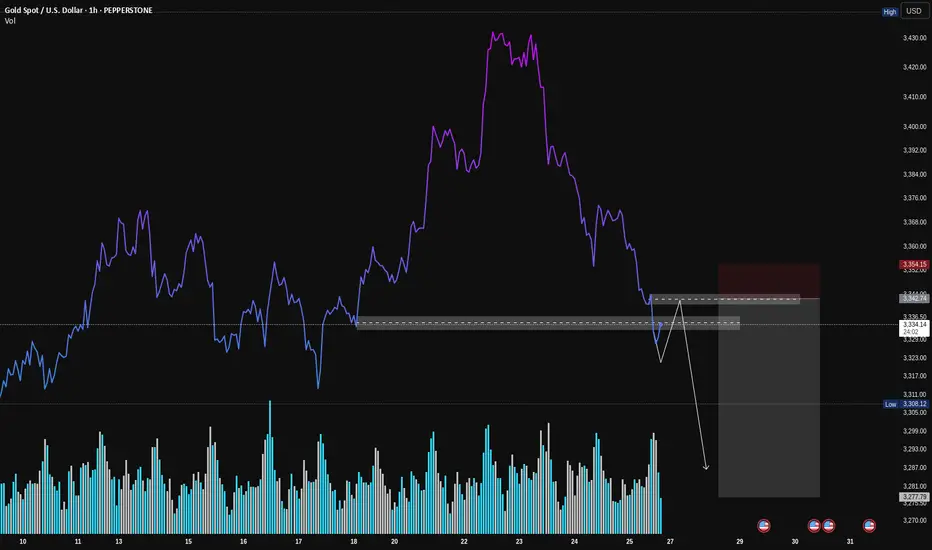
Gold (XAU/USD): A Classic VSA Short Setup in PlayHey Traders,
Following up on the general weakness we discussed in Gold, here's a closer look at a specific trade setup that's unfolding right now. This is a textbook example of a high-probability short setup according to Volume Spread Analysis (VSA).
Let's break down the story the volume is telling us.
1. The Breakdown: Sellers Show Their Hand
First, look at how the price broke down hard through that support level (the grey box). Notice the volume on that sharp drop? It was high. This is our clue that sellers are strong and in control. They had enough power to smash right through a level that was previously holding the price up.
2. The Retest: Buyers Don't Show Up
Now, the price is creeping back up to that same exact level. But here's the most important clue: look at the volume on this rally. It's much lower than the volume on the breakdown.
This is what VSA calls a "No Demand" rally. It’s like the market is trying to push a car uphill without any gas. It tells us that strong buyers (the "smart money") have no interest in buying at these prices.
3. The Setup: Selling into Weakness
This combination creates a classic short setup:
Logic: We are looking to sell at a level where old support has flipped into new resistance.
Confirmation: The low volume on the retest confirms the rally is weak and likely to fail.
How to Potentially Trade It
The grey box represents a high-probability entry zone. To time an entry, you could watch for a clear rejection signal right inside this zone. For example:
A "rejection candle" (like a pin bar) that pushes into the zone but gets slammed back down.
An up-bar with a tiny body and very low volume, showing buyers are completely exhausted.
Seeing one of these signs would be the final confirmation that sellers are about to take back control.
Conclusion:
This is a powerful setup because all the pieces line up: the background is weak, sellers have shown their strength, and buyers are now showing no interest at a key resistance level.
Disclaimer: This is my personal analysis using VSA and is for educational purposes only. It is not financial advice. Always do your own research and manage your risk. Good luck, traders!
Gold. Trade Swing buy setup 25/July/25XAUUSD "erased" all its early weekly gain by having deep pullback until its weekly pivot and channel support confluence zone again..

Gold dips on profit-taking, long-term outlook still bullishGold prices continued to decline this morning as investors locked in profits following the precious metal’s recent rally above $3,400.
In the short term, further downside is possible if profit-taking persists and capital flows shift toward equities, especially as U.S. stock markets hover near record highs. However, gold remains a favored safe-haven asset for the long run amid ongoing global economic and geopolitical uncertainties.
Markets are also turning their focus to the upcoming Federal Reserve policy meeting on July 29–30. While the Fed is expected to hold interest rates steady this time, many investors still anticipate a potential rate cut in September. A low interest rate environment typically supports non-yielding assets like gold.

Gold stabilizes. Sets a new high?Gold continues to rise, with uncertainty in trade negotiations and the outcome of the Federal Reserve meeting being key variables. If no agreement is reached before August 1, the high tariffs imposed by the United States on major trading partners may trigger greater risk aversion demand, pushing gold prices further up; if the negotiations make a breakthrough, the market risk appetite will rebound, and gold prices may face correction pressure.
Gold has shown a strong upward trend recently. It closed with a small positive on Friday last week and closed with positive for two consecutive trading days this week, forming a three-day positive trend, with strong short-term momentum. In terms of indicators, the moving average diverges upward, with obvious bullish trend characteristics, and the support below needs to focus on the moving average performance. At present, the gold price has broken through the trend line formed by connecting the previous high points. The primary focus on the upside is near the previous high of 3452, which is an important short-term resistance level. The upper focus is on the previous high of 3452, which is an important short-term resistance level.
The first support below is the 3390-3385 area, which is close to yesterday's low and is also an early trading intensive area. The second support focuses on the vicinity of 3360.
In terms of operation, it is still mainly low-long, and short selling is not considered before the upward trend reaches 3450.
Operation strategy:
Short around 3450, stop loss 3460, profit range 3430-3310
Long around 3400, stop loss 3390, profit range 3420-3430
XAUUSD: Buy ideaBuy idea on XAUUSD as you can see on the chart if and only if we have the breakout with force the vwap and the RL.

Will The Emerging Uncertainties Support Gold Ahead?Macro approach:
- XAUUSD advanced this week, supported by broad-based US dollar weakness and reviving safe-haven demand amid rising global trade tensions. The yellow metal briefly reached a five-week high as investors sought safety following headlines of escalating US tariffs and uncertainty over the Fed’s policy direction.
- Gold may remain well-supported if risk aversion persists, with upcoming global PMIs and further US trade developments set to guide market direction. Additional Fed commentary and central bank actions could trigger new volatility for XAUUSD throughout the week.
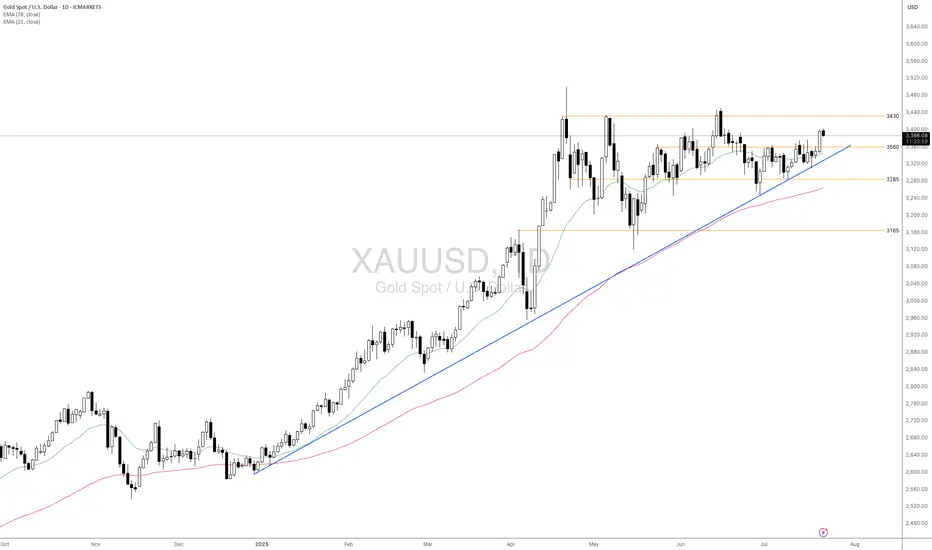
Technical approach:
- XAUUSD remains above both the EMA21 and EMA78, reflecting ongoing bullish momentum. The recent price action shows consolidation below the resistance at 3430 after rejecting the swing high. In contrast, higher lows have formed above the ascending trendline and the support at 3285.
- If XAUUSD stays above the support at 3560, it may extend towards the previous swing high at around 3430 and open for another record high.
- On the contrary, if the price drops below the support at 3560 and the ascending trendline, it may retreat toward the following support at 3165.
Analysis by: Dat Tong, Senior Financial Markets Strategist at Exness
GOLD-XAUUSD vs. The FED: Technicals or Fundamentals?Good Morning Traders,
Let’s break down what gold is showing us on the 1-day chart:
- **Resistance:** 3,378
- **Support:** 3,282
- There’s a noticeable **head and shoulders pattern** on the chart. Under normal conditions, gold’s target sits at **3,170**.
Gold is highly sensitive to fundamental factors. Sudden war news or events like last week’s rumors about Trump firing the Fed Chair can trigger serious volatility.
That’s why I always combine **technical and fundamental analysis** in my approach.
For gold to reach the 3,170 target, the **3,282 support level must first be broken**. Since that hasn't happened yet, we can't confirm a bearish move—fundamentals play a key role here.
Keep in mind: this is a **swing trade** setup based on a 1-day chart. Reaching the target could take time.
I want to sincerely thank everyone who’s been supporting my analyses with likes—your support is
my biggest source of motivation when it comes to sharing content.
Much love and respect to you all.💛

GOLD continues to correct down, good news from trade situationOANDA:XAUUSD has fallen sharply again, currently trading around $3,360/oz, reflecting the easing of global trade tensions, affecting demand for safe-haven assets. The US Dollar and US Treasury yields have also increased, affecting gold prices.
The US Dollar Index ( TVC:DXY ), which tracks the greenback against six other currencies, rose to 97.56.
The yield on the 10-year US Treasury note US10Y rose to 4.386%. The US real yield, calculated by subtracting inflation expectations from nominal interest rates, rose nearly 3.5 basis points to 2.046%.
Markets are increasingly optimistic about such deals after the United States and Japan reached a trade deal, and the European Union could be next. In addition, rising stock markets and low volatility have kept gold's gains in check.
The United States and the European Union are moving toward a potential trade deal that would include a 15% tariff on EU goods and zero tariffs on some items.
The European Commission said Thursday that a negotiated trade solution with the United States is within reach.
“Our focus is on reaching a negotiated outcome with the United States,” a European Commission spokesperson told reporters about the EU-U.S. tariff talks. “We believe that such an outcome is achievable.” The European Commission has repeatedly said that its current priority is to reach a deal with the United States to avoid the 30% tariffs that U.S. President Trump has proposed to impose on EU products starting August 1.
On the economic data front, initial jobless claims in the United States unexpectedly fell last week, suggesting the job market remains solid.
The U.S. Bureau of Labor Statistics reported on Thursday that initial jobless claims fell to 217,000 in the week ended July 19, below expectations of 227,000 and down from 221,000 the previous week.
Technical Outlook Analysis OANDA:XAUUSD
Gold is heading for its third consecutive day of decline since hitting the bullish target level sent to readers in the weekly edition on Sunday at $3,430.
Despite the sharp decline, gold still has enough technical conditions for an uptrend given its current position and structure.
Specifically, gold is still above the EMA21, which is considered the nearest support at the moment. Along with that, the uptrend price channel is the short-term trend. However, for gold to qualify for a short-term bullish cycle, it needs to be confirmed by price action above the 0.236% Fibonacci retracement level, then the target is $3,400 in the short term, more than $3,430.
On the other hand, RSI is still holding above 50, and 50 in this case acts as momentum support. Therefore, gold still has room to rise.
In case gold is sold below EMA21, it may suffer a further decline with the next target around $3,310 in the short term, more than $3,300 and the 0.382% Fibonacci retracement level. And if gold loses the support at the 0.382% Fibonacci level, it will qualify for a bearish cycle.
Intraday, the current position of gold price is still tilted towards the upside, and the notable price points will be listed as follows.
Support: $3,350 – $3,310 – $3,300
Resistance: $3,371 – $3,400 – $3,430
SELL XAUUSD PRICE 3406 - 3404⚡️
↠↠ Stop Loss 3410
→Take Profit 1 3398
↨
→Take Profit 2 3392
BUY XAUUSD PRICE 3329 - 3331⚡️
↠↠ Stop Loss 3326
→Take Profit 1 3337
↨
→Take Profit 2 3343
