XAU/USD Analysis – Expecting Fibonacci Retracement to 0.618 I’m currently anticipating a short-term retracement in XAU/USD towards the 0.618 Fibonacci level around 3323, followed by a continuation of the bearish move targeting a Fair Value Gap (FVG) around 3272.
📌 Technical Confluence:
The market has recently shown a strong bearish impulse, and the current price action appears to be forming a corrective retracement.
The 0.618 retracement level aligns with a key resistance area around 3323, increasing the probability of a bearish reaction from this zone.
There’s a visible FVG left unfilled near 3272, which may act as a price magnet.
I’m also watching for a liquidity sweep above local highs, followed by bearish confirmation on the lower timeframes (e.g., 5min) to trigger a short entry.
📉 Trade Idea:
Looking for a sell entry near 3323 after confirmation (liquidity grab, bearish structure shift, etc.)
Target: 3272 FVG zone
Stop Loss: Just above recent highs or liquidity zone, depending on intraday structure
XAUUSDK trade ideas


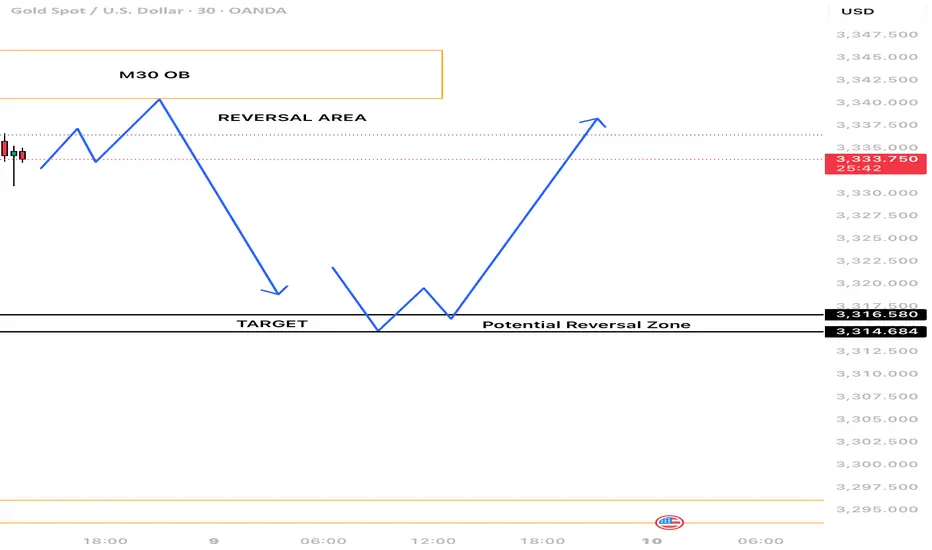
Gold setup | OB + Reversal Zone in PlayGold is approaching a key M30 Order Block (OB) 🟧, acting as a potential supply zone.
Price may push into the reversal area around 3336–3344 before showing signs of rejection 🔄.
📌 If price reacts from this OB, a sell-off toward 3316.5 is expected 🎯
Scenario 2:
At 3316-3314 there is also other OB which could act as a demand zone and price can show reversal from there
This aligns with the idea of smart money filling orders before the next move down 📊
🧠 Waiting for bearish confirmation inside the OB
🧠 Waiting for bullish confirmation inside the OB
⚠️ Stick to your risk management and trade the reaction, not the prediction ✅

GOLD GOLDi, i see trading as probability and it helps me stay guided .we are heading to a hiigher sell zone 3340-3337

GOLD BUY M15 Gold (XAU/USD) 15-Minute Chart Analysis – July 7, 2025
Trade Setup: The chart shows a bullish trade setup based on a potential reversal from a "Weak Low" support area around 3304. After forming a BOS (Break of Structure) and a small consolidation (highlighted box), price is expected to move higher.
Entry:
Long position initiated slightly above the consolidation zone.
Stop Loss (SL):
Set at 3304, just below the recent weak low support.
Target (TP):
Final target at 3326, where a key resistance level lies.
Key Levels:
Support Zone: 3304 (Weak Low)
Resistance Levels:
3317.5
3222.9
3326.2 (Final Target)
Market Structure Notes:
CHoCH (Change of Character) indicates potential shift to bullish momentum.
Price is expected to form higher highs and higher lows on its way to the target.

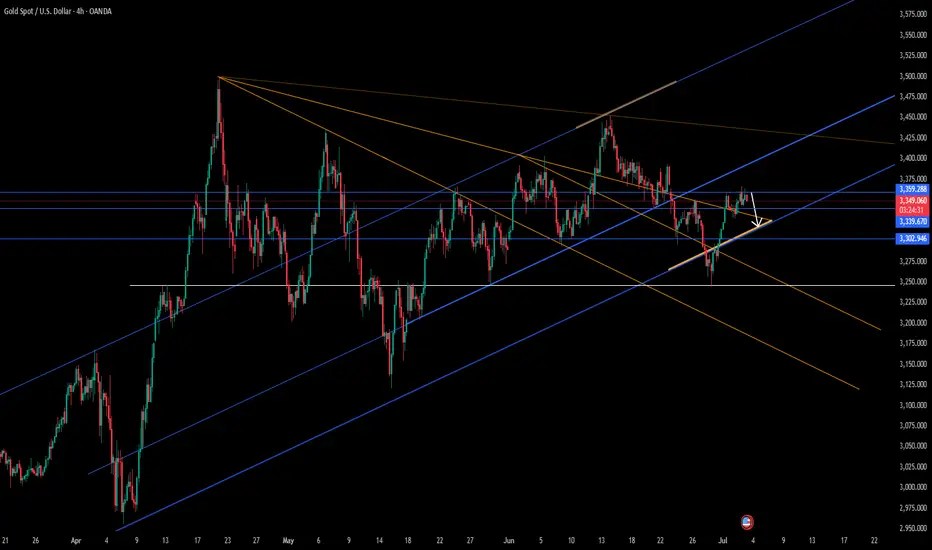
XAUUSD 4Hour TF - July 6th, 2025XAUUSD 7/6/2025
XAUUSD 4 hour Long Idea
Monthly - Bullish
Weekly - Bullish
Daily - Bullish
4hour - Bullish
Back to bullish here on Gold but that comes as no surprise when you look at the higher timeframe trends.
I’m mainly considering long scenarios for the week ahead but let's take a look at two for the week ahead:
4hour bearish continuation - Currently we can see price action broke above 3,320.00 resistance and is currently looking to find some footing. We’re keeping an eye out for higher lows at or near this level to then consider long scenarios. 3,395.000 seems like a good target but gold has potential to go higher.
4hour trend reversal - If we are to consider short positions on gold we would need to see a break back below our 3,320.000 zone. Look for confirmed lower highs below 3,320.000 and target lower key support levels if this happens.

Continue to maintain the rhythm of short tradingUnder the influence of NFP, gold fell sharply as expected. What I had suggested before was proven correct by the market again. "Gold rose in advance to reserve room for the NFP market to fall." After NFP, gold fell to around 3311 and the decline narrowed. Therefore, we accurately seized the opportunity to go long on gold near 3312 and set TP: 3330. Obviously, gold successfully hit TP during the rebound and made an easy profit of 180 pips.
From the current gold structure, gold encountered resistance and retreated twice near 3365, and built a double top structure in the short-term structure. In order to eliminate the suppression of the double top structure, gold still needs to continue to fall after the rebound. After the cliff-like decline of gold, the short-term resistance is in the 3340-3345 area, and the short-term support below is in the 3320-3310 area.
So I think that gold can still continue to short gold after the rebound, and I have already shorted gold around 3336 with the 3340-3345 area as resistance. Now we just need to wait patiently for gold to hit TP. Let us wait and see!

GOLD OUTLOOK FOR 3RD JUNE, 2025Gold is currently following a bullish structure on higher timeframes, such as weekly and Daily. I expect to go long from the 3340 level with a Stop Loss at 3336. First TP should be around 3380, and the final TP should be at 3433.

Expecting Gold Selling movement In this 15 minute chart of Gold Spot XAU/USD price action indicates a potential bearish setup following a strong upward move that has started to lose momentum
After reaching a peak near 3344 price formed a double top pattern followed by a series of lower highs and lower lows signaling a shift in market sentiment
The blue horizontal zone around 3331 3332 acted as a significant support level which has now been broken and is being retested as resistance
The yellow projection shows a bearish continuation scenario with price expected to reject the retest of the broken support and continue downward
The projected target for the bearish move is near 3302 indicating a significant downside potential
The risk zone highlighted in red lies above the resistance, likely placing the stop loss around the 3335 3340 range
This analysis suggests that if the price fails to reclaim the support turned-resistance zone bears could take control and drive price lower throughout the day

Gold price this afternoon (July 8)Given the definition of the gold price trend, market participants remain anxious and oriented to signs of the US Federal Reserve’s stance on monetary tightening, which could shape the future course of gold prices.
As the US dollar gains traction, it is also a difficult time for gold. But if the tariff war accelerates, gold will rise, especially as fears of annihilation and trade wars increase.
🔴 XAUUSD BUY 3295 3293 🔴
✅TP1: 3310
✅TP2: 3320
✅TP3: OPEN
🚫 SL:3289
🔴 XAUUSD SELL 3308 3306 🔴
✅TP1: 3300
✅TP2: 3290
✅TP3: OPEN
🚫 SL:3313


Sell XAUUSDHere’s the English translation of your text:
“Considering that the price has once again reached the channel’s upper boundary and failed to break through it, receiving a strong rejection from that area, I am entering a short position.

Bullish Breakout Anticipation on Gold (XAU/USD)Bullish Breakout Anticipation on Gold (XAU/USD)
On the 30-minute chart, Gold is forming a classic falling wedge pattern, typically seen as a bullish reversal setup. We've just touched the lower support trendline, and early breakout signs are emerging.
📍 Entry: 3,309.500
🎯 Target: 3,335.500
🛑 Stop Loss: 3,299.000
The risk-to-reward ratio looks favorable, and a breakout above the wedge resistance could push price towards the 3,335+ region. Let’s watch for confirmation and volume on breakout.
👇 Drop your thoughts below and let’s discuss!
✅ If you find this analysis helpful, please support by giving a like and following — your support means a lot! 🙌 🟡

Everybody loves Gold Part 7Great trading last week. Gold really pushing deep into blues.
This week takes a downturn with possibilities highlighted on the chart; all pointing towards LOS (Level of significance). This level is calculated based on previous week high-low values.
Trade parameters:
1. SL: 50-100pips
2. TP: 3-4x SL
3. double tops/bottom (around LOS) are direction changers.
As always price action determines trades

gold Indicator Actual Forecast Previous
Average Hourly Earnings m/m
0.3% 0.4% —
Non-Farm Employment Change
147K 111K 139K
Unemployment Rate
4.1% 4.3% 4.2%
Unemployment Claims
233K 240K 236K
Interpretation and Implications
Average Hourly Earnings m/m:
Rose by 0.3%, slightly below the forecast of 0.4%. This suggests wage growth is steady but not accelerating, which may ease some inflation concerns.
Non-Farm Employment Change:
The US economy added 147,000 jobs, beating both the forecast (111K) and the previous month (139K). This indicates continued, though moderate, labor market expansion.
Unemployment Rate:
Fell to 4.1%, better than the expected 4.3% and down from 4.2% previously. This points to a modest improvement in labor market conditions.
Unemployment Claims:
Dropped to 233,000, lower than both the forecast (240K) and last month (236K). This signals fewer new layoffs and continued resilience in the job market.
Market Impact
Dollar (USD):
The combination of stronger-than-expected job growth and a lower unemployment rate is generally supportive for the US dollar, as it suggests the labor market remains robust. However, slightly softer wage growth may temper expectations for aggressive Fed tightening going forward.
Federal Reserve Outlook:
These figures reinforce the Fed’s “data-dependent” stance. Solid job creation and falling unemployment reduce urgency for immediate rate cuts, but the lack of wage acceleration may allow the Fed to maintain a cautious approach.
In summary:
The US labor market in July 2025 shows moderate strength, with job gains and a falling unemployment rate, while wage growth remains steady but not excessive. This mix supports a stable outlook for the dollar and gives the Fed flexibility in its upcoming policy decisions.


Today's bearish target for gold prices: 3300Today's bearish target for gold prices: 3300
Technical analysis:
Short-term support: $3330-3320 (5-day and 10-day moving averages),
Short-term resistance: $3360-3374 (61.8% retracement).
If it falls below $3330, it may fall to the $3306-3320 range;
If it breaks through $3374, it may challenge the previous high of $3450.
The daily chart shows that gold prices are fluctuating at high levels, and the MACD red column has expanded, but the RSI (60-65) shows a good bullish momentum.
2. Main influencing factors
Federal Reserve policy and non-agricultural data:
The market focuses on the US non-agricultural employment data for June released tonight (July 3) (expected to increase by 106,000, and the previous value was an increase of 139,000).
If the data is weak (for example, the unemployment rate rises to 4.3%), it may strengthen the expectation of a rate cut in September, which is good for gold;
On the contrary, if the data is strong, the price of gold may fall back.
The unexpected contraction of the ADP employment data in June (a decrease of 33,000 jobs) has pushed up the expectation of a rate cut in advance.
Geopolitics and safe-haven demand:
If the situation in the Middle East (such as the Iranian nuclear issue) escalates, it may push up the price of gold, but the recent ceasefire agreement between Israel and Iran has weakened the short-term safe-haven support.
The continued purchase of gold by central banks around the world (net purchase of 289 tons in the second quarter of 2025) constitutes long-term support.
The US dollar and interest rates:
The US dollar index has weakened recently, but if the Fed postpones the rate cut (the probability of a rate cut in September is currently 75%), it may suppress the price of gold.
3. My views and market forecasts:
In the short term, the price of gold will fluctuate, and the trend depends on the non-agricultural data.
If the data is weak, the price of gold may rise to $3370-3400;
If the data is strong, the price of gold may fall back below $3300.
I think the possibility of a fall is high.
In the short term, I prefer the strategy and trading ideas of shorting at high prices below 3360-3370.
Suggestions:
Short-term trading: Pay attention to the breakthrough opportunities after the release of non-agricultural data. You can go long at the support level (3330-3320 US dollars) and try to go short at the resistance level (3360-3374 US dollars).
Flexibly adjust the strategy.
Elliott Wave Analysis – XAUUSD, March 7, 2025🌀 Elliott Wave Structure
On the H1 chart, wave 3 appears to have completed, and price is now entering a phase with an unusual structural behavior.
Wave 3 previously showed strong momentum, moving steeply and continuously, with no clear internal pullbacks – a classic impulse wave. Following this, we observed a corrective abc pattern in black, suggesting the end of wave 3.
Interestingly, although yesterday's ADP report was extremely bullish, gold only managed a mild breakout above the wave 3 high before pulling back this morning. Notably, the upward move followed a 3-wave abc structure in green, and price action is now showing overlapping waves with no clear directional momentum.
🧩 These signs suggest a high probability that:
🔹 Wave 5 is forming as an Ending Diagonal – a 5-wave structure with a 3-3-3-3-3 pattern.
🔹 This is typically seen at the end of a bullish cycle and often precedes a sharp reversal.
Although it's too early to confirm, we should patiently observe the upcoming price action. If the ending diagonal completes, it may present a strong sell opportunity.
🎯 Target for wave 5: around 3395, provided all 5 sub-waves within the diagonal complete.
⚠️ If price breaks below 3324, we must consider that the full 5-wave structure is already done, and a new abc corrective phase may have begun.
🔍 Momentum Analysis
Daily (D1): Momentum is about to turn bearish from overbought territory → suggests a weakening uptrend.
H4: Momentum is turning upward → likely a mild rally or sideways movement today before H4 reaches overbought again.
📌 Trading Plan
Given the current wave behavior and overlapping structure, it is best to remain patient and wait for confirmation before taking a strong position. If the Ending Diagonal structure is confirmed, it could signal a major reversal.
SELL Zone: 3392 – 3395
Stop Loss: 3403
Take Profits:
• TP1: 3368
• TP2: 3340
• TP3: 3324

Gold is unilaterally upward during the dayGold, the general trend is as described in the morning analysis. The price fell from the 3452 high point in this round. On Monday, it rebounded quickly after parallel attack and defense near 3245. The article emphasizes that the short-term strength will continue. The high point of the week may appear around Thursday's non-agricultural data. The medium-term top idea of 3500-3452 is still maintained;
It actually opened unilaterally upward from 3303 during the day and is now reported at 3340; the bullish pattern of each cycle is good, and there will be a high in the evening; short-term support is 3338, strong support is 3332; short-term resistance is 3350-3356, strong resistance is 3365-3374;

Gold is Ready For The Next Bullish Run- Taking a Long Trade HereAfter a series of bearish structures on 4Hour time frame, which is actually a bullish retracement on higher time frame, Gold has now broke the bearish structure with series of bullish candles which turned the trend from bearish to bullish trend.
After the bullish break of structure, Gold retrace into a fair value price level, formed a swing low plus a bullish price action which further confirmed the bullishness of Gold, which is were I took an entry for a buy long trade.
My target for this trade is for Gold to reach the price level of $3,436 which is a 5.36RR return.
I will be monitoring price and manage my trade accordingly as price move in my direction.

current Gold position live gold Break down all targets set looking to day trade and hold over the span of a day

Gold bulls and bears compete for non-agricultural dataTechnical aspects:
Currently, gold is in a typical ascending triangle structure, reflecting that the market bullish trend has not been broken but faces strong resistance. On the daily chart, gold as a whole maintains a range of $3250 to $3400, with obvious horizontal support and resistance bands formed at both ends of the range.
The Bollinger Bands are converging as a whole, indicating that volatility is shrinking, indicating that the large-scale direction selection is approaching. The green column of the MACD indicator has narrowed slightly, and the short-term momentum is still bearish but there are signs of weakening. The RSI indicator runs around 49, maintaining a neutral and bearish state, and there is no obvious deviation in the short term, suggesting that there is still the possibility of subsequent shocks and consolidation.
