Gold is currently trading around $3,420.82, approaching a resist🟩 Key Support Zones:
$3,397 – $3,398 – Minor support (likely retest area)
$3,366 – Structure support level
$3,320 – $3,330 – Previous demand zone
$3,282 – Major support (lower key level)
🟥 Key Resistance Zones:
$3,443 – $3,469 – Major resistance and target zone
Expect possible price rejection or consolidation here.
XAUUSDK trade ideas

XAUUSD CAN FLY HIGHXauusd buy from 3375
Tp1 3385
Tp2 3395
Tp3 3405
Stope lose 3368
Trade at your own risk

Gold is about to approach the top suppression position, so be ca
Today, Monday, gold continued its upward trend from last Friday, and the highest so far is around 3370.
Last Thursday, it once reached a low of 3309, and then rebounded sharply, entering the upper suppression area again.
First of all, from the current perspective of the US dollar:
The US dollar is currently in a retracement, and the rise of gold is understandable.
The US dollar has not yet stepped back to the right level, at least it has to step back to around 98.0.
And it has to stabilize at the support near 98.0, so the US dollar may stretch again in the future.
Once it stretches from 98.0 again, the highest can reach above 99.0.
If the US dollar can stabilize above 98.0, then gold should also reach its peak by then.
To be honest, gold is still a little short of the mark at the moment.
3370 is not the top position. It would be best if it could reach a new high, break through around 3380, and then come down again, then the top can be determined.
From the current 4-hour gold chart, we can also see that the top suppression position has not been touched.
Therefore, we still cannot act rashly and cannot chase too much.
It is best to wait for the US market to reach around 3380 to form a top structure.
Combined with the situation of the US dollar, short gold, if gold falls again, at least go back to test 3330-40.
If the US dollar is stronger and can stand above 99.0, it is also possible for gold to directly fall below the 4-hour chart trend line support.
GOLD - One n Single Support, holding or not??#GOLD.. market just reached at his current ultimate supporting area and that is 3385
Keep close it and if market hold it in that case we can see again bounce otherwise not..
Note: we will go for cut n reverse below 3385 on confirmation.
Good luck
Trade wisely
Bullish on gold, but avoid chasing highs , beware of pullbacks!Analysis of gold trend: From the daily chart, gold is in an upward trend. From the technical indicators, MA5-MA10 moving averages are golden crosses, BOLL opens upward, K line runs on the upper track of the daily Bollinger band, and the MACD candle chart momentum column continues to increase, indicating that the bullish trend remains unchanged. KDJ runs near the 80 draw line and is overbought, which means that the short-term market upward momentum may be over-released, and there is a need for callback or shock consolidation. Although the general trend is bullish, it is difficult to form a continuous surge. This wave to 3440-3450 is very good, and it is likely to form a mid-term adjustment under the pressure of 3450. Be cautious about the current rise. If there is an effective adjustment, it may turn from strong to weak.
From the 4-hour chart, the performance in the chart has the possibility of reaching the top now. Gold surged to around 3438 after opening, and then fell back. The current strength is still relatively large. Therefore, today we should pay attention to whether there is a possibility of reaching the mid-term top. The support below is around 3410-3400. If it breaks below 3400, it may continue to adjust to -3385-3375 today. From the 1-hour chart, the technical indicators in the chart cross downward, indicating that there is a need for a short-term decline. The general trend is bullish. The short-term will first look at the retracement. Today, the support below is around 3410-3400. The intraday retracement relies on this position to continue to be bullish.
Gold operation strategy: short gold around 3435-3438, target 3420-3310. It is recommended to go long around 3410-3400, target 3420-3430.

XAUUSD major resistance breakout below 3375 level Readmore...📊XAUUSD Gold Analysis – 4H Timeframe
Gold is respecting the bullish ascending channel on the 4H, with strong momentum continuing after a breakout above 3375 – a major resistance now turned into key support.
Retracement Entry Activated:
✅Entry taken at the 3375 breakout level – now acting as strong demand
🛑Stop Loss:
Placed below at 3323, aligned with the bullish order block (OB) for added protection
🎯Next Resistance Targets / Supply Zones:
🔹 3392
🔹 3404
🔹 3440 [ /b]
📌Watching price reaction at each level for signs of exhaustion or continuation
🧠Always manage risk and follow your plan – no guarantees in the market!
Share your thoughts below!
#gold #xauusd
👋Regards from _expert Team_

XAUUSD TRADE SETUPWait for retest the entry level and bullish momentum then take a trade for Buy otherwise skip this setup

#3,377.80 Resistance remains strongMy position: I have Bought Gold many times above #3,400.80 benchmark however as it got invalidated, I Bought #3,390.80 again late U.S. session and closed my set of Buying orders on #3,395.80 nearby extension. I left one runner (#3,390.80 entry point) with Stop on breakeven expecting Asian session to recover #3,400.80 benchmark, however it was closed on break-even as Gold extended Selling sequence. I will continue Selling every High's on Gold and if #3,357.80 gives away, expect #3,352.80 and #3,342.80 contact points to be met.
As expected Gold delivered excellent #3,372.80 and especially #3,365.80 - #3,352.80 Selling opportunities throughout yesterday's session which I utilized to it's maximum. I have also Bought Gold on late U.S. session with #3,372.80 as an entry point / however since Gold was ranging, I closed my order on break-even and met Gold below #3,352.80 benchmark this morning personally on my surprise (I did expected #3,377.80 to be invalidated to the upside).
Technical analysis: Gold’s Price-action is performing well below both the Hourly 4 chart’s and Daily chart’s Resistance zones for the cycle. Selling direction of today’s session is directly correlated with Fundamentals leaving the scene which found Sellers near the Intra-day #3,377.80 Resistance and most likely DX will close the Trading week in green, however struggling to make Bullish comeback and if #3,327.80 - #3,342.80 reverses the Selling motion, Gold’s Daily chart’s healthy Technicals which preserved core uptrend values. If the Price-action gets rejected at #3,352.80 - #3,357.80 Resistance zone, then further decline (under conditions where I will have more information with U.S.’s session candle) is possible and cannot be ruled out. Notice that at the same time and manner, Bond Yields are on consecutive Selling spree as well which Fundamentally has a diagonal correlation with Gold. The slightest uptrend continuation there, should add enormous Selling pressure on Gold.
My position: I am Highly satisfied with recent results and will take early weekend break (no need to Trade more). If however you decide to Trade today, Sell every High's on Gold / no Buying until Monday's session (my practical suggestion).

350pips Secured — Focus Shifts to Dip-Buying StrategyToday's trading was very successful, and the grasp of the long and short rhythm was very accurate. Today's trading situation is as follows:
1. Close the short position with an overnight entry price of around 3386 near 3380, with a loss of 60 pips, and the loss amount exceeded $6K;
2. Directly short gold near 3380, manually close the position near 3366, profit 130pips, profit amount exceeded $12K;
3. Long gold near 3356, hit TP: 3372 and end the transaction, profit 160pips, profit amount exceeded $8K;
4. Long gold near 3362, hit TP; 3375 and end the transaction, profit 120pips, profit amount exceeded $6K.
Intraday trading summary: Today, the long and short sides completed a total of 4 transactions, one of which suffered a loss, but the net profit was 350pips, and the profit amount exceeded $20K. For short-term trading, I think I can submit a satisfactory answer to myself today!
How to execute the transaction next? Gold started to pull back from around 3438 and has now reached a low of around 3351, with a retracement of more than 870pips. The retracement space is not small. However, gold has stabilized above 3350 and has started a technical rebound repair, and the upward force is not weak, so gold may have completed the retracement. Under the support of these two technical conditions, gold may regain its upward momentum and hit 3400 again.
At present, the short-term resistance is obvious, located in the area near 3380. Once gold breaks through 3380, gold will inevitably continue to rise and hit 3400 again; but I think as long as gold stabilizes above 3350, it is not difficult to break through the short-term resistance of 3380, so gold will inevitably test the 3400 mark again; and the short-term support below is in the 3365-3355 area. Gold may still retreat to this area first during the rise in order to increase liquidity and accumulate momentum, helping gold to break through 3380 more easily.
So for the next short-term trading, I think it is feasible to go long on gold in the 3365-3355 area, first looking at the target area of 3380-3390, and then 3400.


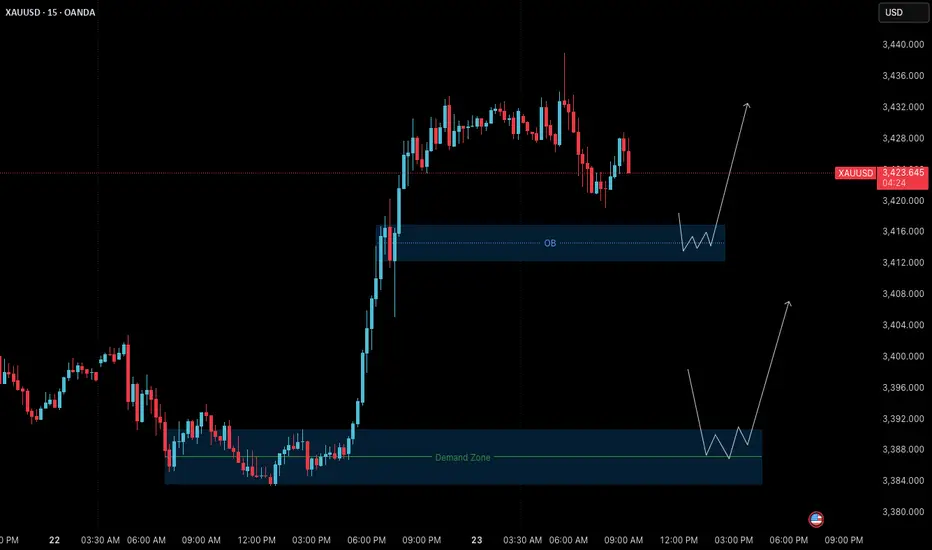
Gold Outlook (23 July): Bullish Structure Retesting Key ZonesGold (XAUUSD) – 23 July Analysis
Structure, patience, and precision define today's opportunity
The market remains in a clear uptrend , and the current M15 structure is undergoing a healthy pullback phase following yesterday’s strong bullish breakout. This retracement brings the price into key zones where continuation setups may form — if confirmed.
📊 Market Structure Overview
• Bullish Breakout: On July 22, price made a strong impulsive move upward from the demand base at 3384–3390 , confirming bullish strength and shifting short-term structure to the upside.
• Current Pullback: After printing a local high around 3439 , the market is retracing toward lower support zones. The pullback is expected and may offer long entries if price respects key areas and confirms.
🔑 Key Reversal Zones to Watch
1. Order Block (OB) Zone
Range: 3417 – 3412
– This zone is the origin of the last bullish impulse.
– Price is nearing this key zone.
– If M1 confirms with internal structure shift + BoS , we may have a valid long setup.
– Target: Previous high at 3438–3440
2. Deeper Demand Zone
Range: 3390 – 3384
– This is the base of the prior impulsive leg.
– If price breaks below the OB with momentum, this deeper zone may act as stronger support.
– Potential swing entry zone with better R:R
📌 Trade Scenarios for Today
🔹 Scenario 1: Rejection from OB Zone (Likely Intraday Setup)
– Wait for M1 to confirm via micro ChoCh + BoS inside 3417–3412 zone.
– If confirmed, plan for long entry with SL below zone.
– Target: 3438–3440
🔹 Scenario 2: Break Below OB → Retest at Deeper Demand Zone
– If OB zone fails, wait for price to drop into 3390–3384.
– Look for M1 confirmation before executing any long position.
– This setup may offer a higher-quality entry with improved R:R.
📈 Trade Plan:
– Wait for confirmation before entry (e.g., M1 structure shift + BoS)
– SL: 40 pips | TP: 120 pips
– Risk-Reward: Always 1:3 minimum
– No confirmation = No trade
🎯 Summary
• Primary Bias: Bullish — monitoring OB zone (3417–3412) for long setup
• Alternative Setup: Buy from 3390–3384 demand if deeper retracement unfolds
• Discipline: Let the market validate your plan. Never force a trade.
📘 Shared by @ChartIsMirror
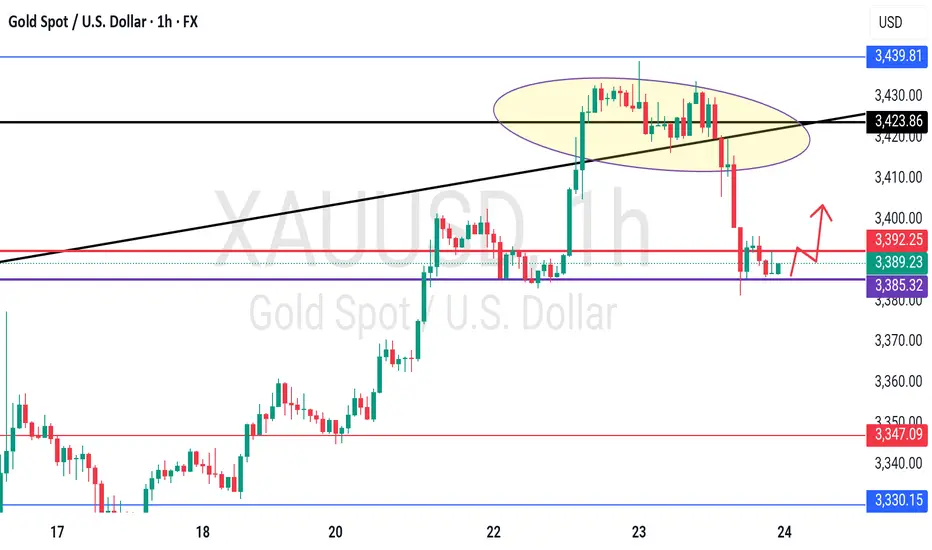
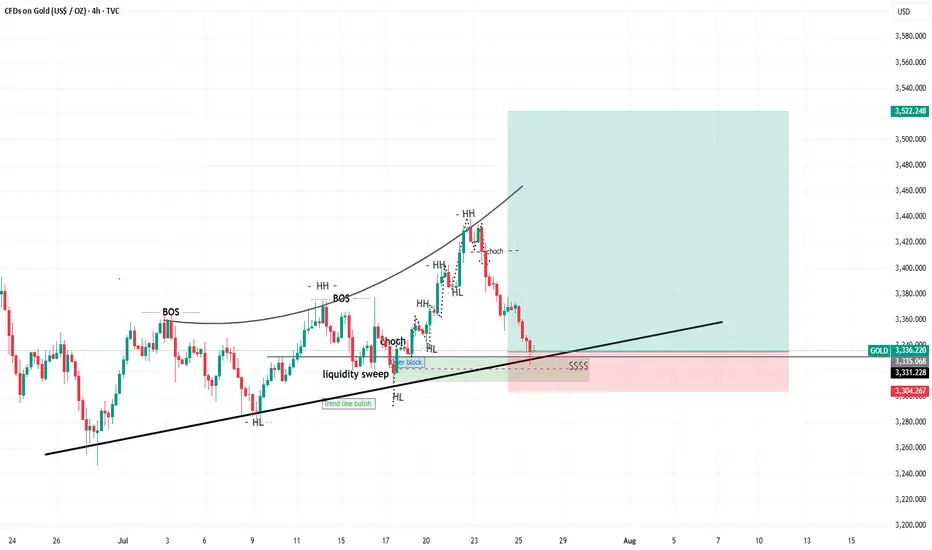
xauusd i think buy from here its not a bad ideatrend lines oder block fvg liquidity sweep choch higher high higher low.
Short Idea possibleFollowing up from the recent run up to @ 3400, from a trend line POV there are still 2 targets that will be favourable for shorts.
These levels are 3400, 3420 to 3440.
The 3420 to 3440 range also confluences with weekly sell cluster, which means seller conviction in the past. As time went by, this level was protected by sellers, high probability they do this same this time
Looking for a slow rotation and Choch on 5 to 15 mins within the ranges of 3420 - 3440 for a strong pullback to @ 3370.

Chart Analysis Gold (XAU/USD)Chart Analysis Gold (XAU/USD)
**Bearish Outlook (Short-Term)**
* **Price is below EMA 7 and EMA 21**, showing short-term bearish momentum.
* Strong **resistance zone** around **\$3,430–\$3,440** was rejected sharply.
* Price has broken below **\$3,405–\$3,395** support and is now **consolidating above \$3,385–\$3,380**, a critical support area.
* Volume is rising on red candles, supporting **selling pressure**.
**Key Support Zone:**
\$3,380 – If broken, next downside targets:
→ **\$3,370**
→ **\$3,360**
*Bullish Scenario (If Support Holds)**
* If **\$3,380** holds and price reclaims above **\$3,395**, a **bounce toward \$3,405–\$3,410** is possible.
* Look for a **break above EMA21 (currently near \$3,402)** for bullish confirmation.

"Gold at a Crossroads: 4H Close Below $3358 Could Trigger Major Technical Analysis
Key Levels:
Resistance Zones:
$3,451.42 – Major resistance.
~$3,410 – Mid-range resistance zone.
Support Zones:
$3,358 – Key support zone (critical level).
$3,330.50 – Secondary support.
$3,283.22 and $3,253.35 – Deeper support levels.
Current Price Action:
Price is currently trading at $3,366.47, pulling back after hitting a local top.
The yellow zone marks a decision area: Price may either bounce up or break down.
Two Scenarios Outlined:
🔼 Bullish Scenario: If price holds above $3,358 and breaks above the yellow zone, it may aim for $3,410 or even $3,451.
🔽 Bearish Scenario: A 4H candle close below $3,358 could signal continuation down toward $3,330, $3,283, and possibly $3,253.

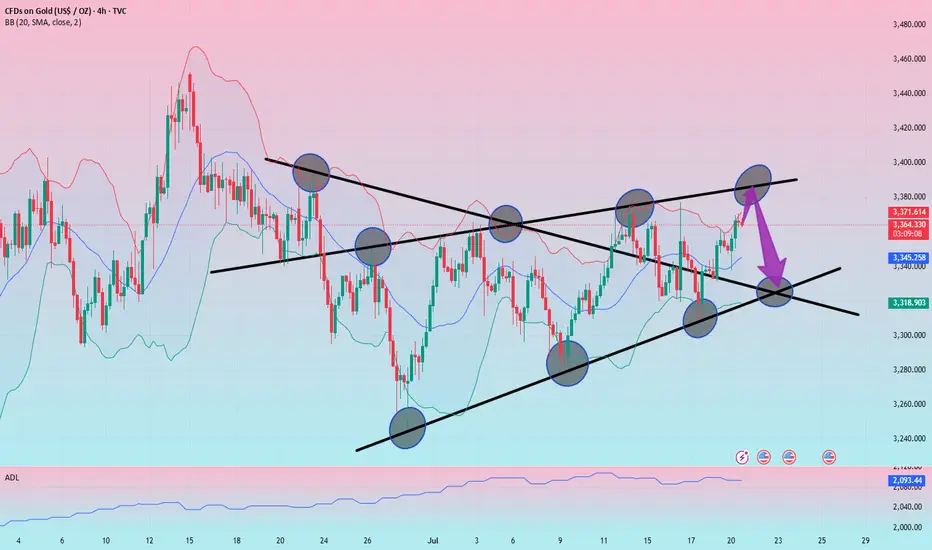
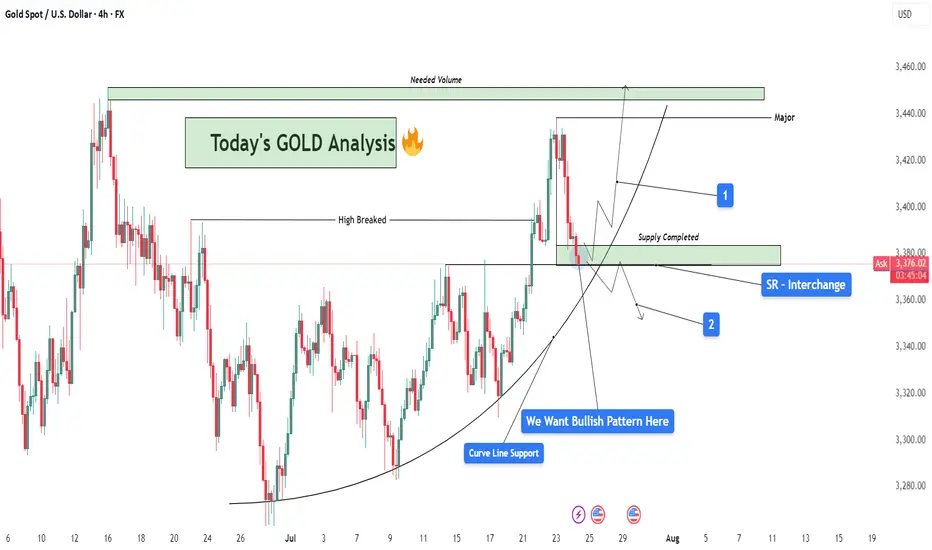
GOLD Analysis : SR Interchange , Reversal Zone + High Break🧠 Market Context & Structural Overview:
Gold has been trading within a clearly defined bullish structure after forming a rounded base pattern in early July, indicating accumulation by smart money. The market recently broke through a key horizontal resistance (previous swing high), marking a potential bullish continuation phase. However, we are now witnessing a pullback — a healthy corrective phase — that is currently testing multiple high-probability confluences.
🧱 Key Technical Zones Explained:
🔹 1. SR Interchange Zone – High Probability Reversal Area:
This area (roughly between $3,360 and $3,380) acted as previous resistance (supply) and has now flipped into support.
This is a textbook Support-Resistance Interchange (SR Flip) — a concept where prior resistance becomes new support.
Traders often look for entries here, especially when it aligns with other technical factors.
🔹 2. Curve Line Support – Dynamic Buyer Strength Indicator:
A curved trendline, often referred to as a parabolic support, has been respecting price structure for over two weeks.
Price is now sitting exactly on this support, signaling potential for another impulsive bullish leg if momentum builds.
🔹 3. Supply Zone Completed – Correction Phase Active:
The supply zone above (approx. $3,420–$3,440) has already been tapped and respected by the market.
This “completed” supply may now act as resistance unless broken with strong volume — we now watch how price reacts at the current pullback zone.
📊 What the Candles Are Telling Us:
The latest candles show some hesitation from sellers — wick rejections and smaller body candles hint at buyer interest at this level. However, confirmation is crucial. We want to see a bullish reversal pattern such as:
Bullish engulfing
Morning star
Pin bar (hammer)
Break and retest of minor resistance inside the SR zone
🔮 Scenarios to Watch:
✅ Scenario 1 – Bullish Continuation (Ideal Setup):
If a bullish reversal forms at this support zone:
Expect a potential rally back to the $3,420–$3,440 resistance area.
If this zone breaks with high volume, price could target the major supply zone near $3,465+, where we’ll need “Needed Volume” for a decisive break.
⚠️ Scenario 2 – Bearish Breakdown (Alternative View):
If the curve support and SR zone fail to hold:
Expect a drop towards $3,345 – $3,320 — where next structural support lies.
This would suggest a deeper retracement or range formation before bulls can regroup.
🧩 Strategy & Psychology:
“We want bullish pattern here.”
You’ve highlighted the importance of not entering impulsively. This is about trading with confirmation, not prediction. Waiting for a valid bullish pattern reduces risk and increases probability.
This is where smart traders win — waiting patiently for confirmation at a zone of confluence.
🧠 Learning Mindset – Why This Zone Matters:
Combines horizontal support, curved trendline, and broken structure retest.
This zone is the battleground between bulls and bears — whoever wins here will likely control short-term momentum.
Newer traders can study this as a classic example of multi-confluence trading, which combines price action, market structure, and dynamic trendlines.
July 22, 2025 - XAUUSD GOLD Analysis and Potential OpportunitySummary:
Bullish momentum is clearly in play — strategy remains to buy on pullbacks as long as key support levels hold.
🔍 Key Levels to Watch:
• 3435 – Resistance
• 3422 – Resistance
• 3410 – Resistance
• 3400 – Psychological level
• 3375 – Support
• 3364 – Support
• 3358 – Support
• 3345 – Strong support
📈 Intraday Strategy:
• SELL if price breaks below 3391 → target 3386, then 3380, 3375, 3370
• BUY if price holds above 3400 → target 3405, then 3410, 3422, 3435
👉 If you find this helpful or traded using this plan, a like would mean a lot and keep me motivated. Thanks for the support!
Disclaimer: This is my personal view, not financial advice. Always use proper risk control.
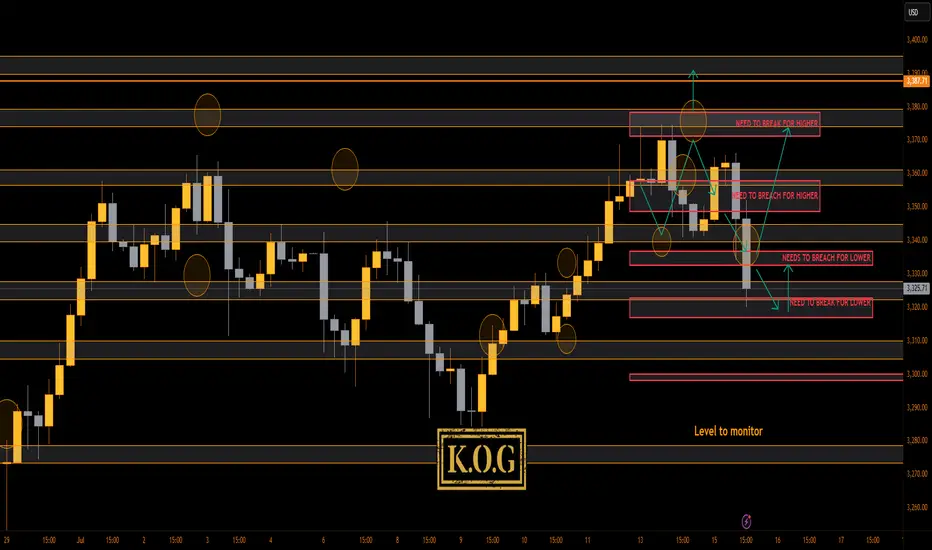
THE KOG REPORT - UpdateEnd of day update from us here at KOG:
Madness on the markets. I can honestly say, if you're less experienced in these markets, and like some of you trading with large lots and large or no SL's, you're unfortunately going to get yourself into a little bit of a pickle.
Did it go to plan today? Yes, and no! We followed the path which worked, but then we wanted support to hold at the bias level 3340 to then push us back upside. We got a small bounce for 100pips on the red box indicators but ideally we wanted this to completed the move up before coming back down. We're now at crucial support 3320 with resistance at the 3335-40 region, which, if we hold here without breaching should be a decent retracement on this move.
Other than that, I can say our plan for today wasn't as we hoped, we took an SL but then got a 100pip bounce. It is what it is
RED BOXES:
Break above 3365 for 3372, 3375, 3388 and 3406 in extension of the move
Break below 3350 for 3335✅, 3330✅, 3326✅ and 3307 in extension of the move
As always, trade safe.
KOG
"XAU/USD Hits Major Demand – Is a Relief Rally Brewing?"🟡 XAU/USD (Gold) – Demand Zone Rejection in Play | Bullish Correction Ahead?
Timeframe: 30-Minute | Date: July 25, 2025
Created by: AllyPipsExpert
Indicators: Ichimoku Cloud, BOS (Break of Structure), Dynamic S/R, Trendlines
---
🔍 Technical Analysis & Key Insights:
🔸 1. Market Recap – Distribution & Downtrend Confirmation:
After the Break of Structure (BOS) near 3385, gold confirmed a bearish reversal following the distribution phase at the top resistance zone around 3445–3460.
Bearish momentum was sustained by a descending trendline, paired with a bearish Kumo (Ichimoku cloud) crossover.
🔸 2. Major Zone Tagged – Key Demand Area Tested:
Price has now reached the critical demand block at 3320–3340, a zone that previously initiated bullish impulse on July 18–19.
The current bullish projection (in blue) reflects potential short-term recovery or correction phase, following oversold conditions and historical support strength.
🔸 3. Bullish Reversal Potential – Short-Term Retracement?
The blue arrow reflects a likely bullish retracement toward 3360–3380, aligning with trendline retest and potential Kumo rejection.
Expect sellers to re-enter if price retests former BOS/imbalance zone, creating scalp or swing sell setups on confirmation.
---
🔧 Confluences & Technical Highlights:
Confluence Point Description
Demand Zone Strong previous accumulation at 3320–3340
BOS Retest Area Key liquidity level now acting as resistance
Ichimoku Cloud Price below cloud = bearish bias maintained
Descending Trendline Reinforces bearish structure unless broken
Price Action Rejection wick at demand + potential short squeeze
---
🎯 Trade Outlook:
🧭 Bias: Short-Term Bullish Rebound → Long-Term Bearish Continuation
🟩 Support: 3320 – 3340
🟥 Resistance: 3360 – 3385 (BOS & Trendline zone)
🔁 Scenario: Bounce → Retest → Continuation lower (unless breakout confirmed)
---
📘 Why This Chart Could Be Featured:
✅ Multi-layered Analysis: BOS, zones, cloud, price action, and psychological zones used together.
✅ Forward-Looking: Projects the next logical market reaction instead of just explaining the past.
✅ Clean, Structured, Educational: Layout and visuals guide the viewer through logical trade steps.
✅ Value-Packed: Provides actionable levels and flexible scenarios — helpful to traders of all levels.

XAUUSD Best Buying Zone for Today 📉 Gold Market Update – Buy the Dip Strategy 🪙
As we know, gold is currently in a selling trend and has dropped nearly 700 pips. However, here are some potential buy dip zones to watch:
🔹 First Buy Zone: 3370–3365
🔹 Second Buy Zone: 3360–3350
🚀 There's a good chance for a bounce from these levels.
⚠️ Note: You’re trading against the trend, so make sure to apply proper risk management! 🛡️

XAUUSD NEW OUTLOOKXauusd buy from 3360
Tp1 3370
Tp2 3380
Tp3 3390
Stope Lose 3350
TRADE AT YOUR OWN RISK

Gold Next Move Possible Hello Traders, Today I’m back with another idea.
As you know gold has changed the trend from bullish to the bearish.
The gold has fallen from the area 3438 to 3351. Now the current price is 3358.
I’m looking for the sell zone, In my view gold will drop till 3310.
I’m monitoring the sell zone 3364-3371, when the market touches the zone, I will add sell and my target will be 3310. Keep in bear my first target is 3351, second target is 3337 and the last target is 3310.
In the case if price breaks the 3377 area then we will have to wait until confirmation for another setup.
Stay Tune for every update.
Kindly share your ideas and leave positive comments. Thanks Everybody.

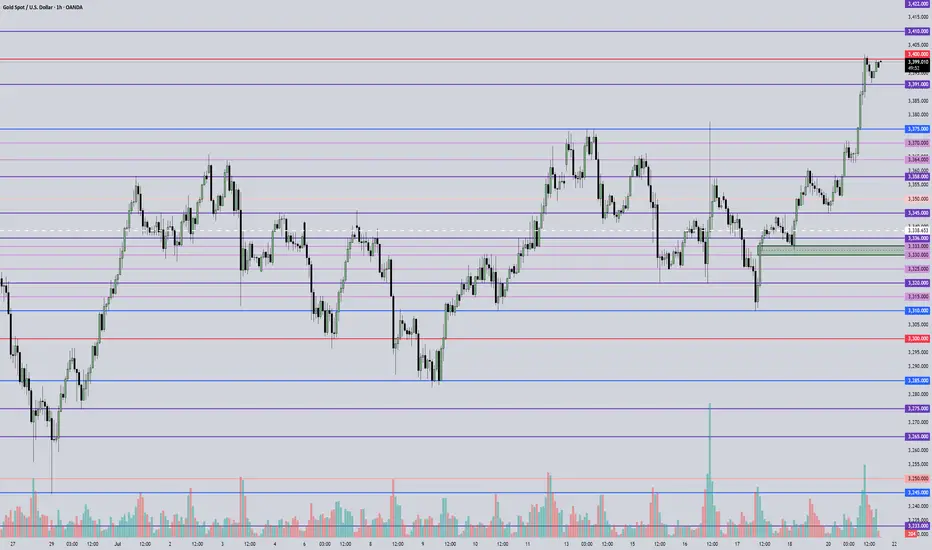
Bullish Breakout Toward 3,436 TargetThis chart shows a technical analysis setup for XAUUSD (Gold Spot vs US Dollar) on the 1-hour timeframe using harmonic and pattern trading strategies. Here's a discretionary breakdown:
---
🔍 Pattern Identified:
A Bullish Gartley Pattern or potentially ABC-D Harmonic Pattern is forming:
Points X-A-B-C-D are labeled, with D just completed.
D point completion indicates a buy (long) opportunity, as the price reversed upward from point C to D.
---
📊 Current Market Action:
Price is currently at 3,386.770 (green candle).
A breakout from the potential neckline or resistance zone around the D point is observed.
There's a small bullish consolidation marked as “TR” (likely Trading Range or Temporary Resistance).
---
🎯 Target Projection:
The price target is labeled at 3,436.495, which is:
Based on the harmonic projection or previous swing high.
~+50 points above the current level (around +1.5%).
---
🧩 Support & Resistance Levels:
Immediate support: 3,360.125 (gray zone)
Next major support: 3,344.380 (lower red line)
Resistance/Target: 3,436.495 (red line/target zone)
---
📈 Discretionary Insight:
Bullish Bias: The pattern suggests a bullish reversal or continuation.
Breakout confirmation: If price holds above the D point and TR zone, it could accelerate to the target.
Risk consideration: Watch for potential pullbacks into the support zone near 3,360. A break below that could invalidate the setup.
---
✅ Potential Trading Plan (Discretionary):
Entry: Already triggered above the D point (confirmation breakout).
Stop Loss: Below C or below the gray support zone (around 3,344).
Target: 3,436.495
Risk-Reward Ratio: Appears favorable if stop is tight and target is reached.
