XAUUSD buy when touched the black trendlinethis is a high possible scenario which means the Gold will still be on a bullish cycle
XAUUSDK trade ideas

What next on XAUUSD? What’s the next possible move on XAUUSD as we saw a slight drop above the all time high this week? We a break below $3200. I anticipate a further decline due to high selling pressure.

Gold at Key Support – Will Bulls Step In or Drop Continue?🌐 Market Overview
Gold has struggled to recover after yesterday's sharp drop, driven by macro-political concerns and profit-taking at recent highs.
🔻 On July 24, former President Trump made an unexpected visit to the US Federal Reserve, sparking speculation that he's pressuring the Fed to cut interest rates soon.
While the Fed has yet to make any dovish moves, short-term bond yields dipped slightly, showing growing market expectations for policy easing.
The US dollar remains strong, reflecting some skepticism around the Fed’s possible shift despite recent economic strength.
📉 Technical Outlook
On the H2 chart, gold still maintains an overall bullish structure. However, it's approaching a critical support level near 3338, which aligns with the VPOC and the ascending trendline.
📌 If this zone breaks, price may rapidly fall toward deeper liquidity zones in the 332x – 329x range.
🎯 Trade Setups
🔽 BUY SCALP (Quick Reaction Play)
Entry: 3338 – 3336
Stop Loss: 3332
Take Profit: 3342 – 3346 – 3350 – 3354 – 3360 – 3365 – 3370 – 3380
🟢 BUY ZONE (Deep Buy Area – Long-Term Potential)
Entry: 3312 – 3310
Stop Loss: 3305
Take Profit: 3316 – 3320 – 3325 – 3330 – 3340 – 3350 – 3360 – 3370 – 3380
🔻 SELL ZONE (if market retests)
Entry: 3374 – 3376
Stop Loss: 3380
Take Profit: 3370 – 3366 – 3360 – 3355 – 3350 – 3340 – 3330
🔍 Key Levels to Watch
Support: 3350 – 3338 – 3325 – 3310 – 3294
Resistance: 3374 – 3390 – 3400 – 3421
⚠️ Risk Note
As we head into the weekend, liquidity sweeps are common – especially on Fridays. Be cautious of sharp moves.
Focus mainly on scalp setups today. Avoid early long entries unless strong confirmation appears at lower liquidity zones.
Always follow your TP/SL strategy to protect your capital.

Gold------sell near 3392, target 3370-3350Gold market analysis:
Yesterday, gold in the European and American markets plunged directly. It is cold at high places. Gold has already experienced four big plunges above 3435. From the perspective of form, there is a super pressure there. We also reminded in the analysis yesterday that the rhythm of gold daily lines in the past two days has changed very quickly, and it is all shocks and then quickly pulls up and ends directly. It is basically difficult to follow its rhythm without direct pursuit. The big negative line of the daily line has destroyed the strong support near 3402-3404. This position has been converted into a new strong pressure. Today's idea is to adjust the bearish trend and continue to sell on the rebound. The adjustment of the daily line is not sure whether it is an adjustment of the wave structure, but it can be determined to sell in the short term. We are just a trend follower. Today, gold will not rebound above 3402 and is basically weak.
Gold plunged directly in the Asian session, and the selling force is still relatively strong. At present, the new low strong support of the daily line has not appeared. The next moving average support of the daily line is around 3366. I estimate that there will be a rebound at this position. If the hourly Asian session does not fall and rebounds first, consider continuing to sell it at 3395 and 3402. Gold likes to convert quickly recently. If it stands on 3404, it will be reconsidered.
Support 3374, 3366 and 3350, suppress 3395 and 3402, and the weak watershed before the market is 3395.
Fundamental analysis:
Tariffs have not affected the market recently, and there is no major news released. The market is relatively calm.
Operation suggestion:
Gold------sell near 3392, target 3370-3350

XAUUSD – the final bounce before the fall?Gold has lost its shine — at least for now.
After a relentless climb within the rising channel, price has just “kissed the ceiling” near the strong resistance at 3,447, forming a series of doji candles with long upper wicks — a classic sign of exhaustion. Meanwhile, FVG zones are being filled repeatedly, suggesting that buyers are losing dominance.
But could this final push be a trap?
The familiar script: price dips slightly toward the channel bottom — shaking out weak positions — then breaks straight down to 3,351. This zone once sparked strong rallies, but this time, everything seems to be working against gold.

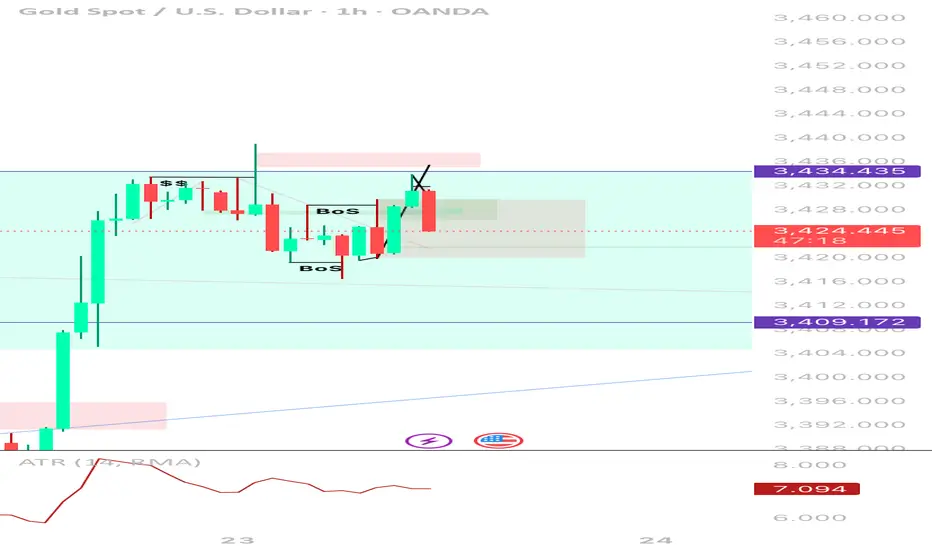
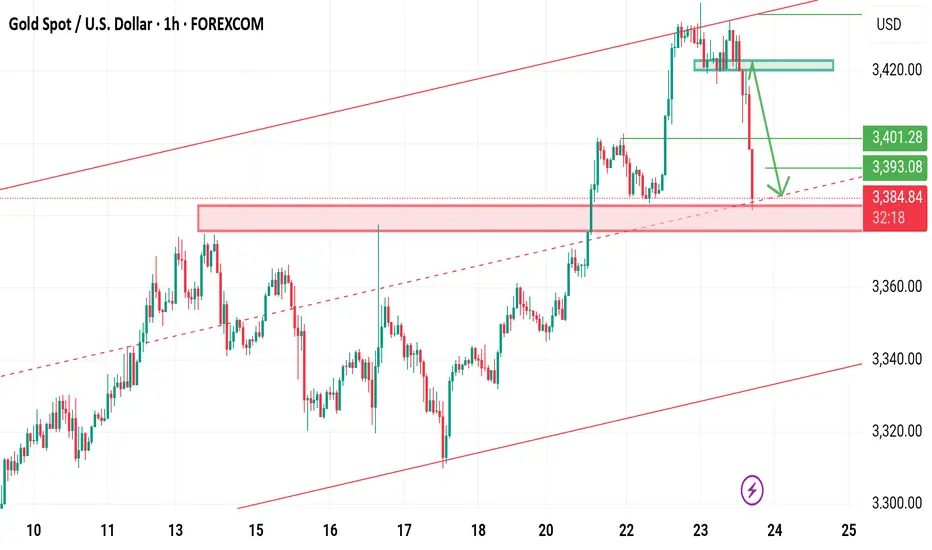
Call me bluff 🧾 TradingView Journal Entry – XAUUSD
Date: July 23, 2025
Pair: XAUUSD
Timeframe: 1H (Entry), HTF Alignment: 4H / 1W
Position: Sell
Execution Style: SMC (Smart Money Concept)
⸻
🧠 Trade Reasoning
• HTF Context (4H/1W):
Price recently broke out of a falling wedge on the weekly and created a strong impulsive leg on the 4H. However, price had reached a key supply zone near 3,434, showing signs of exhaustion. No continuation above key structure → likely retracement phase incoming.
• LTF Setup (1H):
• ✅ Equal Highs Liquidity (”$$”) above 3,434 swept
• ✅ Bearish engulfing candle immediately after sweep
• ✅ Two internal BOS (Breaks of Structure) showed clear bearish intent
• ✅ Price returned to mitigate inside a small OB/FVG zone
• ✅ Entry confirmed on rejection wick + strong bearish follow-through
⸻
💼 Trade Management
• Entry: 3,433.5
• Stop Loss: 3,436.5 (above liquidity wick)
• Take Profit Targets:
• TP1: 3,420 (mitigation zone fill) ✅
• TP2: 3,409.172 (clean imbalance + EQ) ⏳
• TP3: 3,388.985 (4H POI / demand) 🔜
• Risk: ~3 points
• Reward: ~15–45 points (1:5–1:15 depending on TP)
⸻
📈 Reflection
This was a high-confidence SMC setup:
• Liquidity sweep ✅
• Structure shift ✅
• Entry confirmation ✅
Only improvement: I could have refined entry on 15m or 5m for even better RR. ATR was dropping, signaling a compression → made sense for a clean move post-sweep.
⸻
📌 Tag Notes
• #SMC #LiquiditySweep #BreakOfStructure #1HEntry #HTFRejection #Gold #XAUUSD #RiskReward
GOLD Will Keep Growing!
HI,Traders !
#GOLD keep trading in
An uptrend along the rising support
So as the pair is approaching
A the support we will be
Expecting a bullish rebound !
Comment and subscribe to help us grow !

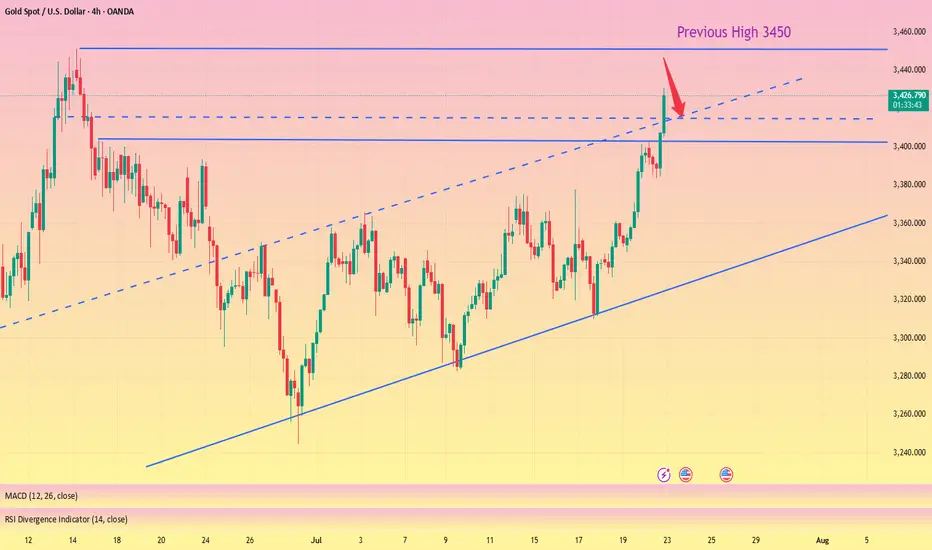
Gold Bulls Back in Control as Trump Pressures Fed for Rate CutsHey Realistic Traders!
President Trump is ramping up pressure on the Fed to cut interest rates , saying the U.S. is falling behind countries with looser policies. As several Fed officials begin to shift their stance, expectations for rate cuts are growing. That’s putting pressure on the dollar and giving gold a fresh boost.
We’ll take a closer look at what this means for OANDA:XAUUSD (Gold) through technical analysis and explore its upside potential.
Technical Analysis
On the 4-hour chart, Gold has moved above the EMA-200, signaling a shift in momentum to the upside. Price has also broken out of a Descending Broadening Wedge (DBW) pattern, which often indicates the start of a bullish trend.
The breakout was confirmed by a Bullish Marubozu candle, reflecting strong buying pressure. To add further confirmation, the MACD has formed a bullish crossover, reinforcing the upward momentum.
Looking ahead, the first target is seen at 3417. If reached, a minor pullback toward the historical resistance zone (green area) may occur, with a potential continuation toward the second target at 3500.
This bullish outlook remains valid as long as the price stays above the stop-loss level at 3271 . A break below this level would invalidate the setup and shift the outlook back to neutral.
Support the channel by engaging with the content, using the rocket button, and sharing your opinions in the comments below.
Disclaimer: "Please note that this analysis is solely for educational purposes and should not be considered a recommendation to take a long or short position on XAUUSD.

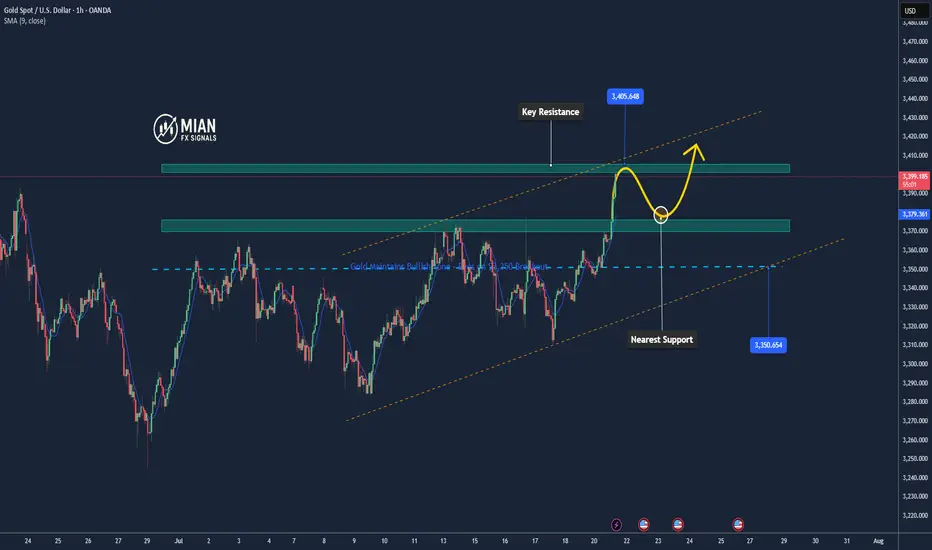
Gold Could Extend Rally if Breaks 3,400📊 Market Overview
Gold is currently trading around 3,400 USD/oz, up approximately +1.41% over the past 24 hours.
The upward momentum is supported by a weakening US Dollar following dovish-leaning remarks from the Fed, along with growing demand for safe-haven assets amid trade uncertainties.
📉 Technical Analysis
• Key Resistance: ~3,400–3,405 USD (psychological zone; a break above could open the path for further gains).
• Nearest Support: ~3,370–3,375 USD, followed by 3,345–3,350 USD, which marks today’s low.
• EMA 09/20: Price is currently trading above both EMA 9 and EMA 20, confirming a short-term uptrend.
• Momentum / Oscillators: RSI is in the overbought zone; MACD and ADX still show a “buy” signal → bullish trend continues, but watch for possible technical pullbacks.
📌 Opinion
The price may continue to rise if it breaks above the 3,400 USD/oz level, especially if the USD remains weak and safe-haven flows continue to support gold. However, if there’s short-term selling pressure or a USD rebound, gold may pull back toward the 3,370–3,375 USD support zone.
💡 Trade Setup
SELL XAU/USD at: 3,400–3,405 USD
🎯 TP: 3,380 USD
❌ SL: 3,410 USD
BUY XAU/USD at: 3,370–3,375 USD
🎯 TP: 3,390–3,395 USD
❌ SL: 3,360 USD
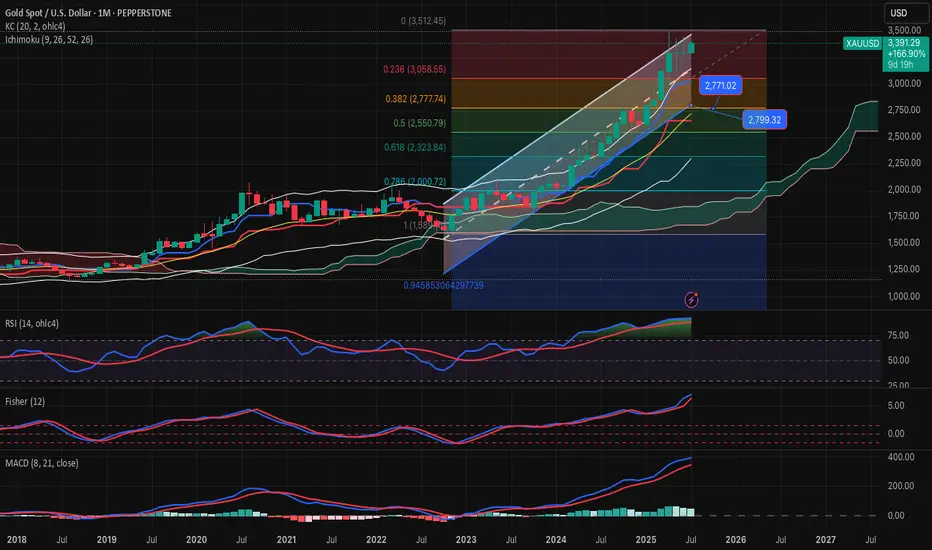
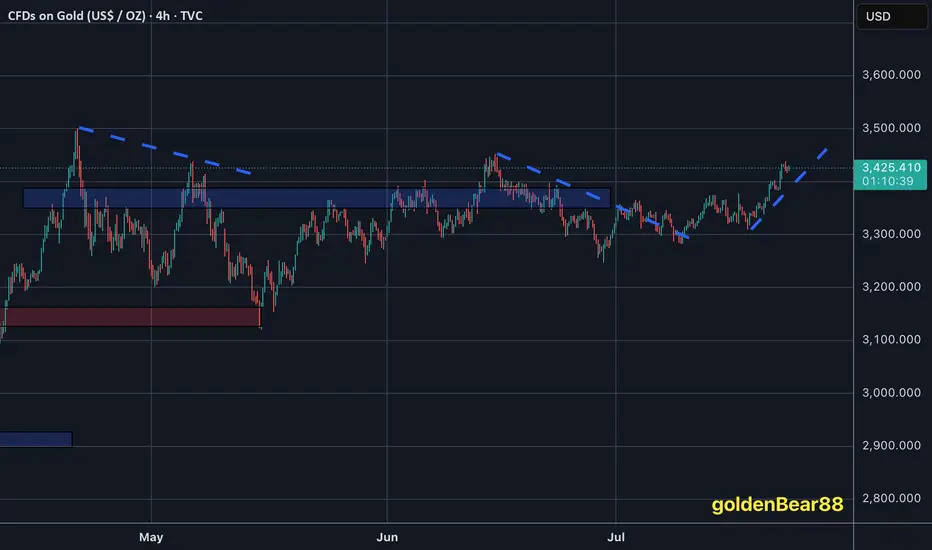
GOLD-SELL strategy Monthly chart Reg. ChannelGold is very overbought medium-term, and the danger is we may see a large decline. Same as I pointed out today on the shorter time-frame, we are in SELL mode, even though we have been moving higher. Crypto will lead the way.
Strategy SELL @ $ 3,385-3,450 and take profit near $ 2,845 for now.
DeGRAM | GOLD above the resistance level📊 Technical Analysis
● Bulls defended the channel base at 3 333, snapping the intraday falling wedge and reclaiming the broken trend-line; successive higher-lows since 17 Jul signal fresh upside momentum.
● A clean H1 close over the former pivot 3 355 flips the wedge crest into support and activates the measured-move target at the upper horizontal barrier 3 366, with the March swing cap 3 389 next.
💡 Fundamental Analysis
● Softer US jobless-claims trend and Fed speakers’ hints that “policy is restrictive enough” cooled two-year real yields, while PBoC’s June data showed net gold purchases for a fourth month—both underpinning spot demand.
✨ Summary
Long 3 345-3 355; hold above 3 355 targets 3 366 → 3 389. Bias void on an H1 close beneath 3 333.
-------------------
Share your opinion in the comments and support the idea with a like. Thanks for your support!

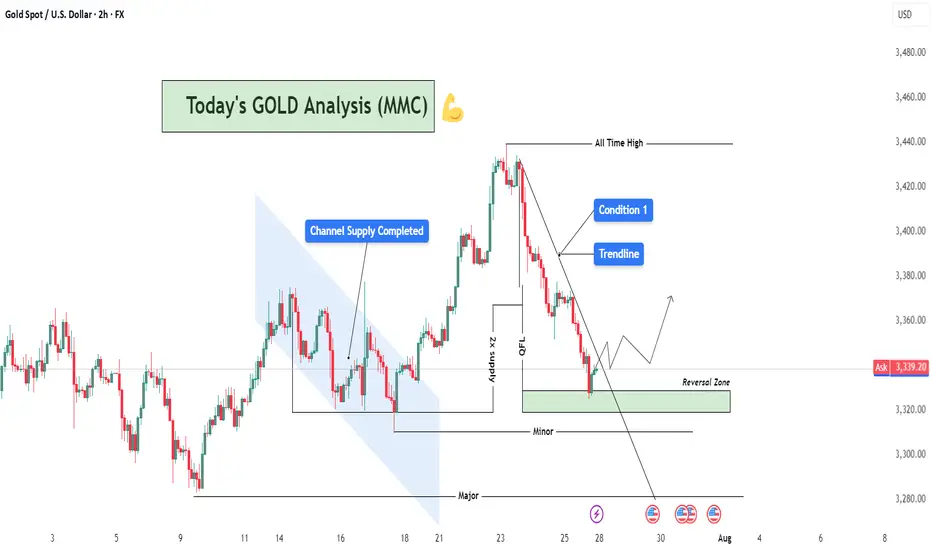
XAUUSD Analysis : Reversal Zone & Trendline Break Setup 🧠 Market Breakdown (Based on MMC Concepts)
Gold (XAU/USD) recently touched an All-Time High, followed by a sharp correction respecting a clean descending trendline — confirming strong selling pressure in the short term.
After price completed a Channel Supply zone (highlighted), it dropped significantly and created a 2x Supply Structure along with a QFL (Quasimodo Failure Level) — a strong indication of liquidity engineering by smart money.
Now, price has entered the Major Reversal Zone, which aligns with a key minor structural demand level. The reaction here becomes highly important, as it could mark the beginning of a new bullish leg.
📌 Technical Conditions
Trendline (Condition 1): Still active; breakout confirmation required for bullish entry.
Reversal Zone (Demand Area): Price currently reacting; signs of rejection forming.
Smart Money Behavior: Liquidity sweep + QFL zone = potential institutional accumulation.
Momentum Watch: Look for bullish engulfing or strong pin bar as confirmation.
🎯 Price Levels to Watch
Upside Targets:
🔹 TP1: 3,360 – 3,380
🔹 TP2: 3,420 – 3,440
Invalidation Zone:
🔻 Break and close below 3,300 = bearish continuation likely.
💡 Conclusion
Gold is approaching a decision point. If this reversal zone holds and we break the trendline, we could see a strong rally back toward previous supply zones. However, failure to hold could bring price lower for further liquidity grabs.
Stay patient. Let price confirm.
Gold Analysis and Trading Strategy | July 25✅ Fundamental Analysis:
🔹 Political Pressure on the Federal Reserve Increases Safe-Haven Demand
President Trump made a rare visit to the Federal Reserve, pressuring it to cut interest rates. At the same time, his political allies filed a lawsuit against Fed Chair Jerome Powell, demanding a public meeting. These events have raised concerns over the Fed’s independence and the outlook for U.S. monetary policy, increasing long-term uncertainty. This serves as a medium- to long-term bullish factor for safe-haven assets like gold.
🔹 Rising Geopolitical Tensions Fuel Safe-Haven Demand
The U.S. has withdrawn from the Doha ceasefire negotiations, accusing Hamas of insincerity. Meanwhile, military tensions between Thailand and Cambodia have escalated, with cross-border clashes intensifying. Should the conflict broaden, safe-haven buying of gold could be triggered, further supporting prices.
✅ Technical Analysis:
🔸 On the daily chart, gold has closed lower for two consecutive sessions, forming a “two black crows” pattern—an indication that bearish momentum is gradually taking control and market sentiment is turning pessimistic. Although a short-term consolidation or rebound is possible, the broader trend remains bearish.
🔸 The $3340 level on the daily chart is a key support zone. It marks not only a crucial dividing line for the previous uptrend but also a critical battleground for bulls and bears. If this level holds, a technical rebound could follow; if it breaks, gold may continue its decline toward the $3310 area.
🔴 Resistance Levels: 3373–3375 / 3382–3390
🟢 Support Levels: 3340–3335 / 3330–3310
✅ Trading Strategy Reference:
🔻 Short Position Strategy:
🔰Consider entering short positions in batches if gold rebounds to the 3365-3370 area. Target: 3355-3345;If support breaks, the move may extend to 3340.
🔺 Long Position Strategy:
🔰Consider entering long positions in batches if gold pulls back to the 3335-3340 area. Target: 3365-3375;If resistance breaks, the move may extend to 3380.
🔥Trading Reminder: Trading strategies are time-sensitive, and market conditions can change rapidly. Please adjust your trading plan based on real-time market conditions. If you have any questions or need one-on-one guidance, feel free to contact me🤝

XAUUSD Bullish ScenarioAccording to the data in the chart, the price has proven its bullishness by breaking important levels. Overall analysis can be buying at $3340 towards the target of $3450. On the other hand, if the price breaks $3340 with strength, the bullish scenario can fail.

Bullish Momentum Fading? Key Correction Levels Ahead XAUUSD – Bullish Momentum Fading? Key Correction Levels Ahead (23 July)
📰 Market Overview
Gold surged strongly overnight, driven by:
A speech from Fed Chair Jerome Powell, with no hints of resignation or major policy shift.
Rising geopolitical tensions between the US, China, and the EU — with the 1st of August marked as a key deadline.
A notable drop in US bond yields and the US Dollar, triggering increased demand for safe-haven assets like gold.
While today’s economic calendar is quiet, the market remains sensitive to sudden volatility.
📉 Technical Analysis
On the H4 chart, the recent bullish wave shows signs of exhaustion. Reversal candles are now forming on the H1 and M30 timeframes — suggesting a potential correction in the short term.
The 3412 – 3410 support zone will be critical. If price breaks below and invalidates the ascending trendline, we may see a deeper pullback toward lower liquidity zones (FVGs).
Below that, the 335x region offers strong confluence (Fibonacci 0.618 + previous demand zone), making it a prime area for potential long entries if price action confirms a bounce.
📌 Trade Setups to Watch
🔻 SELL ZONE: 3469 – 3471
Stop Loss: 3475
Take Profit Targets: 3465, 3460, 3455, 3450, 3445, 3440, 3430, 3420
→ Wait for a breakout and retest before shorting.
🔸 BUY SCALP: 3385 – 3383
Stop Loss: 3379
TP Targets: 3390, 3394, 3398, 3402, 3406, 3410
→ Ideal for intraday pullback entries with clear structure.
🔹 STRONG BUY ZONE: 3356 – 3354
Stop Loss: 3350
TP Targets: 3360, 3364, 3368, 3372, 3376, 3380, 3390, 3400
→ Great long-term entry zone with technical alignment (liquidity + fib levels).
⚠️ Risk Management Reminder
Even in low-news sessions, markets may spike unexpectedly due to political statements or liquidity sweeps.
Always respect your TP/SL levels — smart trading is protected trading.
💬 Patience breeds precision. Wait for the zone, trust the plan, and manage the trade.

XAUUSDXAUUSD Updated in H1 :
The gold signal is marked on the chart based on the latest price changes and the supply and demand in the market. These points include the entry point, stop loss, and take profit

Excellent profits booked [500 pips SECURED ]As I mentioned throughout yesterday’s and Today's commentary session:
My strategy is still the same – sell from 3430-3435.
Gold around my key level yesterday at 3432-3435, which the market respects well and as our first target was 3405 then 3495
Very happy with the profits so far.
My medium-term targets remain 3390 & 3380 which is achieved alhumdulliah .I sold gold from every local high.
Also I mentioned 3420 turns retest and i opend my another sell trades on down side
All I say thanks to those who followed us and made profits.
Gold breaks new high, expect a pullback in the evening#XAUUSD
After the rapid rise of the previous day, the gold market has fallen into an overbought state, but yesterday's increase of nearly $60 still provided solid support for the bulls. It is expected that the market will show repeated fluctuations in the future⚖️.
In terms of operation, it is recommended to pay close attention to the gains and losses of the 3,400 mark. If it is successfully broken through, it is expected to further test the 3,420-3,425 and 3,450 lines; on the downside, pay attention to the top and bottom conversion support of 3,403📈.
📊At present, you can consider shorting near 3430, defending 3440, and aiming at 3410💡
🚀SELL 3430-3440
🚀TP 3415-3405
Gold is often bullish and bearish, with a focus on the 3411 wate
Gold prices hit a five-week high of $3,439 an ounce on Wednesday before turning lower on profit-taking and a rebound in the dollar. However, from a technical perspective, the path of least resistance for gold prices still appears to be to the upside. Looking ahead, trade and political developments will continue to play a key role in gold price movements, while traders will also be keeping a close eye on the feud between Trump and Fed Chairman Powell.
Why did gold return to $3,400? Reasons explained!
1 As investors continue to focus on U.S. President Trump's August 1 tariff deadline, trade uncertainty and weaker U.S. Treasury yields have pushed gold prices to a five-week high. At the same time, trade uncertainty is also triggering some safe-haven demand.
2 Meanwhile, investors are also preparing for the Fed meeting next week. Although the Fed is expected to keep interest rates unchanged, the market expects that the Fed may cut interest rates in October. Gold is traditionally seen as a hedge in uncertain times and tends to perform well in a low-interest rate environment.
What do you think of today's gold trend!
Today, gold rose to 3439 and then continued to fluctuate sideways. At present, gold has been fluctuating and weakening near 3420. Relatively speaking, the trend is still strong, but the trend has not continued to break through the high point. In this trend, it is actually unwise to chase the rise. At present, we still have to wait for the market sentiment to be fully mobilized before continuing to operate!
The hourly line is still the view of the previous post. Near 3411 is the key position for the second bullish today. Unfortunately, the fluctuation has been fluctuating around 15 points today, and the amplitude of the fluctuation has slowed down. It is still necessary to wait quietly. After all, under the current situation of large repetitiveness, it is not easy to enter the market at a good point and there is a high probability that there will be no good profit margin. If there are other changes later, I will give them in real-time guidance!
Gold: More near 3411, defend below 3403, and the target is 3440-50!

Gold Likely to Rise as USD Weakens📊 Market Overview
Spot gold (XAU/USD) is trading around $3,423–$3,427/oz, down ~0.2% after news of a US–Japan trade deal boosted risk sentiment. However, a weaker USD and lower US bond yields continue to support safe-haven demand.
📉 Technical Analysis
• Resistance: $3,447 – $3,464 – $3,496
• Support: $3,399 – $3,367
• EMA9: Price is below EMA9 → short-term bearish; medium-term outlook remains bullish if price reclaims EMA20.
• Momentum indicators: RSI ~69; MACD & ADX favor buyers.
📌 Outlook
Gold may move sideways or edge higher if USD weakness persists. A rise in risk appetite (e.g. from trade deals) could pressure prices short term.
💡 Suggested Trading Strategy
🔻 SELL XAU/USD: $3,442–$3,445
🎯 TP: 40/80/200 pips | ❌ SL: $3,449
🔺 BUY XAU/USD: $3,402–$3,405
🎯 TP: 40/80/200 pips | ❌ SL: $3,399

Gold Trading on my predicted valuesTechnical analysis: As discussed, as long as #3,400.80 mark (Xau-Usd numbers) holds, Gold is more likely to push towards #3,442.80 strong Resistance and #3,452.80 benchmark in extension for a Higher High’s Upper zone test invalidating the Hourly 4 chart’s Neutral Rectangle. This Trading week is packed with the U.S. reports, so Fundamentally the real trend will be revealed after those, since today’s E.U. session delivered indecision movements only (Spinning Top’s formation) however Bullish bias is here to stay. The Short-term Price-action has turned Bullish just over the Hourly 4 chart’s former Support at #3,363.80, while Technically, Gold is critically Bearish. It is interesting to mention that even the Daily chart is to a certain extent is Bearish however Technical rules do not apply on Fundamentally driven sessions. Everything depends upon the DX (and to a lesser extent Bond Yields), so I can't make any Short-term recommendation other than the Bullish break-out points that I am already Trading on. See also how Xau-Usd (spot price) and GC (Futures price) are finally closing the gap and getting into tight range again. Regarding today’s session - two straight red Hourly 1 candles (after Bullish rejection) so far which indicate (unless broken) that #3,427.80 is a Double Top. Most likely Gold is going towards #3,416.80 - #3,420.80 to test the Support zone and then if Price-action gets rejected (most likely it will), then Hourly 4 chart’s Resistance zone test should be next - and potentially stay Neutral for a few sessions in a symmetrical manner as April #14 - 16.
My position: I spotted that many Traders Sold Gold throughout yesterday's session which was a mistake personally as Gold will remain strong on each next session due global Fundamentals. Firstly I have Bought #3,385.80 Bottom with #4 orders. First one I have closed near #3,400.80 benchmark, second two I have closed at #3,407.80 since Profit was already great and left final runner which I closed on #3,424.80 / expecting #3,434.80 final destination which was delivered. I will keep Buying every dip on Gold as long as #3,400.80 benchmark holds as an Support from my key re-Buy points.
Elliott Wave Analysis – XAUUSD | July 22, 2025
🔍 Momentum Overview
• D1 timeframe: Momentum has entered the overbought zone, signaling a potential reversal within the next 1–2 sessions. That said, the current bullish leg may still extend — it’s important to wait for tomorrow’s D1 candle close for confirmation. Entering overbought territory is a warning that upside momentum is weakening.
• H4 timeframe: Momentum is currently declining. Unless a strong bullish candle closes above 3391 to trigger a reversal, the price is likely to continue moving sideways or downward today.
• H1 timeframe: There are signs of a bullish reversal. If the price holds above 3385 and posts a strong breakout candle above 3391, it could present a short-term buying opportunity.
🌀 Elliott Wave Structure Update
• Price is consolidating within the 3390 – 3402 range — a key zone to monitor closely.
• The 3380 level is a critical threshold, aligned with the 0.382 Fibonacci retracement of Wave (3). A daily close below this level would raise the possibility that the move is part of a correction rather than Wave 4.
• A flat ABC correction is currently unfolding, with the 1.618 extension of Wave A already reached at 3385.
• If price breaks below 3360, it would overlap with the previous Wave 1, invalidating the current impulsive wave count. In that case, we should consider the potential continuation of a larger abcde triangle correction.
🔗 Momentum & Wave Structure Combined
• H1 is showing early signs of a bullish reversal, but H4 momentum remains bearish. Without a strong breakout candle above 3391, price is likely to drift sideways or lower until H4 reaches the oversold zone.
• Conservative approach: Wait for H4 to enter oversold territory before considering any long positions.
• The ideal buy setup would be a bullish reaction from the 3382 – 3380 zone.
📈 Trade Setup
• Buy Zone: 3382 – 3380
• Stop Loss: 3372
• Take Profit 1: 3402
• Take Profit 2: 3412
• Take Profit 3: 3428

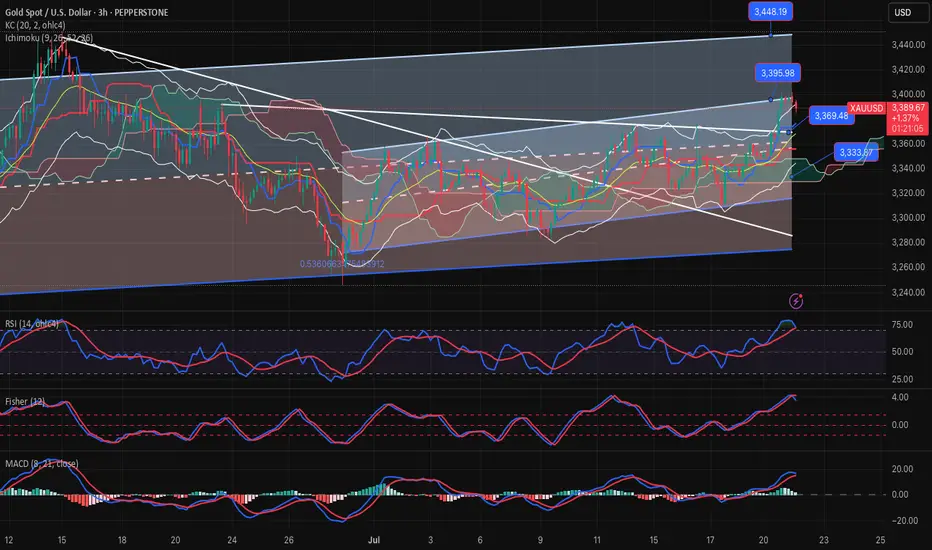
GOLD-SELL strategy 3 hourly chartGOLD has been positive due to crypto buoyant state of mind. These are very overbought, even though we see each day a higher price, it only means the correction will become very severe, is my person al viewpoint.
Gold techs are starting to become negative, and I feel we should move lower towards $ 3,300 > 3,240 area over-time.
Strategy SELL @ $ 3,385-3,425 and take profit in stages near $ 3,325 - $ 3,247 for now.