Report - 21 jully, 2025Executive Summary – Multi-Event Market Pulse
UK Retreats on Encryption Order: Facing U.S. tech retaliation risk, London softens its demand that Apple create backdoor access. Apple and WhatsApp resist, Washington defends encryption integrity. → Positive for U.S. tech (Apple, Meta), bullish Nasdaq, bearish UK regulatory credibility.
EU Confronts Italy and Spain Over Bank M&A Blocks: Brussels says national vetoes breach merger law. Push to consolidate banking into “EU champions.” → Bullish for European bank stocks if deal-making resumes. EUR volatility risk if tensions escalate.
Japan’s PM Under Fire After Upper House Loss: LDP loses majority amid cost-of-living and immigration backlash. PM Ishiba struggles to reach tariff deal with U.S. → Bearish for JPY near-term, pressure on USDJPY to rise. Uncertainty weakens Japanese equities.
Trump’s First 6 Months: Tariffs, ICE Raids, Fed Tensions, and Executive Rule:
DXY at risk as dollar has worst year since 1973.
Tariffs at 8.8% effective rate; targeting copper, autos next.
170 executive orders destabilize governance and investor sentiment.
“One Big Beautiful Bill” cuts taxes, axes Medicaid, boosts ICE funding.
→ Supports short-term U.S. GDP but structurally negative for dollar and fiscal outlook.
Audit Regulator Shakeup: PCAOB chief removed; deregulation wave begins. → Increased risk for audit quality in U.S. equities. Long-term trust implications.
London Stock Exchange Eyes 24-Hour Trading: In response to retail and crypto-driven demand. → Bullish for UK capital markets infrastructure long-term; potential tech strain and regulatory pushback.
Copper Markets Shaken by Tariff Uncertainty: Codelco warns of U.S. demand disruption. Supply chain anxiety for EVs, data centers. → Copper price volatility likely; bearish short-term if tariffs confirmed.
ECB Focused on Euro Strength’s Disinflation: Unlikely to comment amid tariff fog. → EUR strength may persist absent pushback; pressure on export-reliant EU names.
U.S. PMI and UK Retail Data Awaited: PMIs expected to cool modestly. UK data may worsen amid inflation and tax burdens. → Short-term equity volatility possible. GBP faces downside bias.
Strategic Forecast & Market Reaction
1. US–UK Encryption Clash
The UK government is being forced to retreat from its encryption crackdown targeting Apple’s most secure cloud services after escalating pressure from U.S. leadership, including Vice President JD Vance and President Trump. With Apple and Meta resisting surveillance backdoors and withdrawing services from the UK, tech-sector alignment with U.S. privacy norms is reaffirmed. Britain’s attempt to enforce decryption via the Investigatory Powers Act triggered transatlantic diplomatic strain, risking bilateral tech partnerships.
Market Impact: Bullish for large-cap U.S. tech (especially Apple, Meta), supportive of Nasdaq (NDX) and S&P 500 (SPX) tech sector weight. UK regulatory credibility weakens, negative for UK-listed tech firms. Expect near-term outperformance of U.S. tech relative to EU/UK peers. U.S. surveillance policy divergence also solidifies investor bias toward Silicon Valley over European counterparts.
2. EU–Italy/Spain Banking Intervention
Brussels’ direct challenge to Italian and Spanish interference in major bank mergers marks a potential turning point in European financial consolidation. Legal warnings to Meloni’s government and formal notice to Spain over BBVA–Sabadell freeze signal EU commitment to a unified capital market.
Market Impact: Bullish for EU bank equities (e.g., UniCredit, BBVA, Banco BPM) if mergers are unblocked. EUR may gain if consolidation expectations rise. Sovereign risk premium in Italy/Spain could briefly widen. European bank ETFs (e.g., EUFN) may attract inflows.
3. Japan’s Political Shakeup
Prime Minister Ishiba faces an internal leadership challenge after losing the LDP’s upper house majority. Tariff tensions with the U.S., especially affecting Japan’s auto sector, add pressure. The rise of populist and xenophobic parties adds volatility.
Market Impact: Bearish for JPY (USDJPY bullish bias). Risk-off sentiment may suppress Nikkei momentum. Japanese auto stocks face downside on unresolved U.S. tariff risks. Foreign investors may pause equity allocations pending leadership clarity.
4. Trump’s Institutional Shockwaves
Six months into his second term, Trump’s sweeping executive agenda — including $64B in tariff revenue, Fed destabilization, mass ICE arrests, and the “One Big Beautiful Bill” — is reshaping U.S. macro dynamics. Dollar weakness (-12% YTD), structural fiscal erosion, and regulatory disintegration (PCAOB ouster, Musk-led “Doge” agency cuts) risk undermining long-term asset trust.
Market Impact:
DXY: Structural weakening pressure → 🔻
XAUUSD: Supported by institutional instability → 🔼
SPX: Volatile with upside if GDP stays strong, but institutional drag rising → 🔁
2Y/10Y Yields: Sticky inflation + fiscal dysfunction = steeper curve → 🔼
Copper (HG1): At risk from U.S. tariff uncertainty → 🔻 short-term
Key Global Asset Reactions
XAUUSD (Gold):
Institutional erosion and rising CPI expectations support gold. If Powell is forced out or dollar drops further, gold likely reclaims $3,400+.
Direction: 🔼 Medium-term
S&P 500 / SPX:
Rotation into financials, M&A resurgence, and U.S. tech resilience provide upside offset. But tax/reform volatility raises headline risk.
Direction: 🔁 Near-term; 🔼 if earnings beat
USDJPY:
LDP instability + Fed yield premium = weak yen. Unless Ishiba resigns and risk-off returns, 150–152 in play.
Direction: 🔼 Short-term
DXY:
Threatened by executive overreach, weakening investor trust, and fiscal imbalance. Could breach 103 to the downside if data turns.
Direction: 🔻 Structural bias
Crude Oil (WTI):
Geopolitical bid (Japan, copper disruption) offset by global macro risk. Could trade $65–$70 range.
Direction: 🔁 Neutral for now
Dow Jones:
Outperformance due to dividend bias, financials strength, and lower tech exposure. Value rotation continues.
Direction: 🔼 Steady upside
XAUUSDK trade ideas

Be alert to new lows, pay attention to 3350 and go long at 3330📰 News information:
1. Tariff issues
2. Next week's NFP data
📈 Technical Analysis:
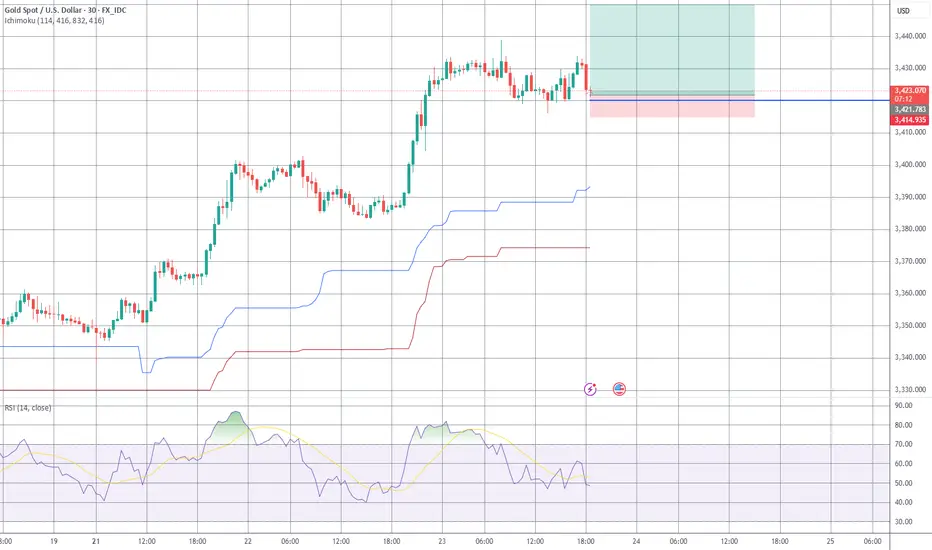
Last night, gold rebounded to only around 3377 before starting to fall back. Our judgment that the current rebound is weak is completely correct. 3350 is the support point of the bottoming out and rebounding to nearly $20 last night. Whether the European session can go down to 3350 will determine the trend of gold.
From the daily chart, the daily line has fallen for two consecutive days, suggesting that the price may continue to fall today. At present, we need to pay attention to this week's starting point of 3344-3345, and then the 3330 line below. The extreme decline is 3320-3310. At the same time, the narrowing of the daily Bollinger Bands is also paving the way for next week's NFP data.
From the 4H chart, the current MACD indicator crosses and increases in volume, and the middle track of the Bollinger Bands and SMA30 basically overlap near 3388. As for the hourly chart, the upper pressure is mainly concentrated near 3375-3377, which is also the high point of the rebound last night. If gold rebounds directly upward and encounters pressure and resistance at 3375-3385 for the first time, you can consider shorting and strictly implement stop loss.
Overall, if the current market falls to 3350-3345 for the first time and gets effective support, you can consider going long with a light position, defend 3340, and look to 3356-3362; if the decline is strong and continues to fall below 3350, the best stable long point for the day is 3330-3320, defend 3310, and earn $10-20 to leave the market.
🎯 Trading Points:
BUY 3350-3345
TP 3356-3362
BUY 3330-3320
TP 3345-3360
In addition to investment, life also includes poetry, distant places, and Allen. Facing the market is actually facing yourself, correcting your shortcomings, facing your mistakes, and exercising strict self-discipline. I share free trading strategies and analysis ideas every day for reference by brothers. I hope my analysis can help you.
TVC:GOLD PEPPERSTONE:XAUUSD FOREXCOM:XAUUSD FX:XAUUSD OANDA:XAUUSD FXOPEN:XAUUSD
GOLD (XAUUSD) Intraday Idea LongGold been keeping falling on both Asian and European sessions.
Most probably likely to pullback to London high after the New York session open.
Let's see if this plays out!
Good Luck!

Report - 25 jully, 2025U.S.–EU Tariff Negotiations Stabilizing Markets
Reports confirm the U.S. and EU are nearing a deal for 15% reciprocal tariffs—lower than the initially threatened 30% by President Trump. This easing of tensions led to moderate equity gains in both blocs, with the Stoxx 600 reaching a 6-week high before closing +0.2%. Pharmaceutical and auto stocks outperformed (Volkswagen +2.3%, Bayer +2.3%).
Forecast: If the 15% deal is finalized by the August 1 deadline, it would remove a key overhang on equities and boost cyclical sectors reliant on transatlantic trade. A failure, however, risks escalation, triggering retaliatory tariffs by the EU on $93bn of U.S. goods, dragging risk assets sharply lower.
DXY Outlook: Tariff de-escalation boosts safe-haven flows and investor optimism, supporting USD strength.
S&P 500: Short-term relief rally expected if the 15% tariff framework is signed. However, margin compression risks remain from lingering supply chain disruptions.
Tesla vs Trump: Policy Shock Rattles EV Sector
Elon Musk warned that Trump's anti-EV stance and trade war posture will sharply erode Tesla’s regulatory credit revenue and remove the $7,500 EV tax credit. Tesla's stock has cratered 37% since December, with a sharp 8% drop yesterday. Adjusted Q2 net income was down 22%, revenue -12%.
Risk Forecast: Loss of EV subsidies + political fallout between Musk and Trump could drag Tesla further and dampen broader EV sector growth.
XAUUSD: Rising political uncertainty and risks to the U.S. tech sector may drive safe-haven flows into gold.
Dow Jones: Tesla's underperformance and anti-EV policies could limit industrial sector gains.
ECB Holds Rates Amid Trade Risk Fog
The European Central Bank paused its easing cycle, holding the benchmark rate at 2%. Lagarde emphasized a "wait-and-watch" stance, signaling uncertainty due to unresolved trade talks and tariff volatility.
Market Implication: Eurozone government bond yields rose (10Y Bund at 2.70%), paring rate-cut bets. The euro softened to $1.1760.
EURUSD: Lack of further ECB accommodation and weaker consumer confidence amid trade frictions.
Fed Independence in Jeopardy? Market Confidence Wobbles
Pimco warned that White House pressure on Fed Chair Powell—including potential firing and scrutiny over $2.5bn HQ renovations—could destabilize markets. Trump continues pushing for aggressive 1% rates, diverging from current 4.25–4.5% levels.
Fiscal/Political Implication: Undermining Fed autonomy risks flight from U.S. bonds, undermining monetary policy credibility and capital inflows.
USDJPY: Yen may gain if markets lose faith in U.S. institutional integrity, despite rate differentials.
DXY: Temporary support from yields, but structural downside if Fed credibility erodes.
Deutsche Bank and BNP: Diverging Strengths in Volatile Landscape
Deutsche Bank posted its strongest Q2 in 18 years, driven by litigation charge reversals and stable investment banking performance. BNP Paribas also reported solid FICC trading (+27%), though equity trading lagged due to weak derivatives demand.
Equity Implication: Strong capital returns and stable European banking profitability support DAX resilience amid trade noise.
DAX: Boosted by banking and auto outperformance.
China–EU Trade Strains Escalate
Von der Leyen directly confronted Xi Jinping over trade imbalances and support for Russia. EU exports to China are down 6% YoY while Chinese imports to the EU are up 7%. Xi defended Beijing’s stance, warning against "decoupling" rhetoric.
Geostrategic Implication: EU may escalate anti-dumping and export control measures. Markets may see renewed volatility in European industrials and luxury sectors reliant on China.
XAUUSD: Rebalancing of power and heightened East–West tensions favor gold.
Oil Oversupply Warning from TotalEnergies
Total warned of an oil glut due to OPEC+ production increases and weakening global demand. Q2 profits fell 30% YoY. Brent now likely to stay within $60–70 range barring major geopolitical flare-ups.
Crude Oil: Short- to medium-term downside risk with soft demand and oversupply fears.
Energy Stocks: Dividend maintenance remains but debt levels and margin pressures may weigh.
AI Spending Surges – Alphabet and SK Hynix
Alphabet posted a 19% Q2 profit jump as AI integration boosts search volumes. Google’s cloud revenues rose 32%. Capex raised to $85bn. SK Hynix also posted record revenues from high-bandwidth memory chip sales, extending its lead over Samsung.
S&P 500: AI-driven earnings upside bolsters tech sector. Expect multiple expansion in mega-cap AI-exposed names.
XAUUSD : Robust AI investment supports risk appetite but inflationary fears could lift gold marginally.

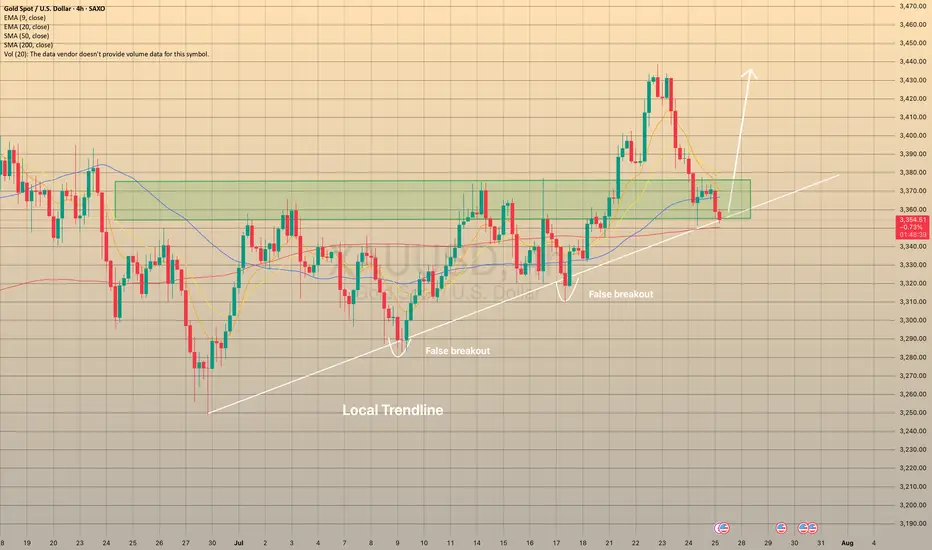
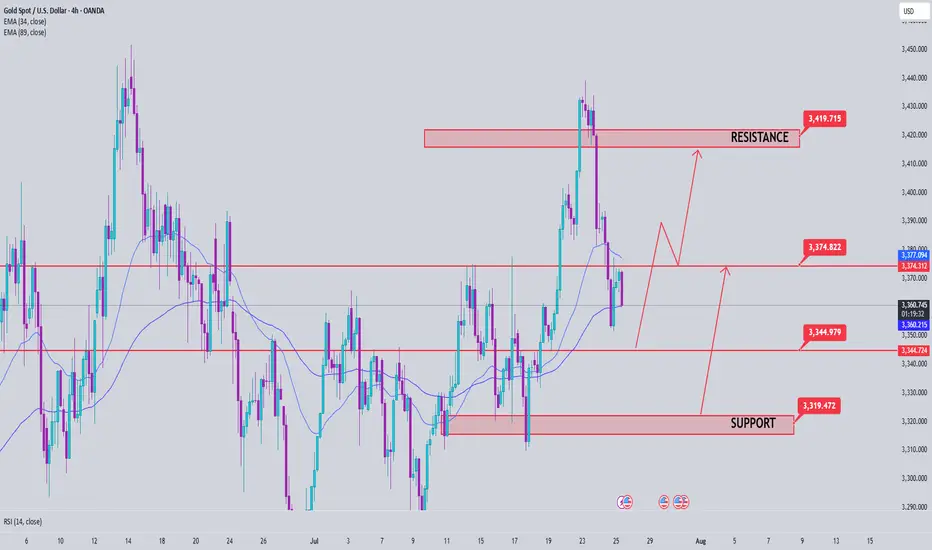
XAUUSD REACHED THE LOCAL TRENDLINEXAUUSD REACHED THE LOCAL TRENDLINE
On July 24 the U.S. Manufacturing PMI report came out way below forecasted (49.5 actual vs 52.6 forecasted). A number below 50 causes concerns among investors and could be a sign of an overall economic slowdown or recession. So, as a result, it could lead to an increase in demand for safe assets like gold.
However, today the price, despite the recent rebound from the trendline after report, came to the trendline once again. There is a high possibility that the price will rebound in nearest future: besides the local trendline we may observe the sma200 on 4-h chart. Additionally, we entered the price zone of 3,350.00-3,375.00, which used to be a resistance zone, now may play out as a support. In case of rebound, the price may go to local highs of 3,440.00 at least.
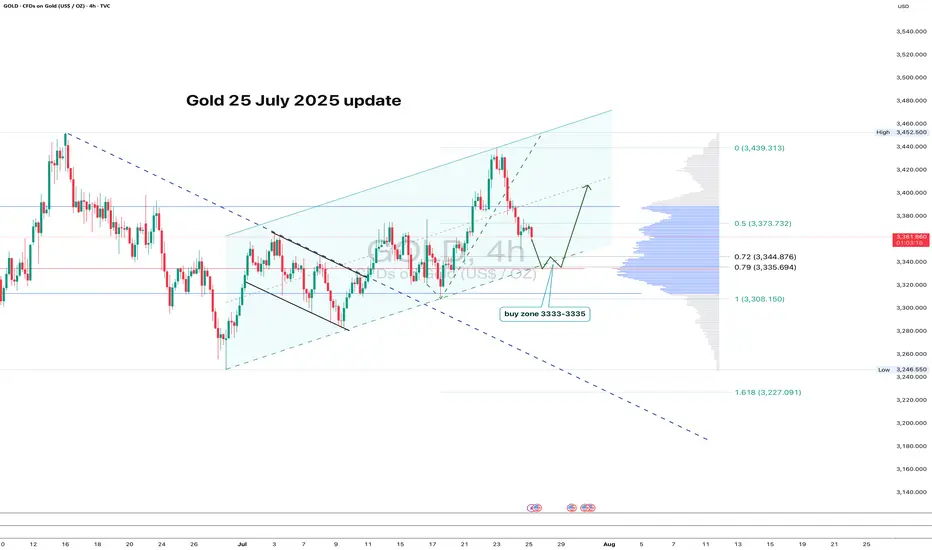
GOLD: clean pullback - now let’s see if support holdsGold continues to trade within an ascending channel on the 4H chart. After a local high, the price pulled back and is now approaching the key zone at 3333–3335. This area lines up with the 0.79 Fib retracement, the lower channel boundary, and a major volume cluster — a classic confluence zone.
If buyers show up here and we get a bullish reversal candle, this becomes a valid long setup with a tight stop just below the level. First target is 3373 (0.5 Fib), followed by a potential retest of the high near 3439.
The structure remains intact, the pullback is orderly, and volume supports the move. As long as the channel holds - the bias stays bullish.
Gold price analysis July 25Gold Analysis – D1 Uptrend Still Maintains, But Needs New Momentum
Yesterday’s trading session recorded a D1 candle closing above the Breakout 3363 zone, indicating that buying power in the US session is still dominant. This implies that the uptrend is still being maintained, although the market may need a short-term technical correction.
In today’s Tokyo and London sessions, there is a possibility of liquidity sweeps to the support zone below before Gold recovers and increases again in the New York session.
Important to note:
The uptrend will only be broken if Gold closes below the 3345 zone on the D1 chart.
In this case, the 3320 level will be the next support zone to observe the price reaction and consider buying points.
For the bullish wave to continue expanding towards the historical peak (ATH) at 3500, the market needs stronger supporting factors, which can come from economic data or geopolitical developments.
📌 Support zone: 3345 – 3320
📌 Resistance zone: 3373 – 3418
🎯 Potential buy zone:
3345 (prioritize price reaction in this zone)
3320 (in case of breaking through 3345)
🎯 Target: 3417
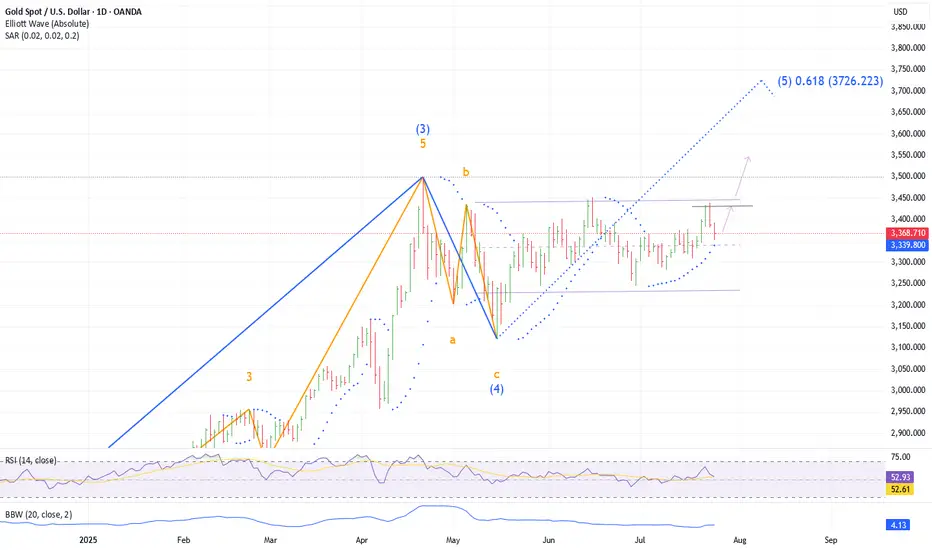
Gold Set to Continue RallyExpect gold to snap back to 3431 and likely much higher in the next day or two. Any recent gold downdraft was quick, prices shooting back up to the highs. Long term trends are too powerful. While Gold could drop down to the 3100 range completing an A-B-C for Wave 4, I think we are already in wave 5. A quick move to 4,000 would stun many but for those who see much much higher prices, 4,000 just might be a level to start getting people's attention.

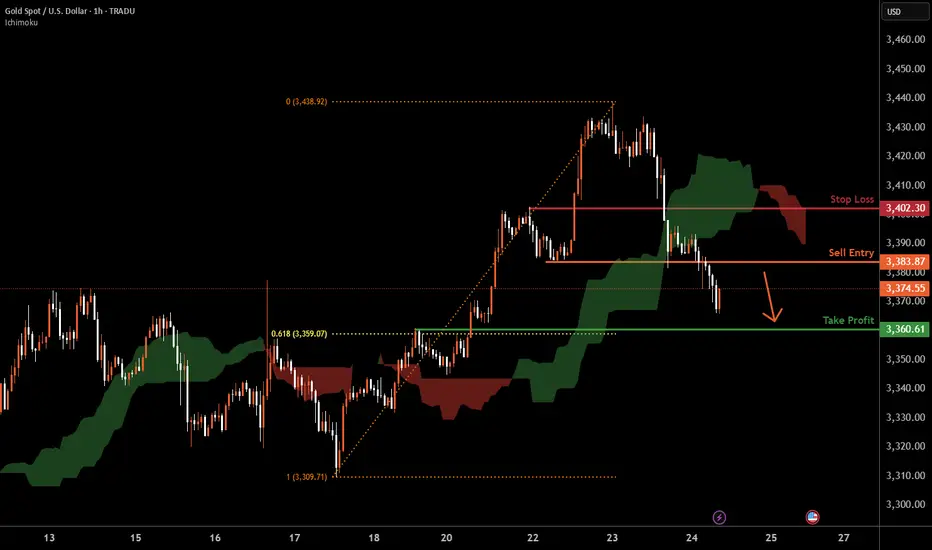
XAUUSD H1 I Bearish Reversal Based on the H1chart, the price is approaching our sell entry level at 3383.87, a pullback resistance.
Our take profit is set at 3360.61, a pullback support that aligns with the 61.8% Fib retracement.
The stop loss is set at 3402.30, a pullback resistance.
High Risk Investment Warning
Trading Forex/CFDs on margin carries a high level of risk and may not be suitable for all investors. Leverage can work against you.
Stratos Markets Limited (tradu.com ):
CFDs are complex instruments and come with a high risk of losing money rapidly due to leverage. 63% of retail investor accounts lose money when trading CFDs with this provider. You should consider whether you understand how CFDs work and whether you can afford to take the high risk of losing your money.
Stratos Europe Ltd (tradu.com ):
CFDs are complex instruments and come with a high risk of losing money rapidly due to leverage. 63% of retail investor accounts lose money when trading CFDs with this provider. You should consider whether you understand how CFDs work and whether you can afford to take the high risk of losing your money.
Stratos Global LLC (tradu.com ):
Losses can exceed deposits.
Please be advised that the information presented on TradingView is provided to Tradu (‘Company’, ‘we’) by a third-party provider (‘TFA Global Pte Ltd’). Please be reminded that you are solely responsible for the trading decisions on your account. There is a very high degree of risk involved in trading. Any information and/or content is intended entirely for research, educational and informational purposes only and does not constitute investment or consultation advice or investment strategy. The information is not tailored to the investment needs of any specific person and therefore does not involve a consideration of any of the investment objectives, financial situation or needs of any viewer that may receive it. Kindly also note that past performance is not a reliable indicator of future results. Actual results may differ materially from those anticipated in forward-looking or past performance statements. We assume no liability as to the accuracy or completeness of any of the information and/or content provided herein and the Company cannot be held responsible for any omission, mistake nor for any loss or damage including without limitation to any loss of profit which may arise from reliance on any information supplied by TFA Global Pte Ltd.
The speaker(s) is neither an employee, agent nor representative of Tradu and is therefore acting independently. The opinions given are their own, constitute general market commentary, and do not constitute the opinion or advice of Tradu or any form of personal or investment advice. Tradu neither endorses nor guarantees offerings of third-party speakers, nor is Tradu responsible for the content, veracity or opinions of third-party speakers, presenters or participants.
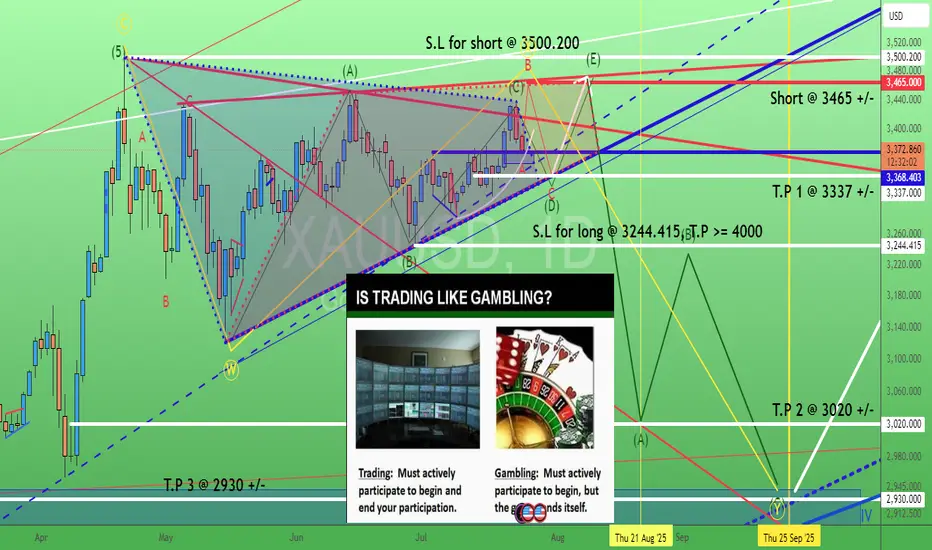
Gold. How to "kill" bull or bear (triangle)? 24/July/25XAUUSD. are you betting (gambling) OR trading for bull/bear triangle? With or without "active lost/cut lost"?.. No stop lost = passive (cut) lost = Let the "gambling" games end for you. Not you end the "trading" any time actively. The "happy ending" always come with good risk management with good risk/reward ratio where ONLY happened when we have T.P and S.L plans.
Gold’s Next Move: Bounce or Breakdown?Gold is pulling back after breaking the 3,360 USD resistance on the 6-hour chart. Price is currently testing the nearest fair value gap (3,370–3,380), but upside momentum is stalling, partly due to unfilled supply zones above.
A retest of the lower FVG near 3,340 will be key. Holding above this level could trigger renewed buying, while a break below may invalidate the bullish structure.
Traders should closely monitor whether downside gaps continue to fill and how price behaves near support zones. Lack of strong liquidity could lead to a false breakout.

Gold Pulls Back to Support Zone📊 Market Overview:
• Gold price fell sharply to $3,385/oz, after previously testing the $3,430 zone.
• Short-term profit-taking and anticipation of upcoming U.S. economic data (PMI, durable goods orders) caused a mild USD rebound, pressuring gold lower.
• Overall sentiment remains cautious as the Fed has yet to clearly signal a rate cut path.
📉 Technical Analysis:
• Key Resistance: $3,430 – $3,445
• Nearest Support: $3,382 – $3,368
• EMA 09: Price just broke below the 9 EMA, suggesting a potential deeper correction unless it rebounds quickly.
• Candlestick/Volume/Momentum: Bearish engulfing candle with rising volume – indicates strong selling pressure and momentum currently favoring the bears.
📌 Outlook:
Gold is undergoing a short-term correction, currently testing the strong technical support zone at $3,382 – $3,385. If this zone holds, we may see a rebound toward $3,410 – $3,420. If it fails, gold could slide further toward $3,368 – $3,350.
💡 Suggested Trade Strategies:
🔻 SELL XAU/USD at: 3,395 – 3,400
🎯 TP: 3,375
❌ SL: 3,405

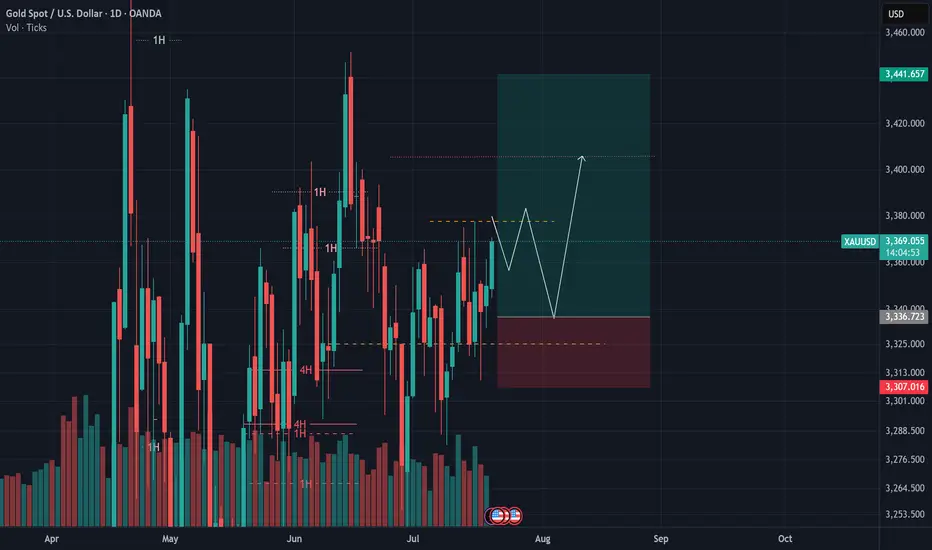
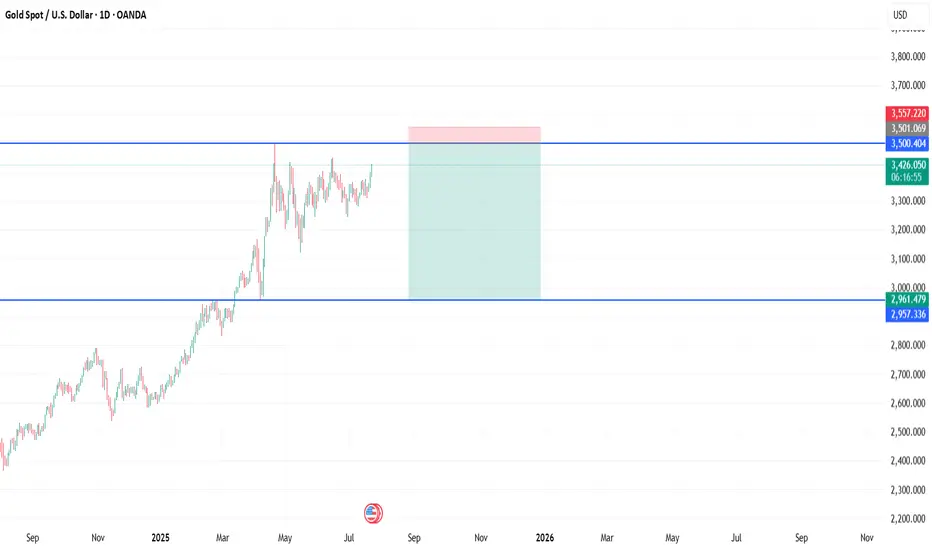
XAU / USD Daily ChartHello traders. I posted a weekly chart last night. Looking at the Daily chart, I have shown my areas of interest to watch. I will post a 4 hour / lower time frame chart in a bit. We have the NY market opening in half an hour. Let's see how things play out. Big G gets my thanks. Be well and trade the trend.

Long towards 3450.00Bullish Rally continues, Expecting it from 3418 area.
This is not a financial advice. Just my trade idea for small 3 positions
XAU / USD 1 Hour ChartHello traders. I am gonna post this quick to get back to the chart. I am looking at trying to ride this push up, but I can also see a pullback as a potential trade as well. Watching the 30 min chart as well. Let's see how things play out. Big G gets my thanks. Be well and trade the trend.
I had to edit this and put that my buy entry was $3407.55 Kaboom.. I have already secured and closed 75% of the trade's profit after 40 pips. My Stop Loss is at my entry point and my runner(the remaining 25% of the trade) is running. All done for the day, just like that.

SellRejection Level
Daily Volume
Market Structure Shift
London Session
Trend Line Break
Untapped Order Point

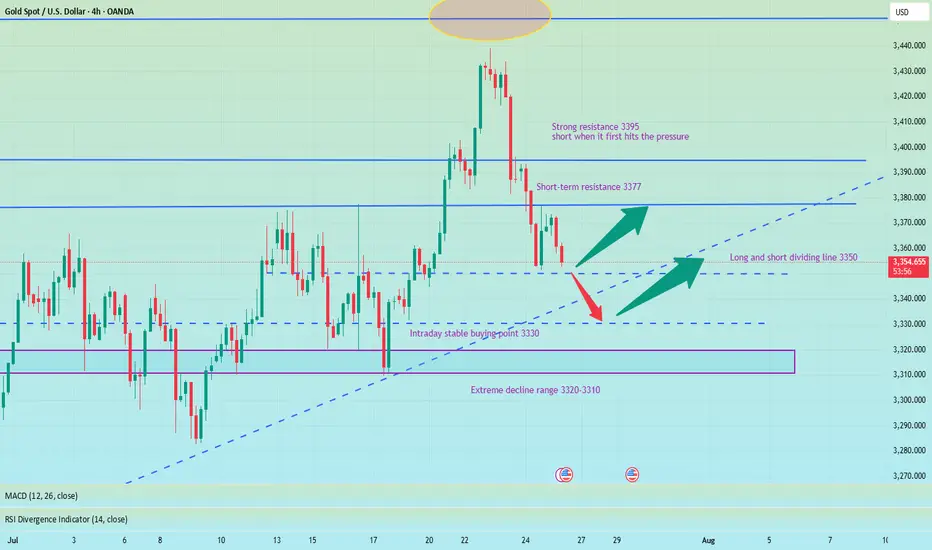
Can gold continue to fall slowly sideways? Focus on the 3375 wat
On Tuesday, spot gold fell back mildly after yesterday's surge. The current gold price is around $3,384/ounce. Spot gold prices surged more than 1% on Monday and hit a five-week high. The main reason was that the US dollar and US bond yields plummeted, and investors were uneasy about the approaching deadline for tariff negotiations on August 1. The market is facing various uncertainties, which does provide support for gold.
Views on today's gold trend!
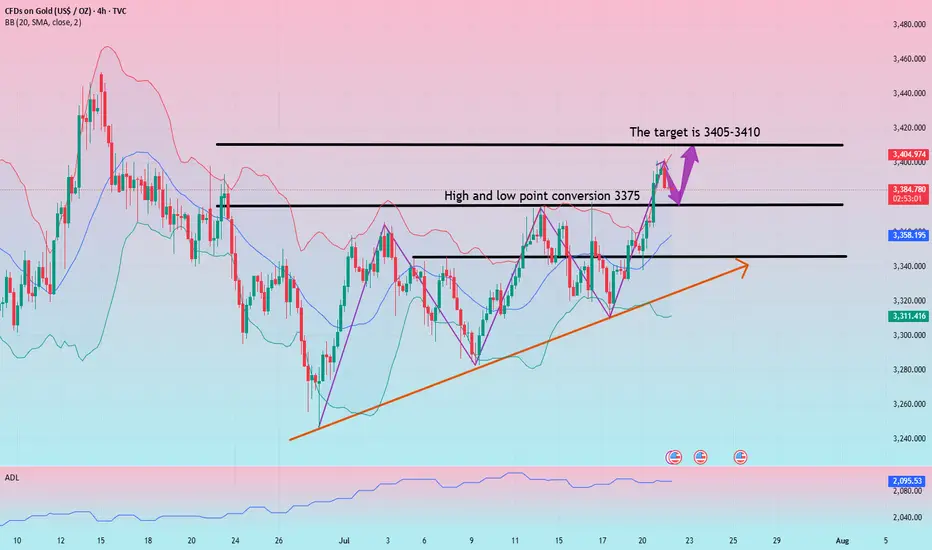
After more than a month of volatile trends, gold once again broke through the integer mark of 3,400 on the first trading day of this week. Under the current bullish sentiment of creating a new high, the previous short-term downward trend ended. From the daily chart, gold is still in an upward trend in the long term. The previous market rebounded effectively after touching the downward trend line, and the rebound force was considerable. With the restart of the bullish force, the main idea can carry the trend and buy on dips.
From the 4-hour chart, the continuous rise of gold and the turning of the moving average have made the market bulls more aggressive, which means that the previous short-term downward trend has ended. At present, a new trend is opening up in the 4-hour chart. The rise of gold has also established an upward trend line. You can consider buying on dips against the 3375 watershed.
Gold: Buy near 3375, defend 65, and target 3405-3410!
XAUUSD H1 I Bearish Reversal Based on the H1 chart analysis, we can see that the price is testing our sell entry at 3392.84, which is a pullback resistance.
Our take profit will be at 3377.57, a pullback support level.
The stop loss will be placed at 3411.50, which is a swing high resistance level.
High Risk Investment Warning
Trading Forex/CFDs on margin carries a high level of risk and may not be suitable for all investors. Leverage can work against you.
Stratos Markets Limited (tradu.com ):
CFDs are complex instruments and come with a high risk of losing money rapidly due to leverage. 66% of retail investor accounts lose money when trading CFDs with this provider. You should consider whether you understand how CFDs work and whether you can afford to take the high risk of losing your money.
Stratos Europe Ltd (tradu.com ):
CFDs are complex instruments and come with a high risk of losing money rapidly due to leverage. 66% of retail investor accounts lose money when trading CFDs with this provider. You should consider whether you understand how CFDs work and whether you can afford to take the high risk of losing your money.
Stratos Global LLC (tradu.com ):
Losses can exceed deposits.
Please be advised that the information presented on TradingView is provided to Tradu (‘Company’, ‘we’) by a third-party provider (‘TFA Global Pte Ltd’). Please be reminded that you are solely responsible for the trading decisions on your account. There is a very high degree of risk involved in trading. Any information and/or content is intended entirely for research, educational and informational purposes only and does not constitute investment or consultation advice or investment strategy. The information is not tailored to the investment needs of any specific person and therefore does not involve a consideration of any of the investment objectives, financial situation or needs of any viewer that may receive it. Kindly also note that past performance is not a reliable indicator of future results. Actual results may differ materially from those anticipated in forward-looking or past performance statements. We assume no liability as to the accuracy or completeness of any of the information and/or content provided herein and the Company cannot be held responsible for any omission, mistake nor for any loss or damage including without limitation to any loss of profit which may arise from reliance on any information supplied by TFA Global Pte Ltd.
The speaker(s) is neither an employee, agent nor representative of Tradu and is therefore acting independently. The opinions given are their own, constitute general market commentary, and do not constitute the opinion or advice of Tradu or any form of personal or investment advice. Tradu neither endorses nor guarantees offerings of third-party speakers, nor is Tradu responsible for the content, veracity or opinions of third-party speakers, presenters or participants.

Gold (XAU/USD) Bullish Outlook Based on Price ActionGold (XAU/USD)**, showing a bullish outlook based on price action and support zones.
**Chart Analysis:**
* **Current Price:** \$3,359
* **EMA Signals:**
* EMA 7: \$3,353
* EMA 21: \$3,345
* EMA 50: \$3,341
**Bullish EMA alignment** (short EMAs above long) signals upward momentum.
* **Support Zones:**
* **S1**: \~\$3,345 (strong short-term demand area)
* **S2**: \~\$3,325 (deeper support zone)
* **Volume:** Spikes in green bars signal strong buyer interest near support, especially during the bounce.
* **Projected Move (Green Arrow):**
* A potential retest of the breakout zone (\~\$3,350) could happen before gold targets the **next key resistance** near **\$3,410**.
**Summary:**
Gold broke above a consolidation range supported by EMA alignment and strong volume. As long as the price stays above S1 (\$3,345), the trend remains bullish with upside potential toward \$3,400–\$3,410. A pullback may occur first, offering re-entry opportunities.

XAUUSD SELL OR TRAP (READ CAPTION)Hi trader's. what do you think about gold
current price: 3331
gold is working in bullish Parrallal channel under gold retest is down side 3320 and 3307 this is support market respect this zone and reject support and and h1 candle close in bullish so possible gold pump upside
support zone: 3320:3307
resistance zone :3345
supply 3374
please like comment and follow thank you

Gold Analysis – July 20, 2025In our previous updates, we highlighted the 3350–3360 zone as a critical resistance that could trigger a pullback toward the 3200 level.
📉 Over the past week, price tested this zone multiple times, and each time we saw a sharp rejection of 400–500 pips.
This behavior clearly indicates that liquidity has been absorbed in this area, and short sellers have likely hit their targets.
📈 Now, the market dynamics are shifting.
With sellers exiting and the zone losing its bearish pressure, we could be looking at the beginning of a new bullish leg. The first key resistance on the upside is 3400.
⚠️ However, considering the number of high-impact events expected this week, I personally prefer to wait for a low-risk entry closer to 3320–3330 rather than chasing the move early.
Stay alert — this week could bring high volatility and major trend moves.