Fibonacci Retracement: The Hidden Key to Better EntriesIf you’ve ever wondered how professional traders predict where price might pull back before continuing... the secret lies in Fibonacci Retracement.
In this post, you’ll learn:
What Fibonacci retracement is
Why it works
How to use it on your charts (step-by-step)
Pro tips to increase accuracy in the market
🧠 What Is Fibonacci Retracement?:
Fibonacci Retracement is a technical analysis tool that helps traders identify potential support or resistance zones where price is likely to pause or reverse during a pullback.
It’s based on a mathematical sequence called the Fibonacci Sequence, found everywhere in nature — from galaxies to sunflowers — and yes, even in the markets.
The Fibonacci sequence is a series of numbers where each number is the sum of the two preceding ones, starting with 0 and 1. The sequence typically begins with 0, 1, 1, 2, 3, 5, 8, 13, and so on. This pattern can be expressed as a formula: F(n) = F(n-1) + F(n-2), where F(n) is the nth Fibonacci number.
The key Fibonacci levels traders use are:
23.6%
38.2%
50%
61.8%
78.6%
These levels represent percentages of a previous price move, and they give us reference points for where price might pull back before resuming its trend and where we can anticipate price to move before showing support or resistance to the trend you are following.
💡Breakdown of Each Fib Level:
💎 0.236 (23.6%) – Shallow Pullback
What it indicates:
Weak retracement, often signals strong trend momentum.
Buyers/sellers are aggressively holding the trend.
Best action:
Aggressive entry zone for continuation traders.
Look for momentum signals (break of minor structure, bullish/bearish candles). Stay out of the market until you see more confirmation.
💎 0.382 (38.2%) – First Strong Area of Interest
What it indicates:
Healthy pullback in a trending market.
Seen as a key area for trend followers to step in.
Best action:
Look for entry confirmation: bullish/bearish engulfing, pin bars, Elliott Waves, or break/retest setups.
Ideal for setting up trend continuation trades.
Stop Loss 0.618 Level
💎 0.500 (50.0%) – Neutral Ground
What it indicates:
Often marks the midpoint of a significant price move.
Market is undecided, can go either way.
Best action:
Wait for additional confirmation before entering.
Combine with support/resistance or a confluence zone.
Useful for re-entry on strong trends with good risk/reward.
Stop Loss 1.1 Fib Levels
💎 0.618 (61.8%) – The “Golden Ratio”
What it indicates:
Deep pullback, often seen as the last line of defense before trend reversal.
High-probability area for big players to enter or add to positions.
Best action:
Look for strong reversal patterns (double bottoms/tops, engulfing candles).
Excellent area for entering swing trades with tight risk and high reward.
Use confluence (structure zones, moving averages, psychological levels, Elliott Waves).
Wait for close above or below depending on the momentum of the market.
Stop Loss 1.1 Fib Level
💎 0.786 (78.6%) – Deep Correction Zone
What it indicates:
Very deep retracement. Often a final “trap” zone before price reverses.
Risk of trend failure is higher.
Best action:
Only trade if there's strong reversal evidence.
Use smaller position size or avoid unless other confluences are aligned.
Can act as an entry for counter-trend trades in weaker markets.
Stop Loss around 1.1 and 1.2 Fib Levels
⏱️Best Timeframe to Use Fibs for Day Traders and Swing Traders:
Day trading:
Day traders, focused on capturing short-term price movements and making quick decisions within a single day, typically utilize shorter timeframes for Fibonacci retracement analysis, such as 15-minute through hourly charts.
They may also use tighter Fibonacci levels (like 23.6%, 38.2%, and 50%) to identify more frequent signals and exploit short-term fluctuations.
Combining Fibonacci levels with other indicators such as moving averages, RSI, or MACD, and focusing on shorter timeframes (e.g., 5-minute or 15-minute charts) can enhance signal confirmation for day traders.
However, relying on very short timeframes for Fibonacci can lead to less reliable retracement levels due to increased volatility and potential for false signals.
Swing trading:
Swing traders aim to capture intermediate trends, which necessitates giving trades more room to fluctuate over several days or weeks.
They typically prefer utilizing broader Fibonacci levels (like 38.2%, 50%, and 61.8%) to identify significant retracement points for entering and exiting trades.
Swing traders often focus on 4-hour and daily charts for their analysis, and may even consult weekly charts for a broader market perspective.
🎯 Why Does Fibonacci Work?:
Fibonacci levels work because of:
Mass psychology – many traders use them
Natural rhythm – markets move in waves, not straight lines
Institutional footprint – smart money often scales in around key retracement zones
It's not magic — it's structure, and it's surprisingly reliable when used correctly.
🛠 How to Draw Fibonacci Retracement (Step-by-Step):
Let’s say you want to trade XAU/USD (Gold), and price just had a strong bullish run.
✏️ Follow These Steps:
Identify the swing low (start of move)
Identify the swing high (end of move)
Use your Fibonacci tool to draw from low to high (for a bullish move)
The tool will automatically mark levels like 38.2%, 50%, 61.8%, etc.
These levels act as pullback zones, and your job is to look for entry confirmation around them.
🔁 For bearish moves, draw from high to low. (I will show a bearish example later)
Now let’s throw some examples and pictures into play to get a better understanding.
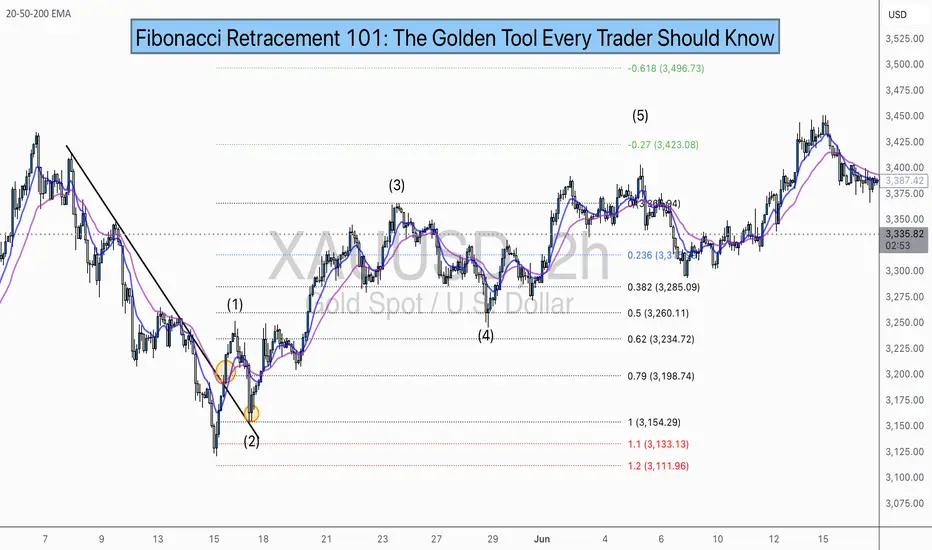
📈 XAU/USD BULLISH Example:
1.First we Identify the direction of the market:
2.Now we set our fibs by looking for confirmations to get possible entry point:
Lets zoom in a bit:
Now that we have a break of the trendline we wait for confirmation and look for confluence:
Now we set our fibs from the last low to the last high:
This will act as our entry point for the trade.
3. Now we can look for our stop loss and take profit levels:
Stop Loss:
For the stop loss I like to use the fib levels 1.1 and 1.2 when I make an entry based upon the 0.618 level. These levels to me typically indicate that the trade idea is invalid once crossed because it will usually violate the prior confirmations
Take Profit:
For the take profit I like to use the Fib levels 0.236, 0, -0.27, and -0.618. This is based upon your personal risk tolerance and overall analysis. You can use 0.236 and 0 level as areas to take partial profits.
Re-Entry Point Using Elliott Waves as Confluence Example:
This is an example of how I used Elliott Waves to enter the trade again from the prior entry point. If you don’t know what Elliott Waves are I will link my other educational post so you can read up on it and have a better understanding my explanation to follow.
After seeing all of our prior confirmations I am now confident that our trend is still strongly bullish so I will mark my Waves and look for an entry point.
As we can see price dipped into the 0.38-0.5 Fib level and rejected it nicely which is also in confluence with the Elliott Wave Theory for the creation of wave 5 which is the last impulse leg before correction.
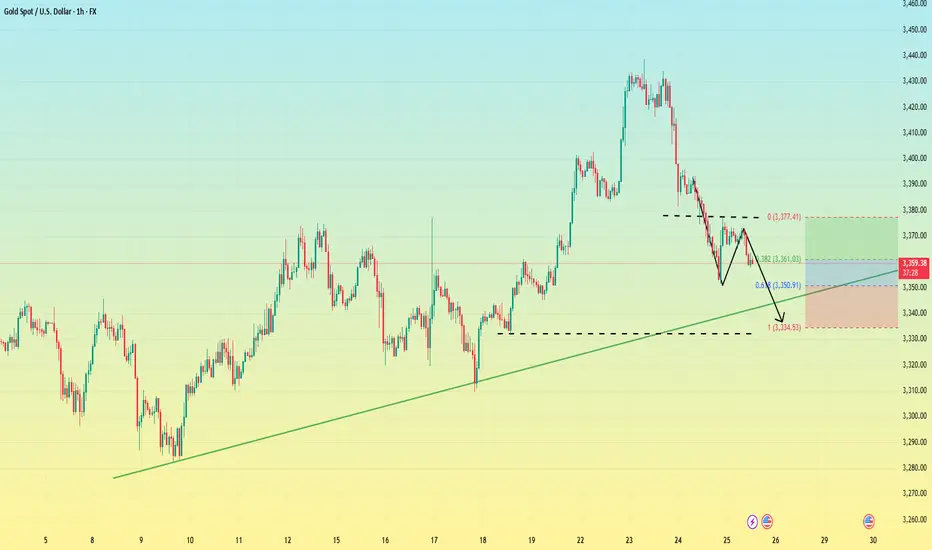
🔻 In a downtrend:
Same steps, but reverse the direction — draw from high to low and look to short the pullback.
XAU/USD Example:
As you can see the same basic principles applied for bearish movement as well.
⚠️ Pro Tips for Accuracy:
✅ Always use Fib in confluence with:
Market structure (higher highs/lows or lower highs/lows)
Key support/resistance zones
Volume or momentum indicators
Candle Patterns
Elliott Waves, etc.
❌ Don’t trade Fib levels blindly — they are zones, not guarantees.
📊 Use higher timeframes for cleaner levels (4H, Daily)
💡 Final Thought
Fibonacci retracement doesn’t predict the future — it reveals probability zones where price is likely to react.
When combined with structure and confirmation, it becomes one of the most reliable tools for new and experienced traders alike.
🔥 Drop a comment if this helped — or if you want a Part 2 where I break down Fibonacci Extensions and how to use them for take-profit targets.
💬 Tag or share with a beginner who needs to see this!
XAUUSDK trade ideas
XAU/USD (Gold) Key Technical Levels:🔍 Key Technical Levels:
🔼 Resistance Zones:
3365 – 3368: Strong supply zone, price has reacted here multiple times.
3377 – 3380: Next resistance zone with past price rejections.
3393 – 3404: High-level resistance, potential breakout target.
3410: Upper extreme resistance level (major target zone).
🔽 Support Zones:
3337 – 3333: Key support zone aligned with the 50.60% Fibonacci retracement level.
3309: 4-hour support level.
3283 – 3290: Strong demand zone (marked in green).
📈 Bullish Scenario:
If price retraces to 3333 – 3337 and holds:
Potential bounce upward toward:
3365 → 3377 → 3393 → 3404
Look for bullish confirmation (e.g., bullish engulfing, strong volume, or break above local highs).
📉 Bearish Scenario:
If price breaks below 3333 with strong bearish momentum:
Downward targets become:
3309 → 3283
Look for rejection at resistance zones or bearish structure before entering short trades.
⚖️ Neutral / Consolidation Possibility:
Market may range between 3333 – 3365 before a breakout.
Upcoming economic news or events (like those marked on the chart calendar) could act as a trigger.
🔔 Trade Setup Ideas:
Buy Entry: Near 3333 – 3337 with bullish confirmation.
Sell Entry: Below 3333 if price breaks down with strong volume.
Take Profits: At the next resistance levels (3365, 3377, 3393...).
Stop Loss: Slightly below support for longs / above resistance for shorts.
Let me know if you'd like a trading plan, alert script, or breakdown of upcoming fundamental events for Gold.

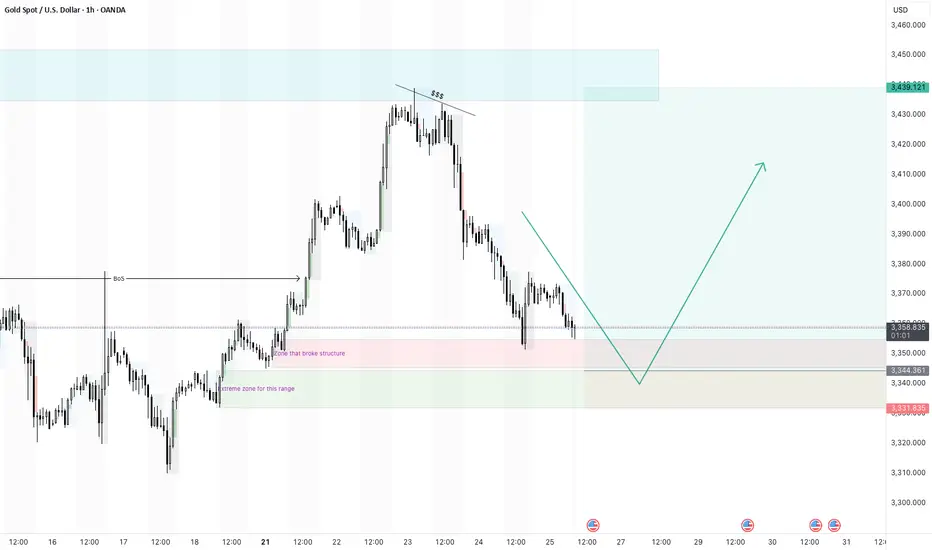
XAUUSD continuation of larger bullish move - 25/7/25Gold did touch the higher timeframe supply zone and pull back. It is now at a point where i am looking for a pivot to form to continue bullish.
I did place a buy limit trade at the extreme zone that started the break of structures.
i will wait a see if it drops and triggers or forms a pivot at the 4H zone that broke structure.

Gold is weak. Beware of lows.On Thursday, the dollar index ended a four-day losing streak thanks to the progress of the fund between the United States and its trading partners.
As signs of easing global trade tensions curbed demand for safe-haven assets, gold fell for the second consecutive trading day, and yesterday it hit the 3350 bottom support level.
From the 4-hour chart
although it rebounded to the 3370-3380 range after hitting 3350. But it can be found that the current rebound is actually weak, and it is still maintained at 3360-70 for rectification. At present, the bottom of the 4-hour bottom is absolutely supported at 3340-3335. The rebound high is around 3375. As of now, gold has not rebounded above 3375, and gold is actually in a weak position.
Secondly, from the hourly chart, the weakness is even more obvious. The high point on Thursday was around 3395. Today's current high point is around 3375. It can be seen that if the bottom falls below the 618 position 3350 again, it will directly touch around 3335. It coincides with the target position of 3340-3335 in the previous 4-hour chart.
Therefore, it is not possible to buy the bottom and go long today. Be alert to the possibility of further touching 3340-3335.
Gold forming triangle patterenGold is currently consolidating within a symmetrical triangle pattern, signaling a potential breakout setup as price coils tighter between converging support and resistance trendlines.
CMP: Around $ 3370 (adjust based on your exact chart)
Lower highs & higher lows = compression zone
Volume declining, typical before breakout
Break above upper trendline could signal continuation toward 4000
Break support may lead to retest of $2985
This setup reflects indecision in the market — waiting for a decisive breakout with volume to confirm direction.

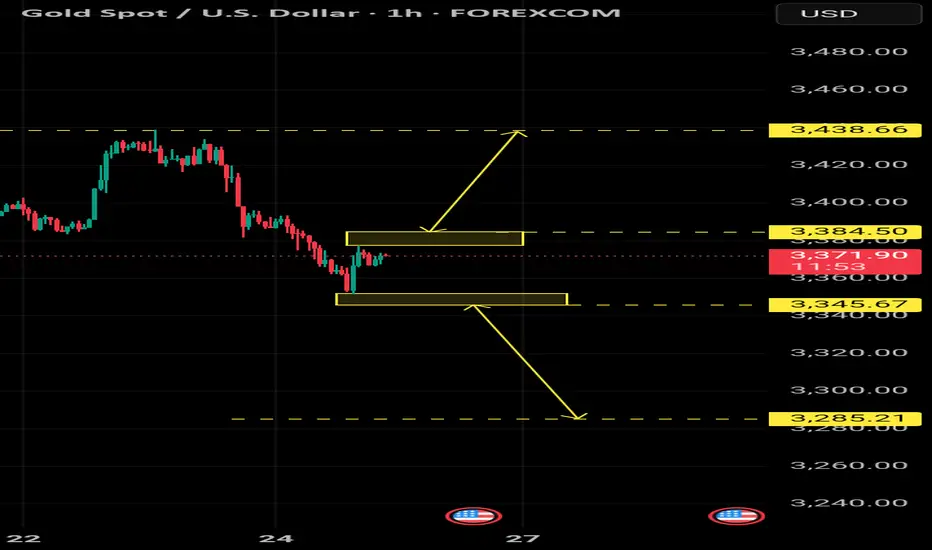
Quick Gold AnalysisYellow areas are important in case of a breakout.
Break the upper area, targeting the last weekly high.
Break down, targeting the level shown on the chart.
Gold Trading Strategy | July 24-25✅ Fundamental Analysis
🔹 Diminishing Safe-Haven Demand: The reduction of U.S.–Japan auto tariffs to 15% and progress in U.S.–EU tariff negotiations have weakened gold’s appeal as a safe-haven asset. Risk-on sentiment has led to capital flowing into risk assets, squeezing safe-haven positions.
🔹 Speculative Positioning Adjustment: COMEX gold net non-commercial long positions have remained above 200,000 contracts for three consecutive weeks. The crowding level of leveraged positions has reached the 82nd percentile, increasing the likelihood of technical profit-taking, thereby adding to market volatility.
🔹 Long-Term Supportive Factors: Ongoing central bank gold purchases and U.S. dollar credit concerns (e.g., political pressure on the Fed by Trump) may limit the downside potential in gold prices.
✅ Technical Analysis
🔸 After failing to break higher, gold has pulled back toward the lower boundary of its trading range, and short-term weakness is gradually emerging. On the daily chart, the 5-day moving average ($3385) has crossed below the 10-day moving average, forming a bearish crossover, indicating weakening short-term momentum.
However, medium- and long-term moving averages remain in a bullish alignment, suggesting that the broader trend is still intact.
🔸 MACD: A bearish crossover has formed above the zero line, with increasing red bars on the histogram, signaling that the correction may not be over.
RSI: Currently at 52, within the neutral zone—no oversold signal yet, implying further downside room.
Bollinger Bands: Price remains above the middle band (approx. $3340), but the narrowing band width suggests a potential breakout is approaching.
🔴 Resistance Levels: 3375–3380 / 3397–3403
🟢 Support Levels: 3350–3355 / 3335–3340
✅ Trading Strategy Reference:
🔻 Short Position Strategy:
🔰Consider entering short positions in batches if gold rebounds to the 3375-3380 area. Target: 3360-3350;If support breaks, the move may extend to 3340.
🔺 Long Position Strategy:
🔰Consider entering long positions in batches if gold pulls back to the 3335-3340 area. Target: 3360-3370;If resistance breaks, the move may extend to 3380.
🔥Trading Reminder: Trading strategies are time-sensitive, and market conditions can change rapidly. Please adjust your trading plan based on real-time market conditions. If you have any questions or need one-on-one guidance, feel free to contact me🤝

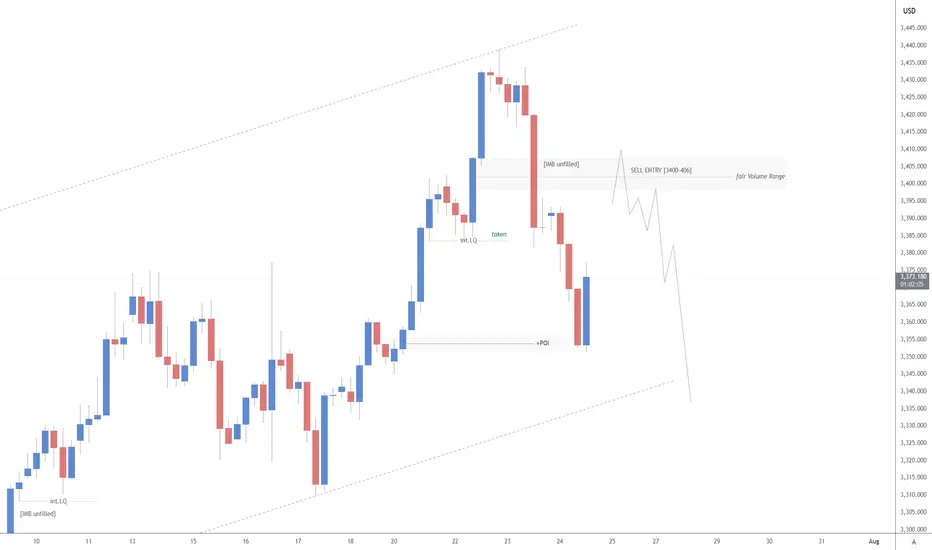
XAUUSD H4 | SELL 💡Why Gold Pulled Back
- Gold pulled back today after hitting $3439.04, just below resistance at $3451.53. Traders took profits ahead of key Fed and trade headlines. Right now, it’s trading around $3414.48, down 0.50%.
- The dip came after the U.S.-Japan trade deal eased geopolitical tension, cutting safe-haven demand. Plus, U.S. bond yields are climbing (10-year at 4.384%), which adds pressure on gold.
Support is building at $3374.42, with stronger buying interest expected around $3347.97 and the 50-day moving average at $3336.40 — a key level bulls want to defend.
Short-term looks a bit weak, but as long as gold holds above the 50-day MA, the bullish trend remains intact. Longer-term, weakness in the dollar, central bank gold buying, and concerns about Fed independence could push prices higher.
🔍Watching the Fed’s July 29–30 meeting next
GOLD: Target Is Down! Short!
My dear friends,
Today we will analyse GOLD together☺️
The recent price action suggests a shift in mid-term momentum. A break below the current local range around 3,359.59 will confirm the new direction downwards with the target being the next key level of 3,350.22.and a reconvened placement of a stop-loss beyond the range.
❤️Sending you lots of Love and Hugs❤️

Xau/Usd - Gold turn to Bull runGold time to Long..
buy 3364
SL 3361
TP 3377
Xau/Usd Bull Run started

XAUUSD Top-down analysis Hello traders, this is a complete multiple timeframe analysis of this pair. We see could find significant trading opportunities as per analysis upon price action confirmation we may take this trade. Smash the like button if you find value in this analysis and drop a comment if you have any questions or let me know which pair to cover in my next analysis.

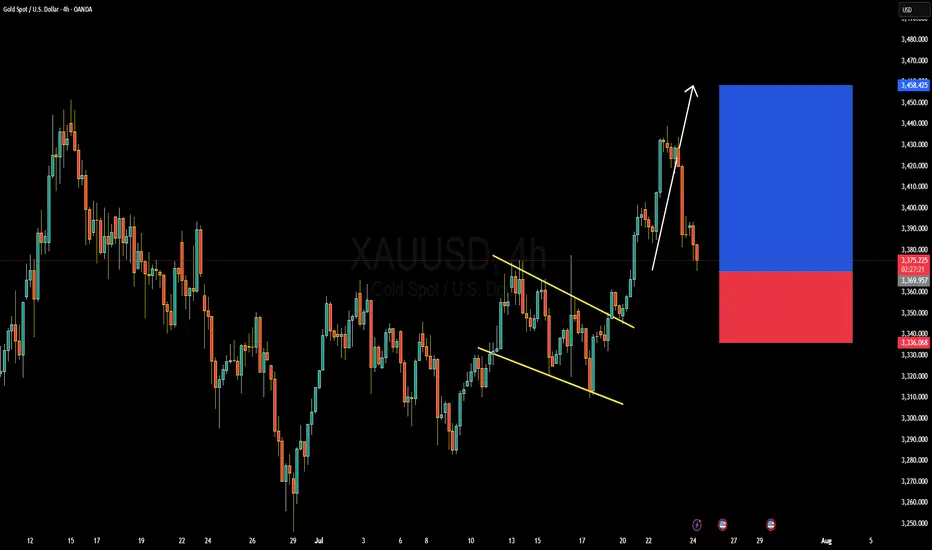
GOLD (XAUUSD) Forming Bullish ContinuationGold (XAUUSD) is currently presenting a strong bullish continuation setup after breaking out of a falling channel on the 4H timeframe. Price action confirmed bullish momentum with impulsive candles following the breakout, and we’re now seeing a textbook retest of the breakout zone around 3,370–3,360, which previously acted as resistance and is now expected to hold as support. The risk-to-reward ratio remains highly favorable, targeting the 3,450–3,460 zone in the upcoming sessions.
From a macro perspective, gold is gaining upside traction as the US dollar weakens amid growing speculation around an upcoming Fed rate cut. Investors are rotating into safe-haven assets as recession concerns resurface, with the market pricing in increased geopolitical tension and slower economic growth forecasts. Real yields are cooling, which typically boosts non-yielding assets like gold. With central bank demand for gold also staying strong, the bullish narrative continues to build.
Technically, momentum remains in the bulls’ favor. RSI is still holding above midline levels, suggesting there’s room for further upside. The current pullback offers a healthy correction within a larger bullish trend. Holding above the 3,360–3,340 support range is key for continuation; a daily close above 3,390 would confirm the next wave toward 3,450 and possibly 3,500 in the medium term.
This is a clear case of momentum following structure. As long as the lower boundary holds firm, I remain bullish on gold with strong conviction. Watch for volume confirmation on the bounce, and trade the trend—momentum is with the buyers.
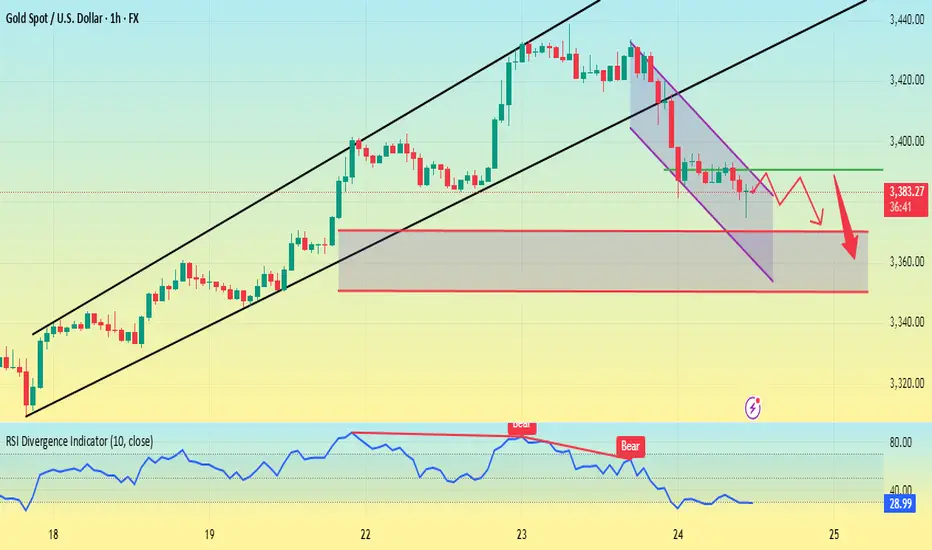
Gold peaked in the short term. Welcome a new trend?The previous rising structure of gold was broken, especially yesterday's rapid decline broke through the previous support of 3385. Although it rebounded slightly, it was difficult to change the adjustment. Yesterday's high point of the US market was at 3396-98 US dollars. Today, the adjustment trend continued. The dividing point between long and short is 3395 US dollars today. Before the price reaches here, do not consider long.
Many traders are confused. Why are there longs one day and shorts the next day? In fact, this is the characteristic of the volatile market. Breaking the key position cannot last. No matter what you think about the market, you must pay attention to the current shape changes. In the volatile market, you should consider the market of the day more, not the long-term direction.
From the 1-hour chart, the gold price rebounded near 3390 and shorted, and the profit range is 3370-3350.
The backup strategy is to break through 3400 and go long, and pay attention to 3415-3425 on the upside.
In other words, look for opportunities to short on a rebound below 3400 today, and adjust your thinking after breaking through the key resistance.
XAUUSDXAUUSD Updated in 15M :
The gold signal is marked on the chart based on the latest price changes and the supply and demand in the market. These points include the entry point, stop loss, and take profit

XAUUSD: Mid-Term Analysis🪙 XAUUSD Analysis
You don’t need to guess. You can join from the blue box or the movement I’ve drawn on the chart.
📈 Context (The Story)
Treasury yields just fell for the 5th session, boosting the bullish case for XAUUSD as investors look for safety and positioning ahead of next week’s Fed meeting.
🚦 The Plan
✅ If price returns to the blue box, I will look for:
Footprint absorption (buyers defending the level)
CDV support or divergence
Structure reclaim to confirm entry
✅ If momentum continues along the drawn movement, I will join with risk-managed entries on clear reclaim setups.
⚡ Why It Matters
“People don’t like to be sold, but they love to buy.” – Jeffrey Gitomer
Today’s bullish backdrop is clear, but you only benefit if you enter with clarity, not FOMO.
🎯 Action Point
No predictions. No chasing. Let the setup align with:
Today’s bullish news as a backdrop
Technical confirmation in the blue box or reclaim areas
If it aligns, execute decisively with clear risk. If not, let it go.
The market rewards those who wait for the right price and the right moment. This may be that moment if the setup confirms.
📌I keep my charts clean and simple because I believe clarity leads to better decisions.
📌My approach is built on years of experience and a solid track record. I don’t claim to know it all but I’m confident in my ability to spot high-probability setups.
📌If you would like to learn how to use the heatmap, cumulative volume delta and volume footprint techniques that I use below to determine very accurate demand regions, you can send me a private message. I help anyone who wants it completely free of charge.
🔑I have a long list of my proven technique below:
🎯 ZENUSDT.P: Patience & Profitability | %230 Reaction from the Sniper Entry
🐶 DOGEUSDT.P: Next Move
🎨 RENDERUSDT.P: Opportunity of the Month
💎 ETHUSDT.P: Where to Retrace
🟢 BNBUSDT.P: Potential Surge
📊 BTC Dominance: Reaction Zone
🌊 WAVESUSDT.P: Demand Zone Potential
🟣 UNIUSDT.P: Long-Term Trade
🔵 XRPUSDT.P: Entry Zones
🔗 LINKUSDT.P: Follow The River
📈 BTCUSDT.P: Two Key Demand Zones
🟩 POLUSDT: Bullish Momentum
🌟 PENDLEUSDT.P: Where Opportunity Meets Precision
🔥 BTCUSDT.P: Liquidation of Highly Leveraged Longs
🌊 SOLUSDT.P: SOL's Dip - Your Opportunity
🐸 1000PEPEUSDT.P: Prime Bounce Zone Unlocked
🚀 ETHUSDT.P: Set to Explode - Don't Miss This Game Changer
🤖 IQUSDT: Smart Plan
⚡️ PONDUSDT: A Trade Not Taken Is Better Than a Losing One
💼 STMXUSDT: 2 Buying Areas
🐢 TURBOUSDT: Buy Zones and Buyer Presence
🌍 ICPUSDT.P: Massive Upside Potential | Check the Trade Update For Seeing Results
🟠 IDEXUSDT: Spot Buy Area | %26 Profit if You Trade with MSB
📌 USUALUSDT: Buyers Are Active + %70 Profit in Total
🌟 FORTHUSDT: Sniper Entry +%26 Reaction
🐳 QKCUSDT: Sniper Entry +%57 Reaction
📊 BTC.D: Retest of Key Area Highly Likely
📊 XNOUSDT %80 Reaction with a Simple Blue Box!
📊 BELUSDT Amazing %120 Reaction!
📊 Simple Red Box, Extraordinary Results
📊 TIAUSDT | Still No Buyers—Maintaining a Bearish Outlook
📊 OGNUSDT | One of Today’s Highest Volume Gainers – +32.44%
📊 TRXUSDT - I Do My Thing Again
📊 FLOKIUSDT - +%100 From Blue Box!
📊 SFP/USDT - Perfect Entry %80 Profit!
📊 AAVEUSDT - WE DID IT AGAIN!
I stopped adding to the list because it's kinda tiring to add 5-10 charts in every move but you can check my profile and see that it goes on..

Gold 1H Intra-Day Chart 22.07.2025Option 1: Gold rejects from CMP & drops towards $3,260.
Option 2: Gold buyers hold around $3,260 and push price back up.
Which scenario do you find more likely?

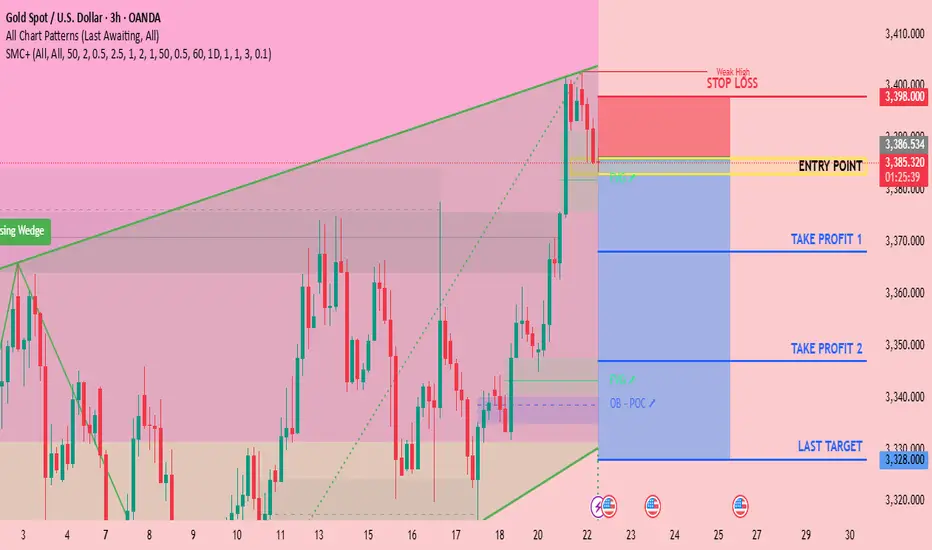
CHECK XAUUSD SIGNAL READ THE CAPTAINEntry Point: Around 3386 3382
Stop Loss: Around 3328
🎯 Target Levels
Take Profit 1:
3368
Take Profit 2:
3347
last target
3328
XU price touch the resistance level of the symmetrical triangle Price just approached the resistance level of symmetrical triangle that’s currently forming on the daily timeframe. We’re yet to ascertain the next possible direction of price from the daily timeframe but for the meantime, I’d expect a correction in price. Therefore I’d be expecting price to drop in correction of the already made impulse move

Today's GOLD Analysis – Structural Breakout and Bullish Setup🔷 1. Descending Channel – End of Bearish Phase
The chart initially shows Gold trading inside a well-defined descending channel, where price was consistently respecting both upper and lower trendlines. This movement reflected short-term bearish pressure, likely driven by fundamental uncertainty and lower time frame liquidity grabs.
However, the price broke above the channel with a strong bullish candle, which is a clear sign of momentum shift. Breakouts like these usually signify the end of a corrective phase and the beginning of a trend reversal or impulsive leg.
🔷 2. Minor Break of Structure (BOS) – First Confirmation
Following the channel breakout, price broke through a minor structure zone around 3,345–3,350, confirming a short-term change in market direction. This zone, previously acting as resistance, is now functioning as support (noted as “Minor SR - Interchange” on the chart).
This BOS is important because it represents the first break of a lower high in the previous downtrend, which is an early sign that buyers are stepping in with strength.
🔷 3. Retest and Clean Reaction – Support Validated
After breaking structure, the market retraced back into the broken zone, validating it as new support. This is a classic market behavior where price retests previous resistance to gather liquidity before moving higher — a key concept in Smart Money Concepts (SMC).
The bullish rejection from this zone further confirms the validity of the breakout and indicates that institutional buyers may be active in this region.
🔷 4. Current Price Action – Building Momentum
Price is now hovering near 3,355, building bullish structure with a series of higher highs and higher lows. This setup aligns with a continuation move toward the next liquidity target or resistance zone, which is:
✅ Reversal Zone: 3,375–3,380
This zone is marked as the next high-probability area where price might:
Face short-term resistance
Grab liquidity above previous highs
Possibly react with a pullback
The highlighted reversal zone (target: 3,378.23) is crucial because:
It aligns with previous supply
It could act as a decision point for larger time frame traders
It’s where a Major Break of Structure might occur if price breaks and holds above it
🔷 5. Projection & Scenario Planning
Here’s how the next move could play out:
Bullish Scenario: If price maintains support above the 3,350 zone, a rally toward 3,378 is expected. A strong close above this level would shift the larger structure bullish, confirming a major trend reversal.
Bearish Scenario (Short-Term): If price fails to break 3,378, we could see a pullback into the 3,345–3,350 area again. However, as long as this support holds, the bullish bias remains intact.
🔐 Key Technical Concepts Used:
Channel Breakout
Minor BOS & SR Flip
Liquidity Sweep
Reversal Zone (Supply Area)
Trend Structure Shift
📌 Conclusion:
Gold has broken out of its bearish channel and confirmed a short-term bullish structure. The recent breakout and retest give buyers a strong foundation to push toward the 3,378 zone. This is the key reversal area, and the reaction from here will define whether Gold continues to rally or faces a temporary pullback. For now, bulls are in control, and the market structure supports a continuation move.

Elliott Wave Analysis – XAUUSD | July 21, 2025
🔍 Momentum Analysis
- D1 Timeframe: Momentum is currently rising → the dominant trend over the next 3 days is likely to remain bullish.
- H4 Timeframe: Momentum is approaching the oversold area → just one more bearish H4 candle could complete the entry into oversold territory.
- H1 Timeframe: Momentum is about to reverse downward → suggesting a short-term corrective pullback in the current session.
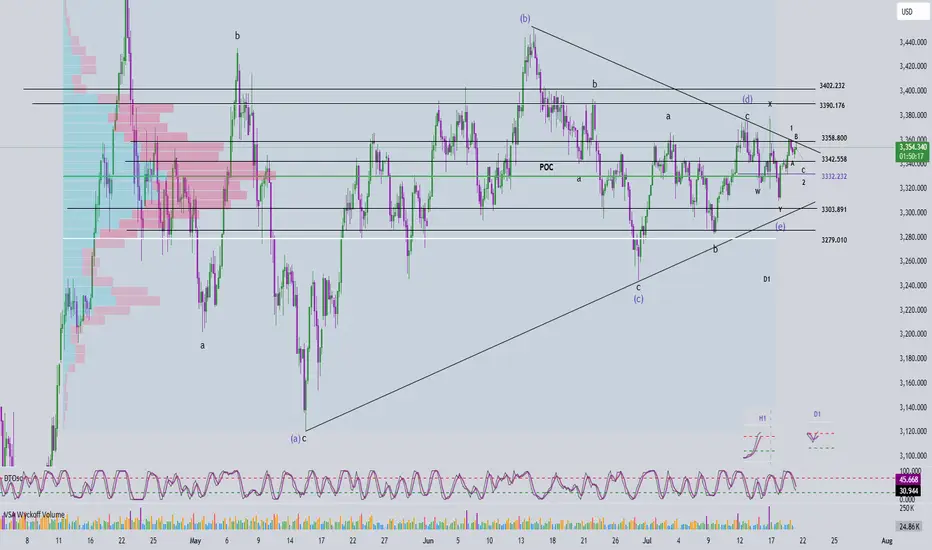
🌀 Elliott Wave Structure Update
On the H4 chart, price continues to consolidate within a corrective triangle structure. According to our previous plan, price approached the 3358 zone, and we expect:
- Wave 1 (black) may have completed at the 3358 high.
- Currently, Wave 2 (black) is likely unfolding:
+ Wave A appears to have completed.
+ The current upward leg is part of Wave B.
+ A final drop in Wave C is expected, with two key target zones:
- Target 1: 3342
- Target 2: 3332
🔎 Combining Momentum & Wave Structure
- If price breaks above 3358, we want to see a sharp, impulsive, and steep rally to confirm the beginning of Wave 3.
- If price movement remains choppy or overlapping, the market is likely still in a corrective phase.
- Key resistance zone to monitor: 3390–3402 – a clean breakout above this range would significantly strengthen the Wave 3 scenario.
📌 Trade Plan
1️⃣ BUY Setup #1
Entry Zone: 3343 – 3341
Stop Loss: 3337
Take Profit 1: 3358
Take Profit 2: 3390
2️⃣ BUY Setup #2
Entry Zone: 3333 – 3331
Stop Loss: 3323
Take Profit 1: 3358
Take Profit 2: 3390
📎 Note: Prioritize entries that come with clear confirmation signals from price action and momentum. Avoid buying during choppy or indecisive market conditions.
XAUUSD H4 I Bullish Bounce Off Based on the H4 chart analysis, the price is falling toward our buy entry level at 3339.71, a pullback support.
Our take profit is set at 3370.26, a swing high resistance.
The stop loss is placed at 3307.53, a pullback support.
High Risk Investment Warning
Trading Forex/CFDs on margin carries a high level of risk and may not be suitable for all investors. Leverage can work against you.
Stratos Markets Limited (tradu.com ):
CFDs are complex instruments and come with a high risk of losing money rapidly due to leverage. 66% of retail investor accounts lose money when trading CFDs with this provider. You should consider whether you understand how CFDs work and whether you can afford to take the high risk of losing your money.
Stratos Europe Ltd (tradu.com ):
CFDs are complex instruments and come with a high risk of losing money rapidly due to leverage. 66% of retail investor accounts lose money when trading CFDs with this provider. You should consider whether you understand how CFDs work and whether you can afford to take the high risk of losing your money.
Stratos Global LLC (tradu.com ):
Losses can exceed deposits.
Please be advised that the information presented on TradingView is provided to Tradu (‘Company’, ‘we’) by a third-party provider (‘TFA Global Pte Ltd’). Please be reminded that you are solely responsible for the trading decisions on your account. There is a very high degree of risk involved in trading. Any information and/or content is intended entirely for research, educational and informational purposes only and does not constitute investment or consultation advice or investment strategy. The information is not tailored to the investment needs of any specific person and therefore does not involve a consideration of any of the investment objectives, financial situation or needs of any viewer that may receive it. Kindly also note that past performance is not a reliable indicator of future results. Actual results may differ materially from those anticipated in forward-looking or past performance statements. We assume no liability as to the accuracy or completeness of any of the information and/or content provided herein and the Company cannot be held responsible for any omission, mistake nor for any loss or damage including without limitation to any loss of profit which may arise from reliance on any information supplied by TFA Global Pte Ltd.
The speaker(s) is neither an employee, agent nor representative of Tradu and is therefore acting independently. The opinions given are their own, constitute general market commentary, and do not constitute the opinion or advice of Tradu or any form of personal or investment advice. Tradu neither endorses nor guarantees offerings of third-party speakers, nor is Tradu responsible for the content, veracity or opinions of third-party speakers, presenters or participants.

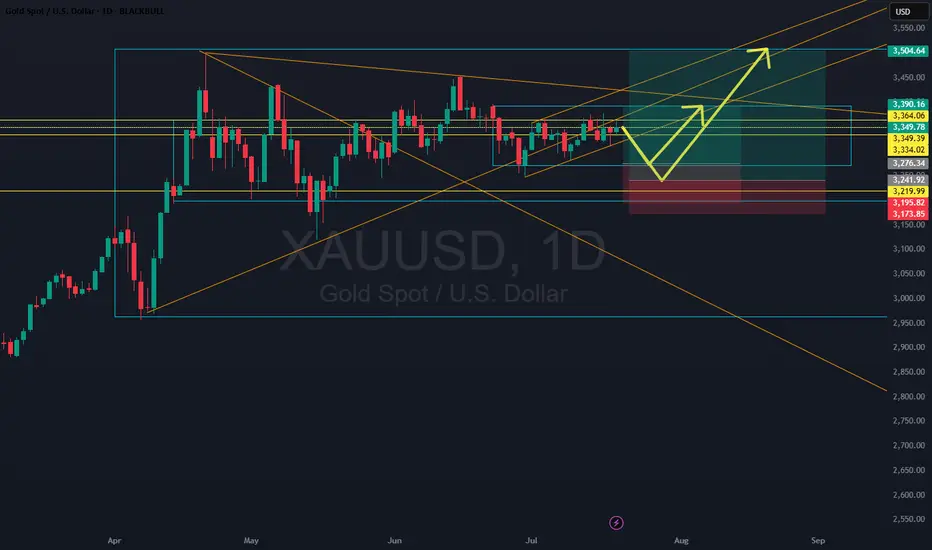
Gold: Range Respect or Breakout Attempt? Two Tactical PlaysGold’s still technically trending up, but momentum is fading with failed attempts to push into new all-time highs. This setup explores two potential plays: one conservative and one aggressive. Both anticipate a move down toward the lower boundary of the current range before buyers step in. Whether we bounce off the base or push higher for a breakout attempt, the key thesis is that at least one range structure holds. Tactical trades with defined risk, waiting for the market to tip its hand.