Analysis only for Monday & Tuesday (Smaller TF)Here I explain analysis for the small TF of the upcoming week. Thanks.
XAUUSDK trade ideas

Gold rises continuously and then moves unilaterally? 3375 is the
At the beginning of this week, international gold prices rose, benefiting from the weaker dollar, while investors paid attention to news on trade progress before the US tariff deadline on August 1. As US inflation data was lower than expected and the market may have some defensive bets against tariffs, gold finally rebounded from the main upward trend line again. The lower-than-expected US inflation data did not trigger the market to re-price more hawkish rate hike expectations.
From a larger perspective, as the Fed's easing policy progresses, real yields may continue to fall, and gold should maintain an upward trend.
Views on today's trend!
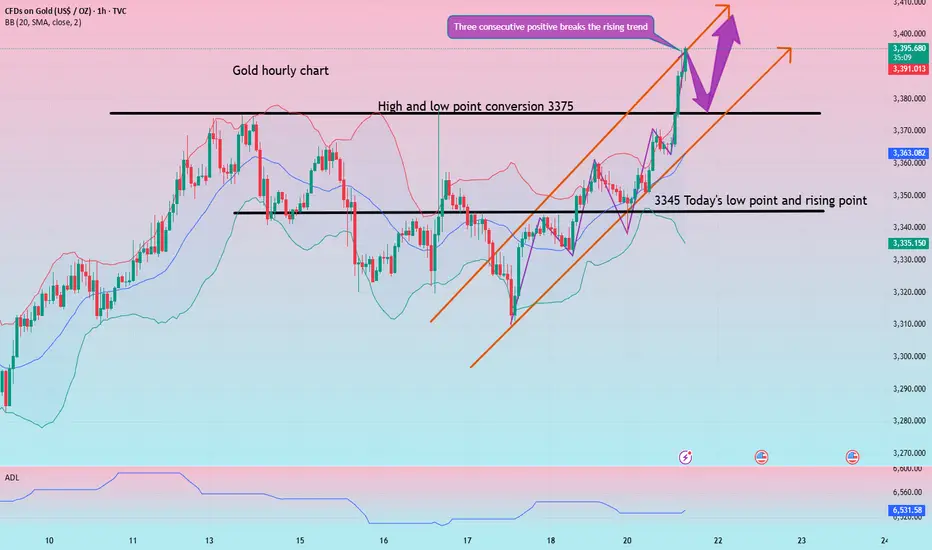
Today, gold is rising slowly, and basically there is no chance of a correction, so it also led to our opening directly chasing a wave of gains, and the market has actually had some risks after the rebound to above 3370. After all, the 3373-75 line was a dense pressure area before.
From the current hourly chart, gold has been moving along the upper track of the moving average and has accelerated since breaking through the 3375 line. It is possible that it will test the 3410 line today. After all, it is already at the 3395 line, and today's strength and weakness watershed has actually shifted from 3340 to 3375. After all, the top and bottom conversions are raised synchronously!
Gold: Long around 3375, defend 3365, and target 3395-3405!
Gold prices are about to rebound?Gold prices are about to rebound?
Just on Saturday, Trump patted Powell on the shoulder, and those who understand understand.
Cut interest rates quickly!!!
Next week will usher in three major news, and global analysts regard next week as a life-or-death moment that determines the future direction of gold prices.
1: Will the Fed cut interest rates in September?
2: How will the tariff war on August 1 evolve?
3: Major non-agricultural data
The trend of gold prices next week is unpredictable, and every day is accompanied by the impact of policy news.
Volatility will become more and more stimulating.
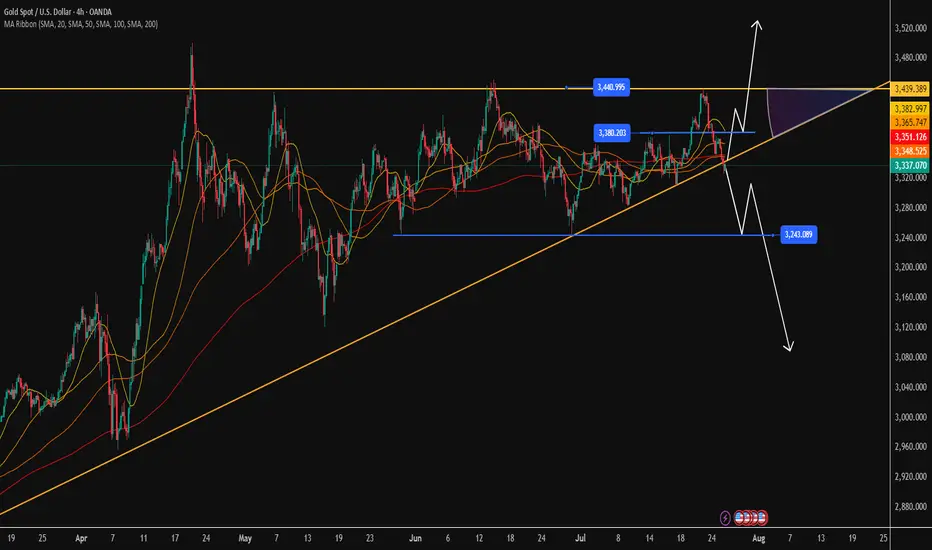
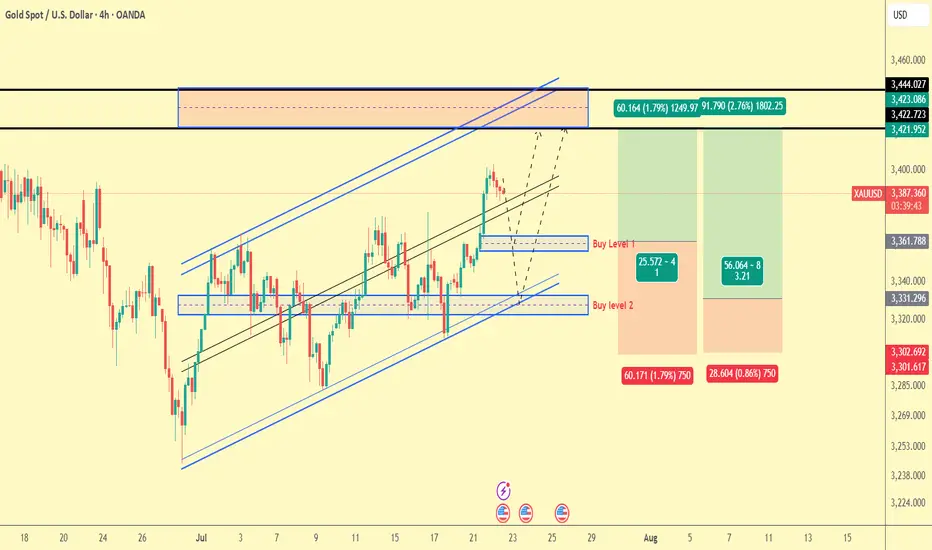
Technical aspect: Gold prices have completed the correction, and I think the bulls are about to counterattack.
As shown in Figure 4h
3330 is an important support level
3440 is a key top area
3360-3380 is a key middle pressure level
We will continue to adopt a low-price long strategy on Monday
Target: 3365-3380-3400-3440-3500+
I firmly believe that next week will be the beginning of a big bull market. Even if it is not, this should be the last chance for bulls to get off the train.
Short-term: $3380-3400 (this week's high resistance).
Medium-term: If it breaks through $3400, it will open the channel to $3500.
Gold operation strategy
Aggressive investors: Buy at the low point of the $3300-3330 range, with a target price of $3380.
Conservative investors: Wait for a breakthrough of $3360 before chasing more, and set the stop loss below 3300.
Conclusion: Gold prices are expected to rebound next week, and the expectation of a rate cut by the Federal Reserve is the core driving force.
Investors are advised to pay attention to non-agricultural data and geopolitical situation, and seize the opportunity to layout at low levels.
Analysis of gold price trend next week!Market news:
This week, international gold recorded its biggest weekly decline in a month. Spot gold turned sharply lower after a sharp rise and finally closed lower. Signs of progress in US-EU trade negotiations hit the safe-haven demand for London gold prices. Geopolitical situation is also a factor in the downward trend of gold prices. On the 25th local time, Tahir Noonu, a senior Hamas official, said that Hamas was absolutely positive about the efforts of the relevant mediators, but was surprised by the US statement. Before the United States and the European Union made progress in trade negotiations, fund managers raised their bullish bets on gold to the highest level since April this year. The trade war has pushed gold prices up 27% this year. Although the easing of trade tensions will weaken safe-haven demand, gold has also been supported by strong buying from central banks.Next week, international gold prices will focus on US-EU and US-China trade negotiations. If the negotiations are optimistic, gold prices may continue to test the $3,300/ounce mark; in addition, focus on the Federal Reserve's resolution. After Trump's visit to the Federal Reserve headquarters, whether the Federal Reserve will maintain its independence will be highlighted in this resolution. Non-agricultural data will also be released on Friday, which needs attention.
Technical Review:
From the weekly gold level, gold is still in a wide range of 3500-3120. It has been fluctuating for ten weeks. The Bollinger Bands are gradually shrinking. MA5 and MA10 are running horizontally, indicating that gold fluctuations will continue. This time, gold stabilized and rose from 3247 to 3438 and then fell back. The current short-term range is 3247-3438! Next week, pay attention to the range of fluctuations and choose a new direction after the narrowing. The daily level is currently in the 4th wave adjustment. There is a high probability that there will be a 5th wave rise after the adjustment, and then a large-scale ABC adjustment will be started. At present, there are two changes in the structure of the 4th wave, one is the triangle contraction and the other is the ABC structure. No matter how it runs, the market outlook is to wait for low-level long positions to see the 5th wave rise. In the short term, gold is still oscillating and selling.
Next week's analysis:
Gold is still adjusting, but it has basically adjusted in place. The current daily price has also adjusted to the key support level of 3300. Similarly, the four-hour chart just stepped back to the upward trend line support, which is the short-term long order entry. Buy above the 3300 mark next week! Next week, gold is expected to further test the 3310-3280 support level. Gold at the 4-hour level peaked at 3438 and then fell back. It has now formed a unilateral trend. The K-line is under pressure from the 5-day moving average and continues to set new lows, and breaks the short-term upward trend line. The Bollinger band opens downward and diverges, and the MACD water cross diverges downward to underwater, indicating that the current gold trend is in an absolute weak position! Next, gold will continue to test the support near the previous low of 3300. If 3300 is not broken, gold buying will continue to have momentum. If 3300 is broken, the short-term rise will end, and the subsequent rebound will basically be just a correction. However, the current 4-hour green column shows signs of shrinking volume, so it is not easy to sell at a low level. Try to sell after the rebound correction, or buy at a low level!
Operation ideas:
Short-term gold 3305-3308 buy, stop loss 3297, target 3350-3370;
Short-term gold 3350-3353 sell, stop loss 3362, target 3320-3300;
Key points:
First support level: 3320, second support level: 3309, third support level: 3300
First resistance level: 3346, second resistance level: 3360, third resistance level: 3375


XAUUSD clean to dropXAUSD CLEAN TO DROP for the next 3 weeks
I will bee waiting for this set up and now all that we need is patience


XAUUSD INTRADAY BUY OPPORTUNITY A buy opportunity is envisaged from the current market price as price rebounds around 3344.78 we’re looking forward to seeing buyers take price back to resistant level of $3,418.04 Take advantage of this opportunity.

Expecting Gold bullish Movement Gold (XAU/USD) has exhibited a strong bullish reversal from the key support zone near 3325 marked by the red area on the chart The price formed a series of higher lows indicating bullish momentum buildup before breaking out sharply above the descending channel and resistance zone around 3340
Following this breakout, the market is now consolidating above the broken resistance, which is acting as new support signaling a potential continuation of the upward trend
Key Levels
Target 1 3365 3370 grey resistance zone
Target 2 3385 3390 major resistance zone
If price holds above the support at 3340 and continues forming higher lows, we expect bullish continuation toward Target 1 and eventually Target 2 if momentum sustains Traders should monitor price action closely at each target zone for potential reactions or reversals

xauussWe will probably have a minor correction in this direction. We will wait for the trend line to break, if it breaks, the targets will be touched in order.


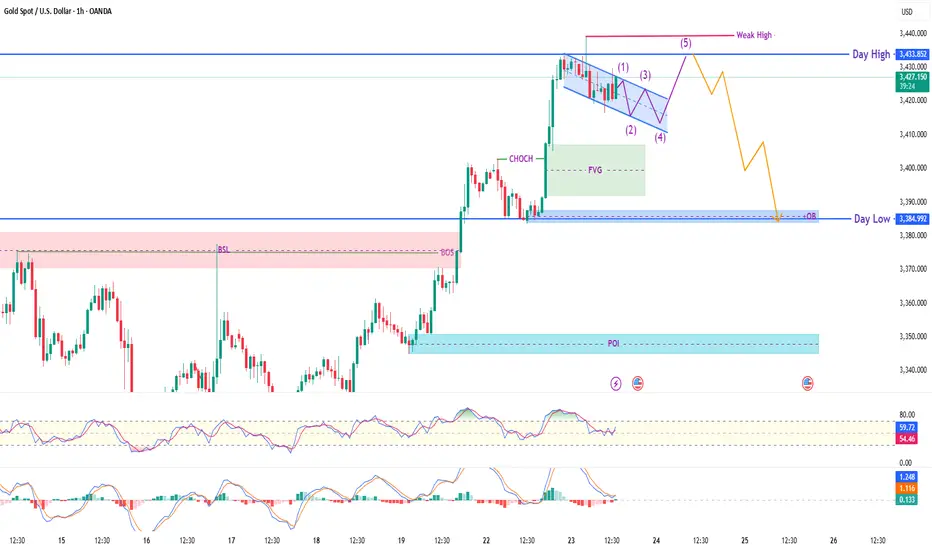
XAU/USD (Gold) – Smart Money Reversal Setup | 1H Breakdown🔹 Current Price: $3,423.98
🔹 Session Range: Day High $3,433.85 | Day Low $3,384.99
🔍 Smart Money Narrative:
Clean bullish impulse followed by CHoCH + Fair Value Gap (FVG) creation
Price forming Ending Diagonal / Rising Wedge (5-wave structure) into weak high
Expecting liquidity sweep above the weak high followed by bearish reversal
📐 Key Technical Highlights:
🟣 CHoCH confirms potential reversal
🟩 FVG + OB Zone acting as mitigation base
🔻 Day Low + 1H OB marked as key bearish target
🔺 Day High = weak liquidity likely to be swept before drop
📈 Trade Idea (Bearish Plan):
Let price complete wave (5) and sweep the weak high
Look for confirmation (MSS, FVG, lower TF BOS)
Short entry target: OB near $3,385 (Day Low zone)
Optional swing target = $3,360–3,345 POI zone
⚠️ Risk Note:
This is a smart money concept-based idea focused on liquidity, CHoCH, and mitigation logic. Use lower timeframe confirmations before entry. Manage risk wisely.
#XAUUSD #SmartMoney #ICT #LiquiditySweep #CHoCH #FVG #MarketStructure #ForexGold #ReversalSetup
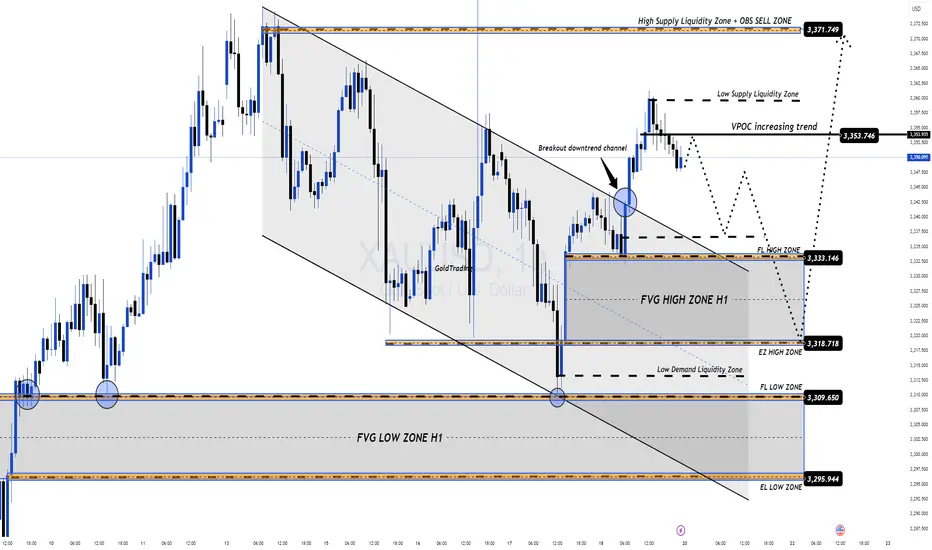
GOLD OUTLOOK – READY FOR THE NEW TRADING WEEK (JULY 21–25)GOLD OUTLOOK – READY FOR THE NEW TRADING WEEK (JULY 21–25)
🟡 Market Recap:
Gold made a strong bullish reversal at the end of last week, following a liquidity sweep at the FVG ZONE 3310. Price surged quickly toward the OBS SELL ZONE around 335x–336x.
However, by Friday’s close, price reacted to multiple confluences (OBS + FIBO zones) and closed below the VPOC level in the recent uptrend – forming a potential short-term top.
📉 Outlook for July 21–25:
No major economic data expected next week.
However, geopolitical tensions and trade policy concerns (e.g. tariffs, military conflicts) will be the key catalysts.
These events could lead to high volatility and liquidity grabs across the board.
🧠 Technical Perspective – H1 Mid-Term View:
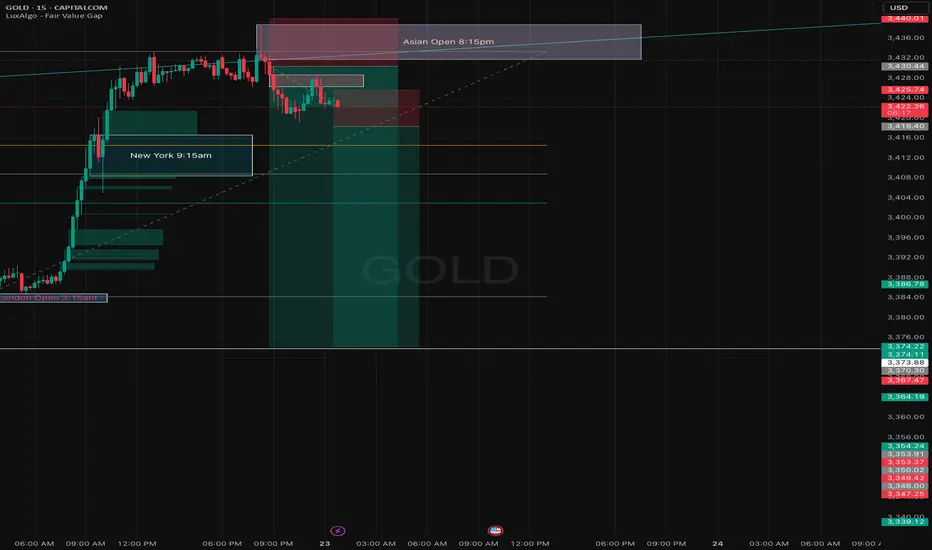
Gold continues to form multiple unfilled Fair Value Gaps (FVGs) after strong bullish moves.
Recent price action created new high-zone FVGs, but lower FVGs remain untested.
🔁 Expected scenario: A potential retracement to fill the lower FVG zones (3310/3305), followed by another bullish leg.
📍Trading Strategy:
Wait for price to retrace into FVG Low Zones.
Look for early BUY setups at confluence areas:
CP zones
FIBO retracement levels
Volume/Price reaction zones
🎯 Target Outlook:
Bullish targets around 333x – 336x remain valid.
If price sustains momentum after pullback, we may aim for Buy Side Liquidity near 3371.749.
✅ Key Reminders:
Avoid chasing highs (FOMO).
Stick to proper TP/SL rules, especially with headline-driven markets next week.
🎉 Wishing you a relaxing weekend – recharge and get ready to conquer the markets next week!
🚀 GOD BLESS ALL
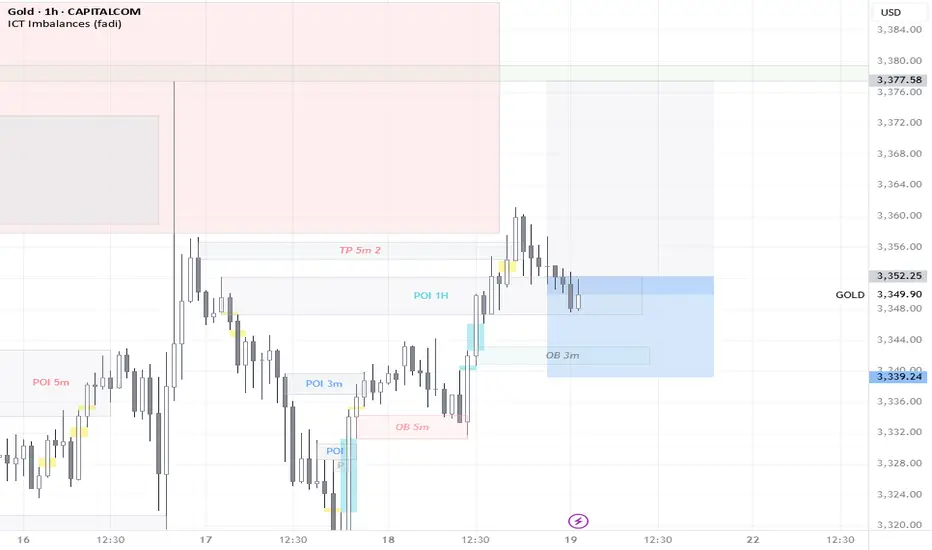
XAU/USD (1H) – Smart Money Bearish SetupPrice is currently breaking below the Breaker Block and showing rejection from the FVG zone, confirming bearish strength. Market structure has shifted after BOS, with momentum favoring a move toward the POI demand zone.
🔍 Key Observations:
🔻 Breaker Block + FVG rejection confirms supply pressure.
🔵 Bearish Bias active below $3,382.50
🎯 Targeting POI zone: $3,345–$3,355
RSI & MACD indicators confirm bearish momentum.
🚩 Market Structure Flow:
BOS confirmed → Breaker Block retest → Continuation
Day High ($3,438) protected by strong BSL
Lower highs and FVG break confirm institutional selloff.
📚 Bias: Strong Bearish
🧠 Confluence: SMC + Breaker Block + Fair Value Gap + Liquidity Sweep
⚠️ Note: Wait for clean POI reaction before considering countertrend plays.

Gold Trade plan 22/07/2025Dear Traders,
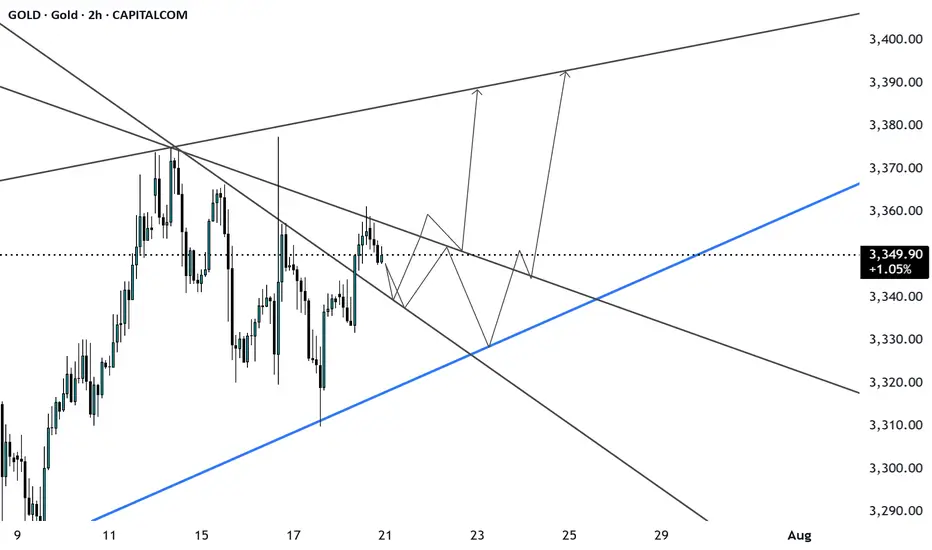
The price is currently moving towards the upper boundary of the channel. The areas where it could potentially rise again are the 3360 zone and the 3320 zone, which is the lower boundary of the upward channel. The first area I have in mind is the 3360 zone, and the second area, 3325-3330, which is more attractive for buying. In the first area, there is a high likelihood that the price will react, but the risk-to-reward ratio is better in the second area.
Regards,
Alireza!
GOLD 1H CHART ROUTE MAP UPDATEHey Everyone,
Quick follow up on our 1H chart idea
We had a nice push up on the chart at the start of the week, coming close but just short of the 3381 gap. Still, it was a solid catch that respected our levels beautifully.
Following that, we cleared our 3353 Bearish Target, which also triggered the EMA5 cross and lock, confirming the move toward our 3328 retracement range, a level we hit perfectly.
As expected, we're now seeing a reaction in this 3328 zone, which remains key. We are watching this closely for a potential bounce. However, if price crosses and locks below 3328, the swing range will open, setting up the potential for a larger swing bounce from deeper levels.
We’ll continue using dips and key support zones for scalps and intraday bounces, aiming for 20–40 pips per level. The structure remains valid, and as mentioned before, our back-tested levels have consistently shown strong reaction zones over the past 24 months.
Updated Reminder of Key Levels:
BULLISH TARGET
3381
EMA5 CROSS & LOCK ABOVE 3381 opens
3416
EMA5 CROSS & LOCK ABOVE 3416 opens
3439
BEARISH TARGETS
3353 ✅ HIT
EMA5 CROSS & LOCK BELOW 3353 opens
3328 ✅ HIT
EMA5 CROSS & LOCK BELOW 3328 opens
3305
EMA5 CROSS & LOCK BELOW 3305 opens Swing Range:
3288
3259
As always, we’ll continue monitoring and sharing updates, as price reacts around these zones. Thank you all for the continued support, your likes, comments, and follows are genuinely appreciated!
Mr Gold
GoldViewFX

GOLD LONG LONGGold has broken the daily symmetric triangle. If we can get an FVG on daily chart today, tomorrow can give us a great chance, catching this big move on pullback. Look for inverse FVGs on m5 in this gap, if made.
Target: 3900

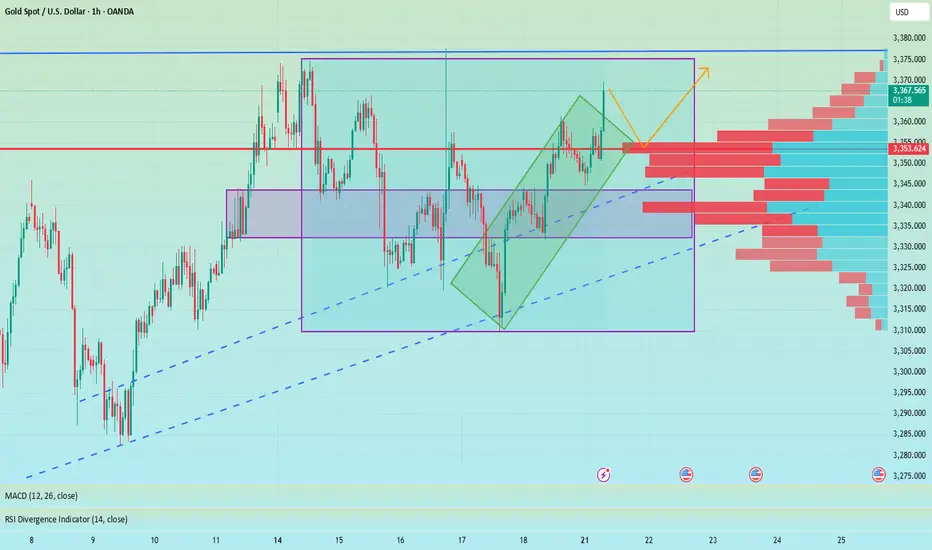
Accurate prediction, continue to buy after retracement to 3353📰 News information:
1. The Trump administration puts pressure on the Federal Reserve to cut interest rates
2. The continued impact of tariffs and the responses of various countries
📈 Technical Analysis:
Gold is currently rising rapidly, reaching a high near 3368, and the overall bullish trend has not changed yet. It is not recommended to continue chasing the highs at present. Those who are long at 3345 can consider exiting the market with profits. The technical indicators are close to the overbought area and there is a certain risk of a correction. Be patient and wait for the pullback to provide an opportunity. At the same time, 3353 has become the position with relatively large trading volume at present, and the top and bottom conversion in the short term provides certain support for gold longs. If it retreats to 3355-3345, you can consider going long again, with the target at 3375-3385. If it falls below 3345, look to 3333, a second trading opportunity within the day. If it falls below again, it means that the market has changed, and you can no longer easily chase long positions.
🎯 Trading Points:
BUY 3355-3345
TP 3375-3385
In addition to investment, life also includes poetry, distant places, and Allen. Facing the market is actually facing yourself, correcting your shortcomings, facing your mistakes, and exercising strict self-discipline. I share free trading strategies and analysis ideas every day for reference by brothers. I hope my analysis can help you.
FXOPEN:XAUUSD OANDA:XAUUSD FX:XAUUSD FOREXCOM:XAUUSD PEPPERSTONE:XAUUSD TVC:GOLD
Gold Possible ScenarioGold is trading in a channel pattern now and may take support at 3340-3330 and rebound again to reach the target of 3390.the possible price movements are indicated here.
Gold 30Min Engaged ( Bearish Reversal Entry Detected ) what do you think before Price Move , GOLD Bullish or Bearish & why ?
lets spread the Knowledge
➕ Objective: Precision Volume Execution
Time Frame: 30-Minute Warfare
Entry Protocol: Only after volume-verified breakout
🩸 Bearish Reversal : 3339 Zone
🩸 Bullish Reversal : 3311Zone
➗ Hanzo Protocol: Volume-Tiered Entry Authority
➕ Zone Activated: Dynamic market pressure detected.
The level isn’t just price — it’s a memory of where they moved size.
Volume is rising beneath the surface — not noise, but preparation.
🔥 Tactical Note:
We wait for the energy signature — when volume betrays intention.
The trap gets set. The weak follow. We execute.
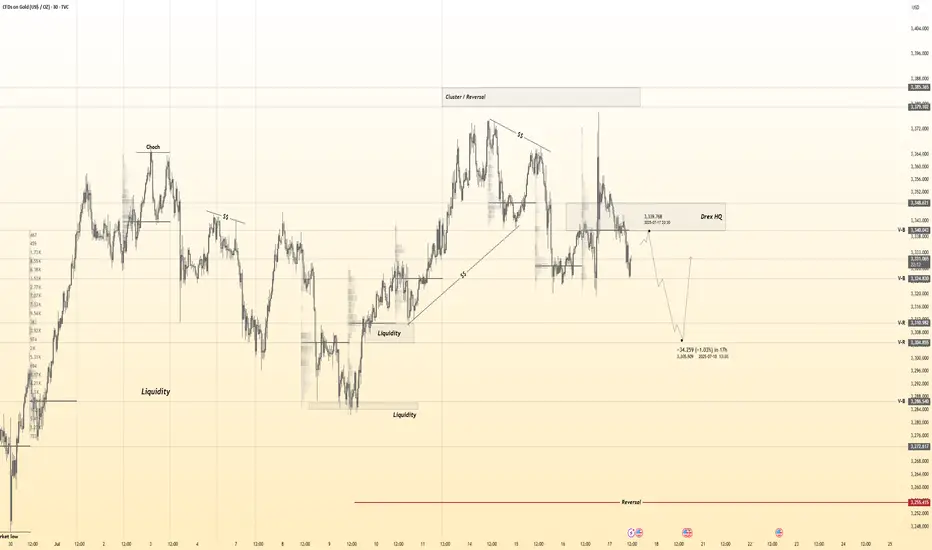
XAUUSD Update July 2025 - PLAN B - Bulls RejectionAfter Hard fall from 3439 ( 3450 rejection ), Gold will retest 3310 support.
If bounce from here, it will move upside and retest 3373 resistance.
If any hard rejection from 3373 resistance area, its a sign that price will move to make a lower low.
Becarefull in this accumulation zone.
Bearish movement still hiding before it break 3120 support.
Have a blessing day !
