Gold Possible ScenarioGold is trading in a channel pattern now and may take support at 3340-3330 and rebound again to reach the target of 3390.the possible price movements are indicated here.
XAUUSDK trade ideas
XAUUSD Update July 2025 - PLAN B - Bulls RejectionAfter Hard fall from 3439 ( 3450 rejection ), Gold will retest 3310 support.
If bounce from here, it will move upside and retest 3373 resistance.
If any hard rejection from 3373 resistance area, its a sign that price will move to make a lower low.
Becarefull in this accumulation zone.
Bearish movement still hiding before it break 3120 support.
Have a blessing day !

Gold technical outlook – Signs of exhaustion at channel topOANDA:XAUUSD is climbing within a well-defined ascending channel, and price is now brushing up against the upper boundary, a dynamic resistance zone that has historically triggered pullbacks. If price gets rejected here, we may see a healthy correction toward the key support at 3,350, offering a potential reload point for bulls.
Should buyers step in and defend this level, the bullish structure remains intact, setting the stage for a renewed push higher. On the other hand, a clean break below 3,350 could open the door for a deeper retracement toward the lower edge of the channel, where more significant demand may lie.
All eyes should be on price action and volume in this regio, watch for reversal patterns like bullish pin bars or engulfing candles to confirm entries. As always, risk management comes first. Don't trade assumptions, trade confirmations.
What’s your take on this setup? Drop your thoughts below and let’s discuss!

IS XAUUASD SET FOR WEELY BULLISH TREND ? FUNDAMENTAL ANALYSIS
"This week, the golden opportunity shines bright! With robust support at $3320 and our sights set on a $3340 target, we're giving strong buy signals. The path to profit is clear, but keep a keen eye on the $3370 resistance. Don't miss this strategic entry!

XAUUSD Technical Analysis – Resistance Turned Support, 📈 XAUUSD Technical Analysis – Resistance Turned Support, Bullish Continuation Expected
Gold (XAUUSD) has shown strong bullish momentum after breaking above the key resistance zone around $3,400, which now appears to be acting as a new support level. This structure shift signals a classic break-and-retest scenario, commonly observed in bullish continuations.
🔍 Key Observations:
Structure Shift: Previous resistance near $3,400 has been broken with strong bullish candles, suggesting buyer dominance. This level is now expected to serve as support.
Bullish Momentum: The move from the $3,320 support zone to above $3,430 was accompanied by clear trend formation and clean market structure, indicating sustained momentum.
Retest in Progress: Price is currently pulling back toward the new support zone ($3,400). If this area holds, a bullish reaction is expected.
Next Target: If support at $3,400 holds as expected, price could rally back toward the next resistance and projected target of $3,460.
📚 Educational Insight:
This setup illustrates the principle of resistance becoming support (RBS)—a foundational concept in technical analysis. After a breakout, a successful retest of former resistance often provides a high-probability entry point for trend continuation trades.

XAUUSD Intraday / Swing Trade PlanTop-Down Analysis
D1: Price is currently in a ranging phase, moving sideways within a defined range.
H1 / H4: Lower timeframes are showing an uptrend.
However, price has already reached the 423% Fibonacci Extension on H1, which may trigger a significant pullback.
If a correction occurs on H1, but H4 structure remains bullish, we can look for continuation setups targeting the Fibonacci extension levels on H4.
Trading Strategy (Brief Overview)
Since price is ranging on the higher timeframe, we can trade "ping-pong style" — bouncing between key levels.
Trend Continuation
Look to follow the trend when price reacts at Key Level 1 (likely a demand zone or Fibonacci confluence).
Potential Reversal
Watch for a loss of momentum on H1 when price approaches Upper Key Level 2 — this could signal a reversal opportunity.

XAU/USD – Inverse Head & Shoulders Breakout? Long term plansGold (XAU/USD) has recently formed a classic Inverse Head and Shoulders pattern on the 8H chart, with a breakout now pushing above the neckline (~$3,400). This pattern typically signals a bullish reversal, especially after a prolonged downtrend.
🔹 Pattern Breakdown:
Left Shoulder: Early May
Head: Late May
Right Shoulder: Early July
Neckline Breakout: Now testing above $3,430
🔍 Market Context:
Price is consolidating around key resistance near $3,430–$3,450.
Broader sentiment is supported by safe-haven flows, softening USD, and ongoing macro uncertainty.
Analysts expect upside continuation toward $3,500+ if this breakout holds.
📈 Outlook:
Bullish bias while above $3,365–$3,380 support zone.
Confirmation of the breakout could target $3,500–$3,600 in the short-to-medium term.
🕊️ Watch for: U.S. economic data, Fed tone, geopolitical tensions, and neckline retests.

XAUUSD Path Going As per Previous Ideas Analysis Discussed.XAUUSD Path Going As per Previous Ideas Analysis Discussed in the images above for further information or Previous Analysis refer previous Ideas.

Smart Money Concepts in Action: XAUUSD Tests Strong Resistance Market Context and Structure
On the 1-hour chart, XAUUSD (Gold) has been in a bullish market structure, forming consecutive Breaks of Structure (BOS)—a clear sign of buying pressure and upward momentum. These BOS points mark moments when the market forms new highs, confirming bullish continuation.
However, as price approaches the 3370–3380 zone, it reaches a well-defined resistance/supply area. This zone has previously rejected price and can be viewed as a region where institutional selling may occur.
🧠 Smart Money and Liquidity Concepts
From a Smart Money Concepts (SMC) perspective, price often moves to areas of liquidity—zones where buy stops (above highs) or sell stops (below lows) are collected. In this chart:
Price pushes up towards 3370, potentially grabbing liquidity above recent highs.
This move could be a liquidity sweep, where the market fakes a breakout to trap retail traders before reversing.
Such behavior often occurs near institutional zones, suggesting a possible distribution phase—where large players offload positions before a move in the opposite direction.
⚙️ Resistance Analysis: Why 3370 Matters
The 3370–3380 area has acted as a ceiling in the past.
Price is currently reacting near this level, showing early signs of rejection.
This zone aligns with previous order blocks, where institutions may have placed sell orders.
In educational terms, this shows how supply zones can act as natural turning points in a market, especially when price approaches them after an extended move.
📦 Support & Potential Downside
If a reversal happens from this resistance, the next key support zone lies between 3300–3320. This level has historically acted as demand and could be revisited for price rebalancing or order filling.
📝 Educational Summary
This XAUUSD chart provides a great learning opportunity in observing:
How Break of Structure (BOS) confirms trend direction.
The role of liquidity zones in trapping retail traders.
How smart money operates around key levels like 3370.
The importance of combining structure, zones, and reaction for confluence.

Weekly Analysis on GOLDFor next week trading session i will wait for buy set up since market structure is still in a bullish trend. There might be a selling opportunity but still i will wait for a great buy set up.

XAUUSD-It still looks like a Triangle on goldLast week gold made an impulsive wave up but after that it dropped very hard.
If gold is still in a Triangle we could see a correction up and one more move down for wave E. But if price closes below (orange) wave C then the pattern is changed.
Let's see what price does and react.
Trade idea: Wait for the pattern to finish. Then wait for an impulsive move up and a small correction down on a lower timeframe and a change in orderflow to bullish to trade longs.

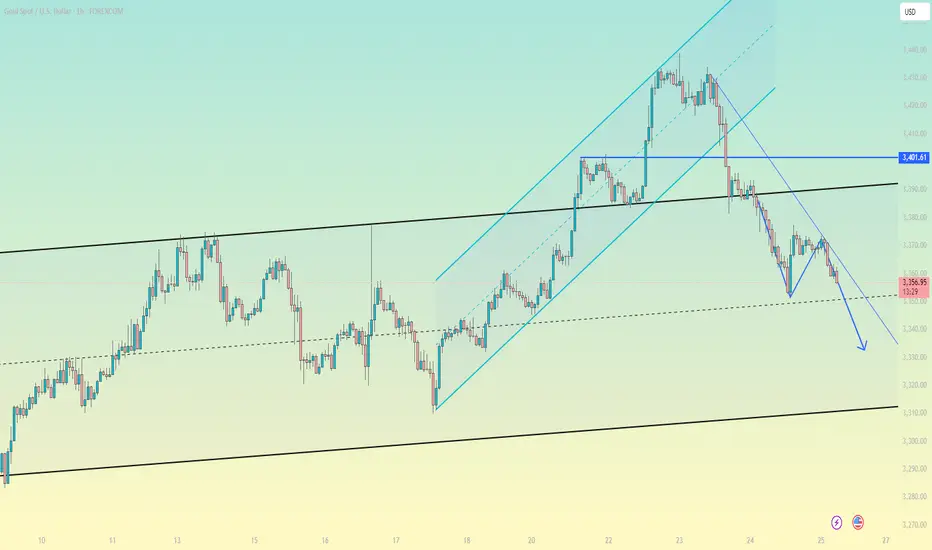
Hybrid Gartley-Elliott Wave Trade Setup on Gold Detailed Analysis & Prediction:**
This trade setup merges two powerful frameworks: a **bearish Gartley pattern** indicating a short-term pullback, and an **Elliott Wave interpretation** suggesting bullish continuation via wave five.
---
### 🧠 Thought Process:
1. **Gartley Pattern Completion:**
- The chart shows a completed bearish Gartley pattern with point D aligning around the **3,372 level**.
- As per harmonic rules, point D typically signals a reversal zone, suggesting a short-term drop.
2. **Projected Pullback:**
- A drop is expected toward the **3,323 support zone**, which coincides with previous swing lows and Fibonacci retracement confluence.
- This area likely marks the start of **wave five** in the Elliott Wave count — indicating that the bearish move is simply the final corrective wave before continuation.
3. **Wave 5 Bullish Opportunity:**
- Once price reaches the 3,323 zone and shows reversal confirmation, a strong bullish push is expected to begin.
- This aligns with historical wave structures and momentum indicators showing possible trend exhaustion.
---
### 🎯 Profit Targets:
| Target | Type | Price (USD) |
|--------|-----------------------|---------------|
| TP1 | Fibonacci 1.0 | 3,447.875 |
| TP2 | Fibonacci 1.27 | 3,536.025 |
| TP3 | Fibonacci 1.618 | 3,649.640 |
---
### 🛑 Stop Loss Strategy:
| Level | Type | Price (USD) |
|-----------|---------------------|---------------|
| SL1 | Conservative | 3,246.111 |
| SL2 | Aggressive | 3,198.444 |
---

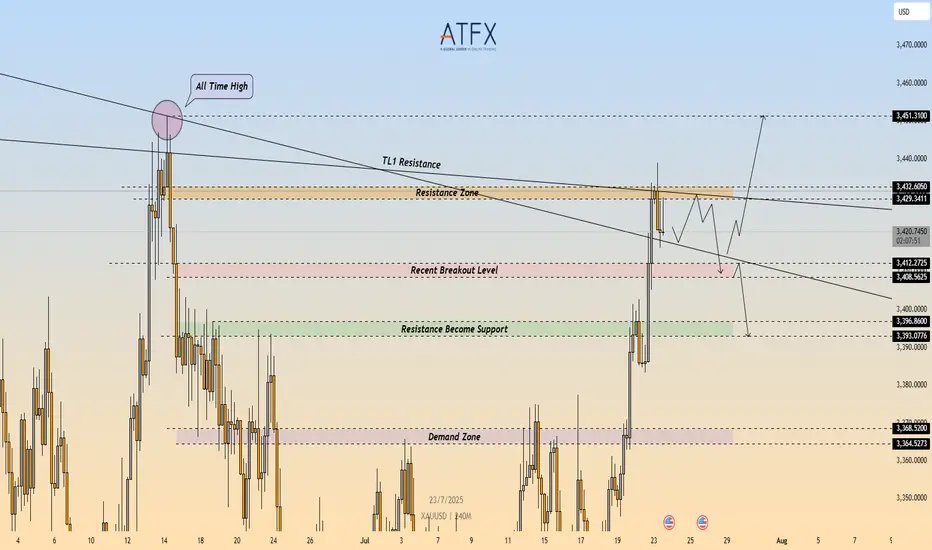
XAU/USD: Bearish Rejection at $3,432 – Short Setup in Play🔴 XAU/USD – Bearish Rejection at Key Resistance Zone ($3,432)
🔍 Technical Outlook
Gold (XAU/USD) failed to break through the $3,429–$3,432 resistance zone, which aligns with a descending trendline (TL1) and prior swing high. The rejection from this confluence zone is reinforcing bearish pressure, with price now carving out lower highs on the 4H timeframe.
A clean break below $3,412 would confirm bearish continuation and open the door toward the $3,400 area, followed by the demand zone at $3,368–$3,365.
🔻 Short Setup
Entry: 3,432
Stop Loss: 3,436
Take Profit 1: 3,412
Take Profit 2: 3,396
R\:R Ratio: ≈ 1 : 6.95
Invalidation: Close above 3,436
📌 Key Levels
Resistance: 3,429 – 3,432
Support 1: 3,412
Support 2: 3,368 – 3,365
Trendline: Long-term descending resistance acting as ceiling
📘 Summary
Gold remains capped beneath a critical resistance cluster. The rejection around $3,432 could trigger a deeper pullback toward $3,396, especially if sellers push price below $3,412. Bearish bias remains valid while price holds under the trendline.
📉 Bias: Bearish
📈 Confirmation Trigger: Break below $3,412
⚠️ Invalidation Level: Above $3,436
Gold prices soared! Gold hit a five-week high!Market news:
On Tuesday (July 22) in the early Asian session, spot gold rose and fell, and is currently trading around $3,390/ounce. Driven by the weakening of the US dollar, the decline in US bond yields and the increasing uncertainty in trade policies, the gold market broke out again, breaking through the $3,400/ounce mark, hitting a five-week high. As the deadline for the United States to impose new tariffs on global trading partners on August 1 approaches, market uncertainty provides strong support for international gold.In addition to the trade situation, the Federal Reserve's monetary policy trends have also added momentum to the rise in gold prices. The market expects that the probability of the Federal Reserve cutting interest rates in September has risen to 59%. The Federal Reserve's July meeting is expected to keep interest rates unchanged, but the market's expectations for an October rate cut have been fully digested. These policy uncertainties have further enhanced the attractiveness of gold as a safe-haven asset.This week, the London gold price ushered in a "critical node" market. Trade policy, US dollar fluctuations, central bank trends and safe-haven fund flows will become the core driving force of the long-short game in the gold market. On this trading day, Federal Reserve Chairman Powell delivered a welcome speech at a regulatory meeting. Pay attention to whether Powell involves remarks related to monetary policy. In addition, continue to pay attention to news related to the international trade situation and geopolitical situation.
Technical Review:
The gold daily chart is strong and oscillating upward. The MA10/7-day moving average maintains a golden cross and opens upward. The hourly chart and the four-hour chart Bollinger band open upward, the moving average system maintains an upward opening, and the price fluctuates upward along the MA10-day moving average. Yesterday, the Asian session fell slightly to 3346 and stabilized. The bottoming out and pulling up again broke through and stood on the hourly line middle track, which means short-term stabilization!
So yesterday's Asian session rose, the European session continued to break high, and the US session still had a second pull-up; but because it is in a period of oscillation, wait patiently for a wave of stabilization before taking action. The reference point selected should pay attention to the 382 split support, that is, 3370, which happens to be the top and bottom conversion support point, followed by the 3356-3358 split support and the middle track.
Today's analysis:
Gold rose strongly yesterday, breaking the highest level in the past month. After the price of gold rose yesterday, it did not rise and fall like before. Instead, it broke through multiple resistances and came to the 3400 mark. From the one-hour market, the direction of the market is very clear, but it is still not recommended to buy directly. Waiting for a fall before getting on the train is the safest strategy!The Asian session gold price was blocked near 3400, and the one-hour market showed a small double top structure, which means that the market will still adjust in a short time. Therefore, do not buy in the Asian session, wait for the adjustment to continue to buy, and the support below is the top and bottom conversion position of 3370. After the Asian session gold price adjusted to 3370 and walked out of the bottom structure, continue to buy. The general direction of this round is to look at the 3450 line!
Operation ideas:
Buy short-term gold at 3375-3378, stop loss at 3366, target at 3400-3420;
Sell short-term gold at 3425-3428, stop loss at 3436, target at 3390-3370;
Key points:
First support level: 3383, second support level: 3370, third support level: 3358
First resistance level: 3403, second resistance level: 3416, third resistance level: 3428

Gold----Buy near 3374, target 3399-3420Gold market analysis:
Yesterday, Monday, gold rose strongly, reaching a high of around 3402. This range is still relatively rare at the beginning of the week. Let's not worry about whether it is caused by fundamentals. Judging from the market's morphological indicators, we can be very sure that it is a buying trend. Yesterday's buying has broken the 3377 position. The breaking position of this position has determined the new buying position. In addition, the daily moving average has also begun to diverge. The morphological support is around 3370 and 3374. Today, relying on this position, the moving average is bullish. Yesterday, it rose too much. I estimate that there will be a need for repair today. The retracement during the repair is our opportunity to get on the train again. On the weekly line, 3400 is a hurdle. The previous multiple stops were only short-lived, so we need to be cautious when buying above 3400.
There is a signal of closing negative in 4H. The Asian session needs to be adjusted and repaired. It is better to buy at a low price. 3402 is a small pressure. We cannot estimate where it will be repaired. We can determine the support below and buy near the support. There can also be short-term selling opportunities above 3400 in the Asian session. It is only in the Asian session, and the buy order is the main target.
Fundamental analysis:
There is no major news in the recent fundamentals. The situation in the Middle East is still relatively stable. There is no new rest in tariffs, and the impact on the market is limited.
Operation suggestion:
Gold----Buy near 3374, target 3399-3420

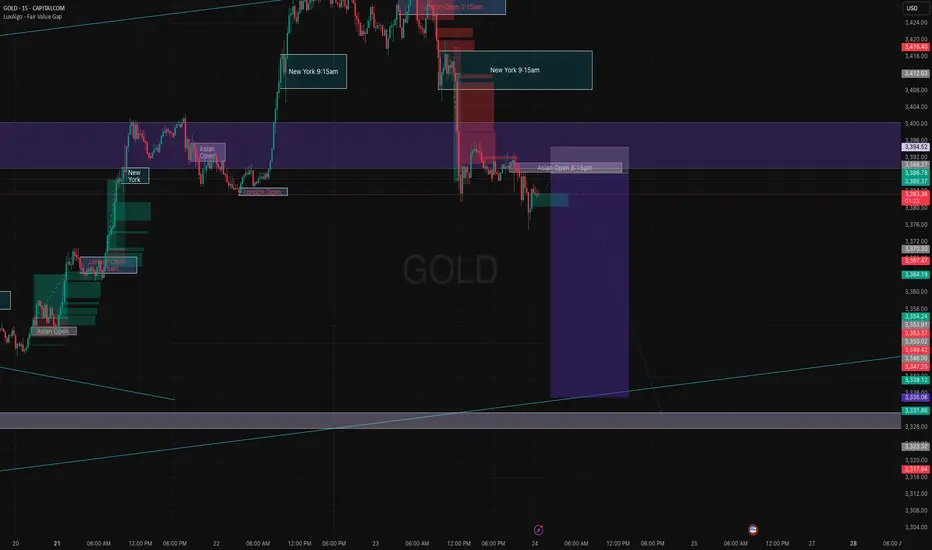
Gold (XAUUSD) – 22 July Outlook | Reversal Zones in FocusGold (XAUUSD) – 22 July Outlook | Three Key Reversal Zones to Watch
Yesterday, Gold gave a strong breakout above the key resistance level at 3377 , shifting the M15 structure bullish and confirming upside strength.
Today, the market is likely entering a retracement phase on both the H4 and M15 timeframes — a healthy pullback after a breakout, which may lead to the next leg of the uptrend.
So where should we focus for long opportunities?
We are observing three key zones as potential bases for the continuation move:
📍 Zone 1 – 3377.6–3373.5 (Breaker Block):
This is the immediate structure zone — previous resistance which may now flip into support.
→ If price respects this area, we can anticipate a classic S&R Flip setup.
📍 Zone 2 – 3367.5–3363 (Demand Block):
If the first level doesn’t hold, this zone becomes critical. It lies just under the breakout base and could act as the next level of defense by bulls.
📍 Zone 3 – 3358.5–3350.5 (H4 Order Block):
This is the most significant support zone for the day. It aligns with a higher-timeframe order block, making it a high-probability POI for a deeper pullback and reversal.
But remember, we do not predict blindly .
Plan of Action:
– Observe price behavior at each zone
– Wait for confirmation via M1 internal structure shifts + BoS
– Trade only when all conditions align
– SL: 40 pips | TP: 120 pips
Risk-Reward: Always 1:3
Summary:
✅ Structure is now bullish on M15 and H4
✅ We’re in a pullback phase — ideal for continuation trades
✅ Three clear POIs mapped — now we wait for the market to speak
Patience. Precision. Discipline.
Let the trade come to you — not the other way around.
📘 Shared by @ChartIsMirror

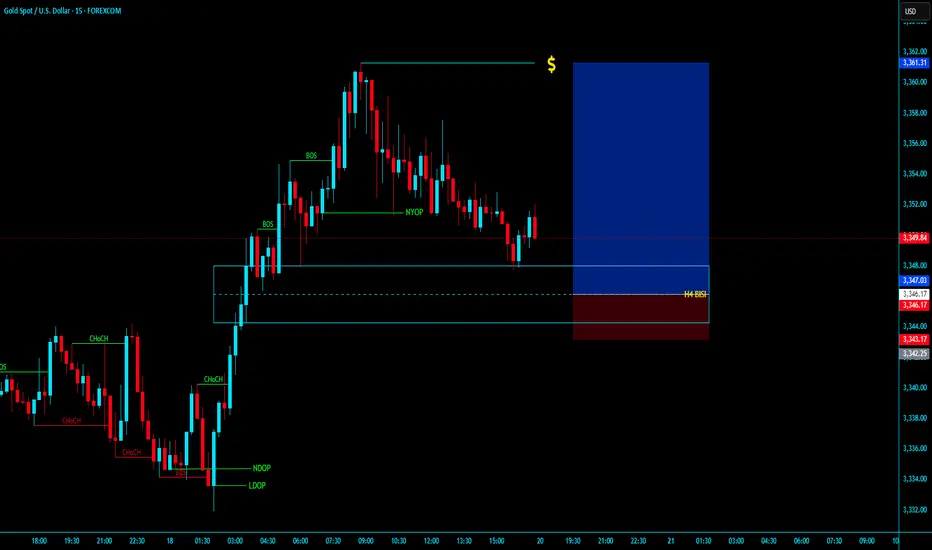
XAUUSD H4 BISI BUY LONGXAUUSD H4 BISI BUY LONG
- Market bearish to Bullesh market is in h4 BISI .
- In LTF after valid MSS with vslid OBI / LTF BISI then entry with Tight SL and Long TP
---- KGB PRIYABRTA BEHERA -----
ICT Trader & Advance Mapping SMC Trader
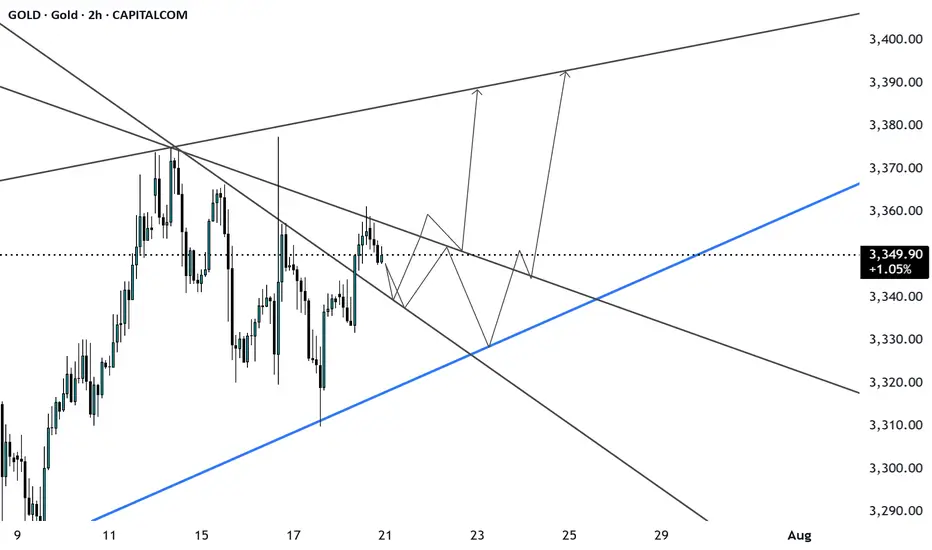
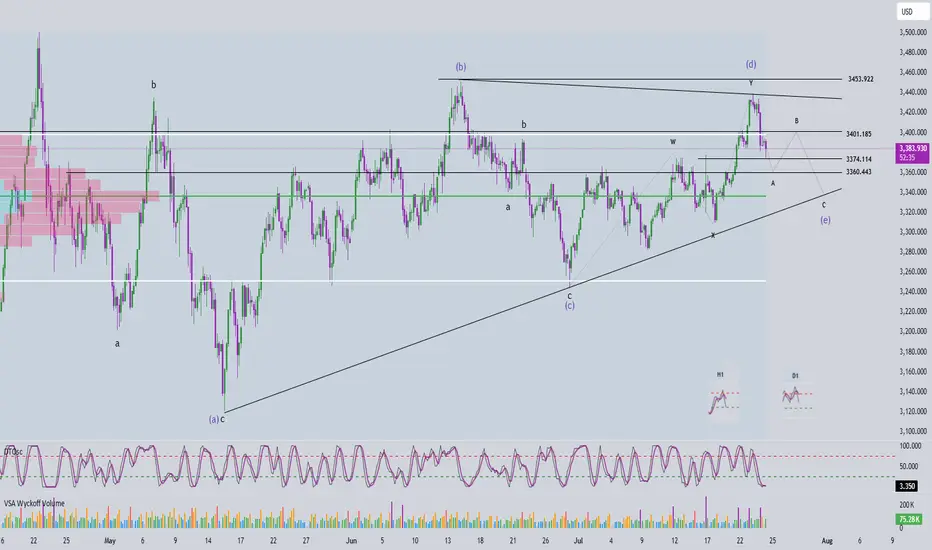
Elliott Wave Analysis – XAUUSD July 24, 2025📊
________________________________________
🔍 Momentum Analysis:
• D1 Timeframe: Momentum is currently in a downtrend, indicating that the dominant trend in the short term (at least until early next week) is likely to remain bearish or sideways.
• H4 Timeframe: Momentum has entered the oversold zone and is showing signs of a potential bullish reversal. This suggests that a corrective upward move may occur today.
• H1 Timeframe: Momentum is still declining and is expected to need around two more H1 candles before entering the oversold zone, implying that one more leg down may occur before a recovery begins.
________________________________________
🌀 Elliott Wave Structure Update:
Yesterday’s expectation of a breakout above the resistance zone at 3453 to confirm the start of a new bullish trend did not materialize. Instead, price dropped to the 3374 region, opening up two primary scenarios:
✅ Scenario 1: The correction is still unfolding
• Wave (d) in blue appears to be complete.
• The current leg is likely wave (e), the final leg in a contracting triangle correction.
• In this case, the lower boundary of the triangle and overlapping support zones will serve as key levels to watch for the completion of wave (e).
✅ Scenario 2: Wave 1 of a new bullish trend has completed
• The current decline is wave 2 in a new bullish impulsive sequence.
• The objective here is to identify the bottom of wave 2 to prepare for a potential buy entry into wave 3, which is expected to be stronger and longer than wave 1.
📌 Key difference between the two scenarios:
• Scenario 1 → Wave (e) completes, followed by wave 1 of wave 5.
• Scenario 2 → Wave 2 completes, followed by a powerful wave 3 of wave 5.
________________________________________
🧩 Current Wave Structure:
• A five-wave bearish structure is currently unfolding on the chart.
• According to Elliott Wave Theory, corrective patterns do not typically form five-wave structures.
• Therefore, this is likely wave A in a zigzag (5-3-5) formation.
• Possible targets for wave 5 within wave A:
o Target 1: 3374 – current reaction zone.
o Target 2: 3360 – next significant support level.
________________________________________
📌 Combining Wave Structure with Momentum:
The D1 momentum is firmly bearish, reinforcing the view that the market is undergoing a larger ABC correction.
On the H4 timeframe, momentum is oversold and showing early signs of reversal, aligning with the potential formation of wave B — typically a weak, sideways upward move. The likely resistance zone for the end of wave B lies between 3401 and 3410.
Meanwhile, H1 momentum is still falling and not yet in the oversold zone, suggesting there may be one more move down to complete wave 5. The ideal target for this final leg is around 3360.
Summary:
• D1 bearish → confirms ongoing major correction.
• H4 oversold → supports a potential weak wave B.
• H1 still declining → wave 5 may complete around 3360 before a recovery begins.
________________________________________
💼 Suggested Trading Plan:
For traders with limited experience or those not yet confident in reading live market signals, a Buy Limit strategy at clear support levels is recommended:
• Buy Zone: 3362 – 3360
• Stop Loss: 3352
• Take Profit:
o TP1: 3384
o TP2: 3400
🎯 For experienced traders, it is advised to observe price action at the target support zones and look for real-time reversal signals to optimize entry timing.
Gold Bullish Momentum still strongGeneral trend and momentum is still to the upside. We now have a nice pullback and an opportunity to buy low again. Price is currently reacting to an H1 TF demand zone. If this zone breaks, look for entries in H4 demand and continue to ride the bulls to All Time Highs.

How can we seize the golden opportunity steadily and accurately?Yesterday, gold showed a trend of falling first and then rising to bottom out and rebound. After falling back to 3351, it quickly rebounded to around 3377. The overall fluctuation rhythm was highly consistent with our prediction. We accurately grasped the opportunity to arrange long orders and promptly notified the high position to reduce positions and make profits. The rhythm was properly controlled and we gained good returns.
From a technical point of view, the four-hour line fell and rebounded, and the short-term short momentum slowed down. Although it has not completely turned into a long structure, the short trend is no longer valid. At this stage, we will not look at new lows for the time being, and the operation is mainly based on the main long idea. At the daily level, pay attention to the long-short watershed of 3385. If it breaks through this level, it is expected to open up the upward space and look to 3392 or even above 3400; if it does not break, the market may continue the shock and wash pattern. Pay attention to the support below around 3365-3350. As long as it does not break and stabilizes, you can still choose to arrange low and long positions. In the short term, pay attention to the breakthrough of the rebound high point 3377. If it successfully stands firm, it will further enhance the continuity of the long position.

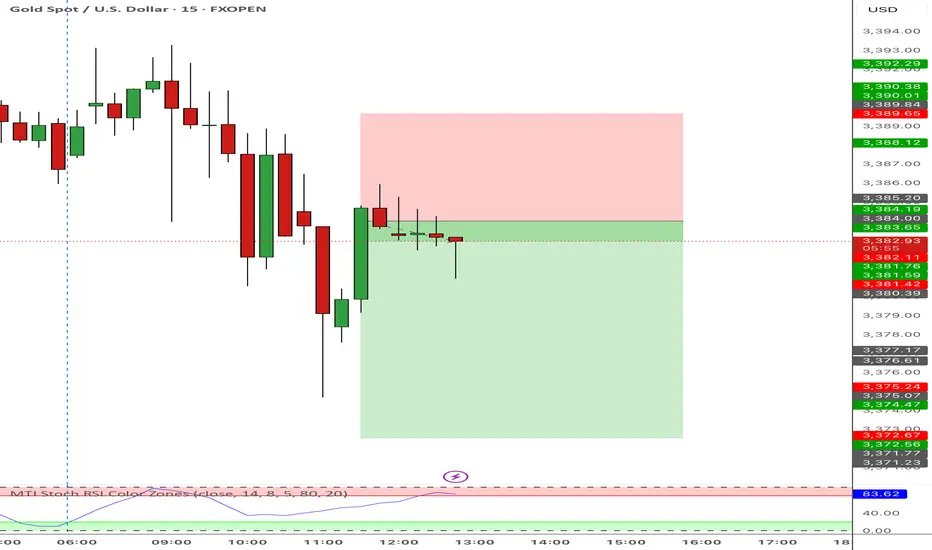
Gold is under pressure, shorts aim at 3310Gold is under pressure, shorts aim at 3310
Gold technical analysis and trading strategy: key support faces test, weak rebound, beware of breakout risk
Fundamental driving factors
The stabilization of the US dollar index suppresses gold prices: recent US economic data (such as retail sales, initial jobless claims) show resilience, the market's expectations for the Fed's rate cuts have been postponed, and US Treasury yields have rebounded, weakening the attractiveness of interest-free assets such as gold.
Risk aversion cools down: The situation in the Middle East has not escalated yet, and the rebound in US stocks has weakened the safe-haven demand for gold.
Fund flow: ETF holdings data show that institutional investors have continued to reduce their holdings of gold recently, reflecting that market sentiment is cautious.
Key technical signals
1. 4-hour cycle: oscillating bearish structure
Clear suppression: The overnight rebound high of 3375 (38.2% Fibonacci retracement level) constitutes a short-term strong and weak boundary, and the price has failed to stand firm here, indicating that bullish momentum is insufficient.
Support overlap: The 3340-35 area is the resonance area of the 4-hour trend line support and the Fibonacci downward target (3335-40). If it is lost, the downward space will be opened to 3320-3300.
Indicator divergence: The MACD histogram is shrinking and the fast and slow lines are close to the zero axis, and the RSI is hovering below 50, suggesting that the rebound momentum is exhausted.
2. 1-hour cycle: short-term technical structure is formed
Descending channel: Thursday's high of 3395 and the current high of 3377 form a secondary high point. Connecting the low point of the hourly chart can draw a descending channel, and the price runs along the lower track of the channel.
Key watershed: 3350 (61.8% retracement level) is a short-term long and short battle point. After breaking it, it will accelerate the test of 3340-35.
Today's trading strategy
Direction: Rebound high and empty mainly, and follow up after breaking the support.
Entry:
Aggressive short order: 3368-3373 light position short test, stop loss above 3380, target 3345-3340.
Steady short order: If the price rebounds to 3375-3380 under pressure, add short position, stop loss 3385, target unchanged.
Take profit and risk control:
Partial reduction of position near the first target 3340, the remaining position observes the support strength of 3340-35.
If it quickly breaks below 3340, short can be chased to 3325-3320 (previous low of daily line).
Alternative plan:
If the price unexpectedly breaks through 3380 and stabilizes, short position needs to be exited, wait and see the 3390-3400 pressure zone and then choose the opportunity to layout.
Key Tips
Don’t blindly buy the bottom: The current technical structure has not shown a bottom signal. Although the 3340-35 area is support, if it is accompanied by a large negative line break, it may trigger long stop-loss orders.
Data risk: Pay attention to the US PMI data in the evening. If it is stronger than expected, it may strengthen the dollar to suppress gold prices.