Gold Analysis and Trading Strategy | July 16✅ Fundamental Analysis
The U.S. Dollar Index has risen for four consecutive trading days, reaching a high of 98.70, which continues to weigh on gold prices denominated in dollars. Recently, the Trump administration imposed a 30% tariff on goods from the European Union and Mexico, and plans to issue tariff notices to Indonesia (19%) and several other “smaller countries” (around 10%), triggering global trade tensions. Meanwhile, the ongoing escalation of the Russia–Ukraine conflict has increased safe-haven demand, providing some support for gold.
✅ Technical Analysis
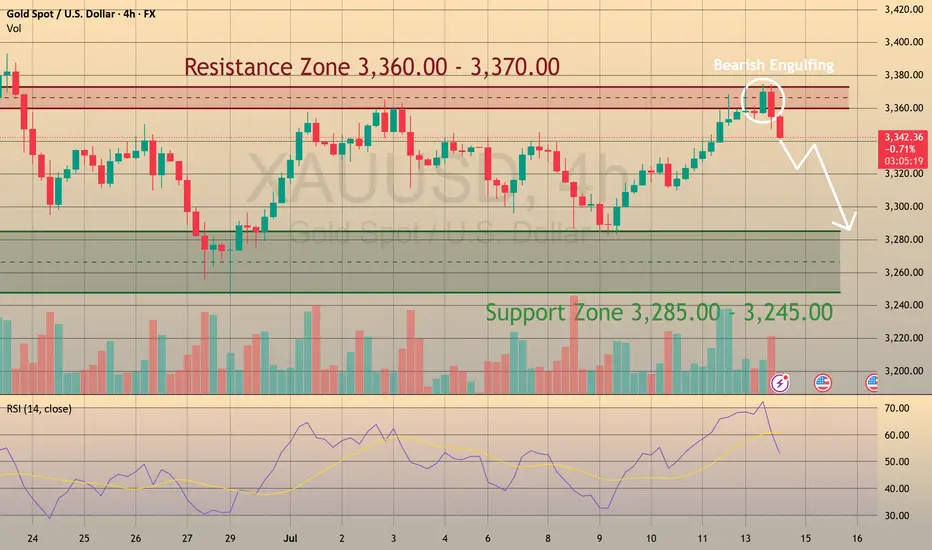
Gold posted a long upper shadow bearish candlestick yesterday, indicating weak upward momentum and selling pressure near recent highs. The daily chart has shown multiple failures to break above previous highs, signaling fading bullish strength. Currently, price action remains in a high-level, low-volume consolidation, with both daily and weekly charts showing repetitive sideways movement and no clear breakout direction.
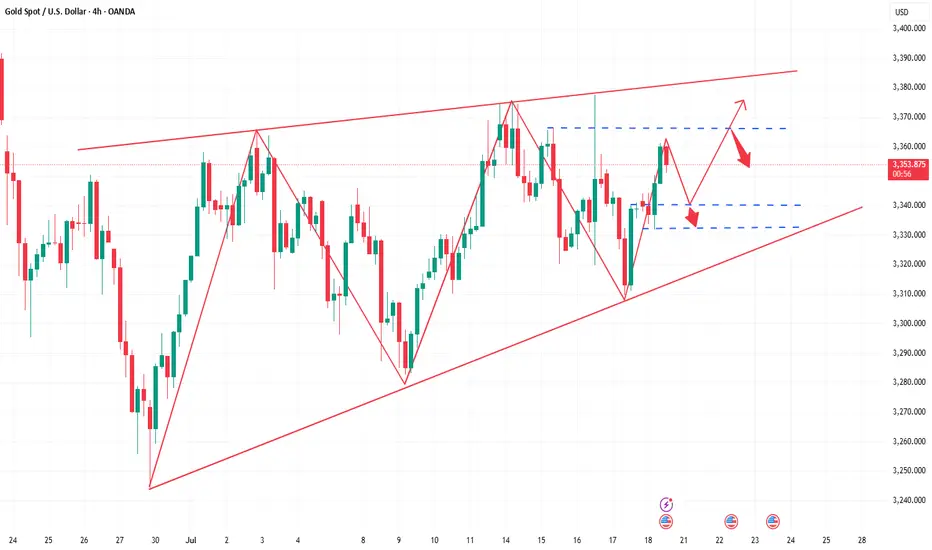
On the 4-hour chart, gold was rejected near the upper range at $3375 and fell sharply. After breaking below the mid-range support, the price found minor support near the lower band. The overall structure remains a wide-range consolidation, lacking sustained directional movement.
🔴 Key Resistance Levels: 3345–3350; if broken, gold may test the 3400 psychological level.
🟢 Key Support Levels: 3322–3330; if breached, prices could decline further toward 3300.
✅ Trading Strategy Reference
🔺 Long Position Strategy:
🔰If the price pulls back to below the $3325–$3330 zone and shows signs of support, consider entering a light long position. Set a stop-loss below $3310, targeting $3340–$3350–$3360.
🔻 Short Position Strategy:
🔰If the price rebounds to the $3344–$3350 resistance zone and stalls, consider shorting on strength. Set a stop-loss above $3355, with targets at $3320, $3310, and $3300.
✅ Risk Warning
The U.S. PPI data will be released today. If the data significantly exceeds expectations and inflationary pressures rise, gold may come under renewed selling pressure and potentially break below the key $3300 support level. Conversely, if the data is moderate, it could ease market concerns and help stabilize gold prices.
XAUUSDK trade ideas

Elliott Wave Analysis – XAUUSD July 16, 2025🔄 Momentum Analysis
D1 timeframe: Momentum is currently reversing to the downside, suggesting that the price may continue to decline or move sideways in the short term.
H4 timeframe: Momentum is rising, indicating that the current recovery may continue. The next resistance zones to watch are 3342 and 3358.
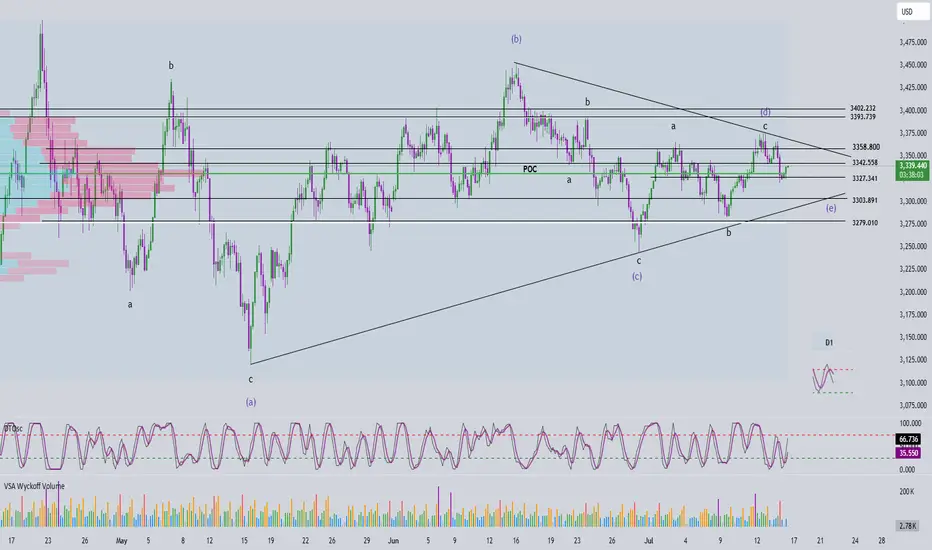
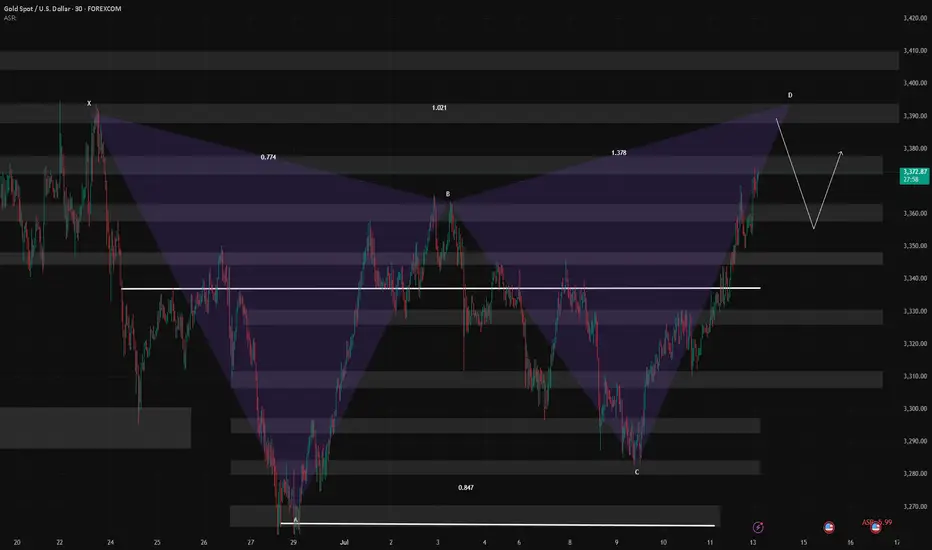
🌀 Elliott Wave Structure
At present, price action is being compressed within a contracting triangle corrective pattern, with its range narrowing further—signaling market consolidation. We should closely monitor for signs of a breakout that could end this correction.
Based on the current wave structure, it is expected that wave d (green) has completed, and the current downward move is likely part of wave e (green).
The trading strategy focuses on waiting for the price to approach the lower boundary of the triangle—drawn from the low of wave a to the low of wave c—looking for confluent support areas near this trendline to identify a potential BUY opportunity.
🎯 Target & Trade Plan
BUY ZONE: 3303 – 3300
Stop Loss (SL): 3290
Take Profits (TP):
- TP1: 3327
- TP2: 3358
- TP3: 3402
As risk aversion wavers, will gold rise or fall?
💡Message Strategy
After falling for two consecutive days, gold (XAU/USD) rebounded slightly in the Asian session on Wednesday, stabilizing above $3,320, attracting some bargain-hunting buyers. The market has paid close attention to the tariff policy that US President Trump continues to increase, and the rising risk aversion has become the core factor supporting gold prices.
The US CPI data for June showed that overall prices rose by 0.3% month-on-month, the largest increase in five months, and the core CPI rose to 2.9% year-on-year, both higher than expected. This has caused the market to worry that tariffs are gradually pushing up inflation, prompting the Federal Reserve to extend the high interest rate policy cycle.
📊Technical aspects
The current trend of gold is constrained by both fundamentals and technical factors.
On the one hand, Trump's tariff policy has pushed up inflation expectations, triggering risk aversion and rethinking of the Fed's policy path, providing support for gold;
On the other hand, the Fed's tone of "maintaining high interest rates for longer" has limited the room for gold prices to rebound.
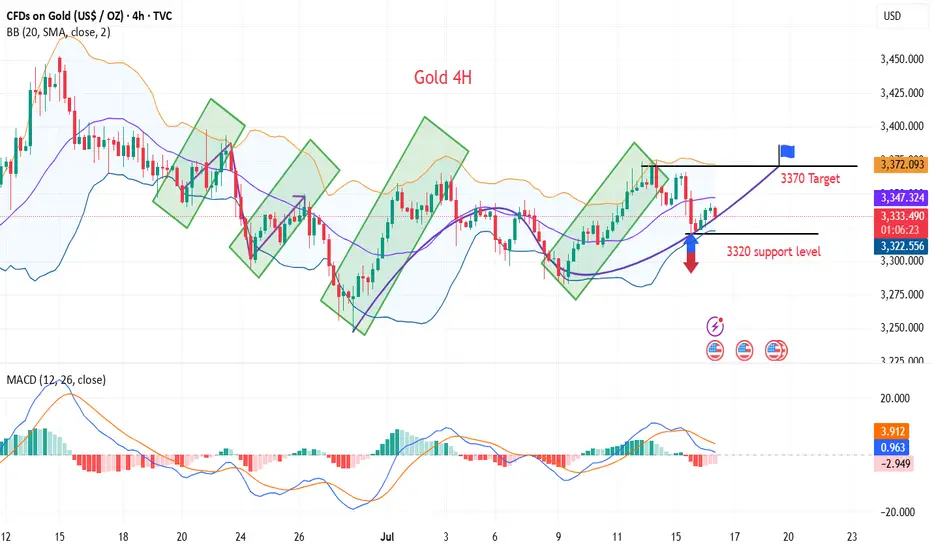
From the 4-hour chart, gold prices found support near the 100-period SMA (about $3,320) on Tuesday, stopping the decline from the three-week high. In the short term, if it can stand above the 3340-3345 resistance band, it may test the 3365-3370 area again, and the further target is the 3400-dollar round mark.
💰Strategy Package
Long Position:3320-3330,SL:3305,Target: 3365-3370
BUY XAUUSD 16.7.2025Trend Resumption at H1: BUY at M15
Type of order: Limit order
Reason:
- The price brokeout the sub key of M15, confirming the uptrend into main key M15.
Note:
- Management of money carefully at the price of sub key M15 (3335)
Set up entry:
- Entry buy at 3325
- SL at 3319
- TP1: 3335
- TP2: 3347
Trading Method: Price action (No indicator, only trend and candles)

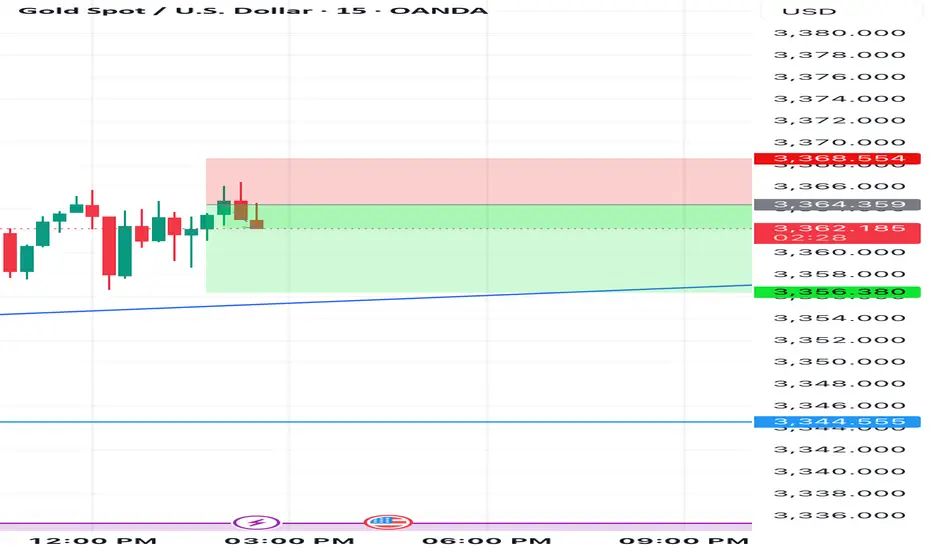
GOLD BUY M15 Gold (XAU/USD) 15-Min Chart Analysis – July 15, 2025
The price is currently trading around 3,352, having recently shown a Change of Character (CHoCH) indicating a potential bullish reversal. After a drop from the recent highs, price is now approaching a highlighted demand zone (purple box) between approximately 3,342 – 3,349, which could act as a strong support area.
Trade Setup:
Buy Zone: Inside the purple demand zone (approx. 3,342 – 3,349)
Stop Loss (SL): 3,342
Target (TP): 3,365
Key Levels:
Resistance Levels:
3,355
3,360
3,365 (Target)
3,370 (Potential extension)
Support Levels:
3,349
3,342 (Stop Loss)
3,341 (Strong Low zone)
Expectation:
If price reacts positively from the demand zone and holds above the support, we can expect a bullish move towards the target of 3,365, breaking through intermediate resistance levels.

Daily gold analysisDaily gold analysis
Sell trade with target and stop loss as shown in the chart
The trend is down and we may see more drop in the coming period in the medium term
All the best, I hope for your participation in the analysis, and for any inquiries, please send in the comments.
He gave a signal from the strongest areas of entry, special recommendations, with a success rate of 95%, for any inquiry or request for analysis, contact me
GOLD Intraday Chart Update For 15 July 2025Hello Traders,
Welcome to the US CPI Day, as you can see that market is in tight range for now and all eyes on the breakout for now
Only clear breakout of 3380 we will consider market will be bullish towards 3400 & 3425
If markets sustains below 3335 it will move towards 3305 or even 3285
All eyes on US CPI
Disclaimer: Forex is Risky

XAUUSDGold was updated on a 15-minute timeframe and appears to be in a correction to the 3357 range.

Big Week for Markets: U.S. CPI Tomorrow – What It Means for GoldThis week is packed with news, but the main focus is the U.S. CPI report dropping tomorrow.
🗓 Key Event: U.S. CPI Report
📍 July 15, 2025 | 12:30 p.m. UTC
The CPI report measures inflation and heavily influences the Fed’s rate decisions. Last month’s CPI came in at 2.4% vs. 2.5% expected, following 2.3% vs. 2.4% in April. While it seems inflation is rising, the bigger picture shows stable annual inflation in the 2.3%–3.0% range, keeping things under control—likely the reason Trump is pressuring Powell to cut rates.
Market expects June CPI to be 2.7%.
🤔 Possible Scenarios:
1️⃣ CPI > 2.7%: Bullish for DXY 📈. The stronger the print, the bigger the spike, but I see this scenario as less probable.
2️⃣ CPI < 2.7%: Bearish for DXY 📉. We may see a USD dump, though likely shallow since CPI could still be higher than previous months.
✨ What About Gold?
I don’t expect a major reaction in gold:
✅ Higher CPI? Gold often benefits as an inflation hedge.
✅ Lower CPI? Also supportive for gold as it weighs on the USD.
🔍 Technical Outlook:
Gold has been trading within a triangle since April 22, forming lower highs and higher lows. We may currently be in Wave D (Elliott Wave), aiming toward the triangle’s upper boundary slightly above $3,400 resistance. After that, Wave E may develop – but that’s a story for another post.
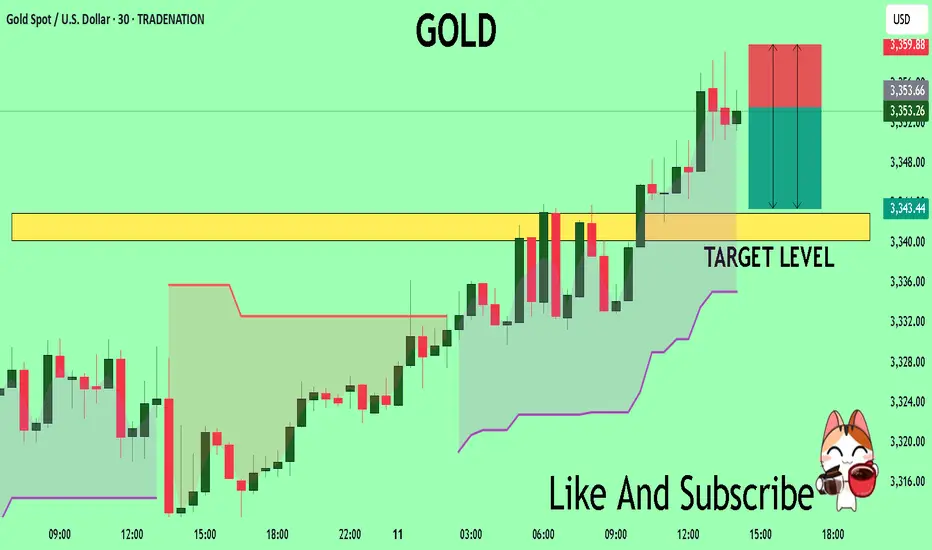
GOLD: Long Signal Explained
GOLD
- Classic bullish formation
- Our team expects growth
SUGGESTED TRADE:
Swing Trade
Buy GOLD
Entry Level - 3352.0
Sl - 3346.8
Tp - 3362.4
Our Risk - 1%
Start protection of your profits from lower levels
Disclosure: I am part of Trade Nation's Influencer program and receive a monthly fee for using their TradingView charts in my analysis.
❤️ Please, support our work with like & comment! ❤️

XAUUSD: SCALPING SIGNALEntry: 3355:66
SL: 3369
TP: 3341 (continue unless any bullish pattern emerged)


7/14: Sell High, Buy Low Within the 3400–3343 Range for GoldGood morning, everyone!
At the end of last week, renewed trade tariff concerns reignited risk-off sentiment, prompting a strong rally in gold after multiple tests of the 3321 support level. The breakout was largely driven by fundamental news momentum.
On the daily (1D) chart, the price has fully reclaimed the MA60 and broken above the MA20, signaling an emerging bullish trend. The key focus for this week includes:
Monitoring whether MA20 holds as support on any pullbacks
Watching the 3400 resistance zone for signs of exhaustion or continuation
From a 30-minute technical perspective, gold is currently trading within a short-term resistance band of 3372–3378, with a stronger resistance zone between 3387–3392. Key support levels are:
Primary support: around 3358
Secondary support: 3343–3332 zone
Given the recent increase in volatility due to geopolitical and macroeconomic headlines, flexible intraday trading is recommended within the 3378–3343 range, while broader trades can be framed around the 3400–3325 zone, still favoring a sell-high, buy-low approach.
Lastly, as we move into the mid-year period, I may have more personal commitments, and strategy updates could be less frequent. I appreciate your understanding, and as always, feel free to leave a message if you have any questions or need trading guidance—I’ll respond as soon as I can.

Gold begins bullish recoveryIon Jauregui – Analyst at ActivTrades
Gold posted a slight gain during Monday's Asian session, driven by renewed safe-haven demand amid escalating trade tensions between the United States and several key economies, as well as rising geopolitical uncertainty surrounding Russia and Ukraine.
The initial uptick in gold was supported by the announcement of 30% tariffs by Donald Trump on Mexico and the European Union, in addition to harsher levies on Japan, South Korea, and Brazil. The prospect of a renewed wave of protectionism has raised concerns over global economic stability, boosting gold's appeal as a safe-haven asset. Added to this is geopolitical tension following reports that Trump is planning to send offensive weapons to Ukraine, potentially escalating the conflict with Russia. These factors have reinforced risk-off sentiment in the markets.
However, the strength of the US dollar (DXY +0.1%) and anticipation ahead of the US CPI data, due Tuesday, are capping gold’s upside. Higher-than-expected inflation could reinforce expectations of a tighter monetary policy from the Federal Reserve, which would weigh on precious metals.
After reaching an intraday high of $3,361.42 per ounce, the Asian market closed lower, leaving gold at $3,356.66 per ounce, a level at which it has since consolidated ahead of the European open. This behavior reflects a technical pause in the initial bullish momentum, with the current point of control aligning with that same price zone, suggesting a temporary neutralization of buying pressure. The RSI at 54% confirms a lack of strength, while the MACD indicates a potential upward directional shift with a signal line crossover and a modestly green histogram to start the week. Moving average crossovers show the 50 and 100 SMAs supporting the bullish push that began last Wednesday. Gold’s next decisive move may depend on upcoming US inflation data and developments in geopolitical tensions.
Silver, meanwhile, stood out with a sharp 1.4% surge to $39.493 per ounce, its highest level since 2011, while platinum and copper delivered mixed performances.
This week, gold prices could be driven by the confirmation of elevated US inflation data, which would strengthen the metal's role as a hedge against purchasing power loss, especially if doubts persist regarding the Fed’s policy stance. Added to this are rising geopolitical tensions due to Trump’s potential delivery of offensive weapons to Ukraine, further protectionist measures that could worsen the global trade war, and increased risk aversion should equity markets react negatively. In this context, gold is positioned as one of the main beneficiaries amid growing economic and political uncertainty.
*******************************************************************************************
The information provided does not constitute investment research. The material has not been prepared in accordance with the legal requirements designed to promote the independence of investment research and such should be considered a marketing communication.
All information has been prepared by ActivTrades ("AT"). The information does not contain a record of AT's prices, or an offer of or solicitation for a transaction in any financial instrument. No representation or warranty is given as to the accuracy or completeness of this information.
Any material provided does not have regard to the specific investment objective and financial situation of any person who may receive it. Past performance and forecasting are not a synonym of a reliable indicator of future performance. AT provides an execution-only service. Consequently, any person acting on the information provided does so at their own risk. Political risk is unpredictable. Central bank actions can vary. Platform tools do not guarantee success. Regulated status does not guarantee security.

check the trendIt is expected that the upward trend will pass the resistance range and with the stabilization above this range, we will see the continuation of the upward trend.
If the price crosses the support trend line, the continuation of the correction will be formed. And with the failure of the support range, the beginning of the downtrend of the scenario will be likely.

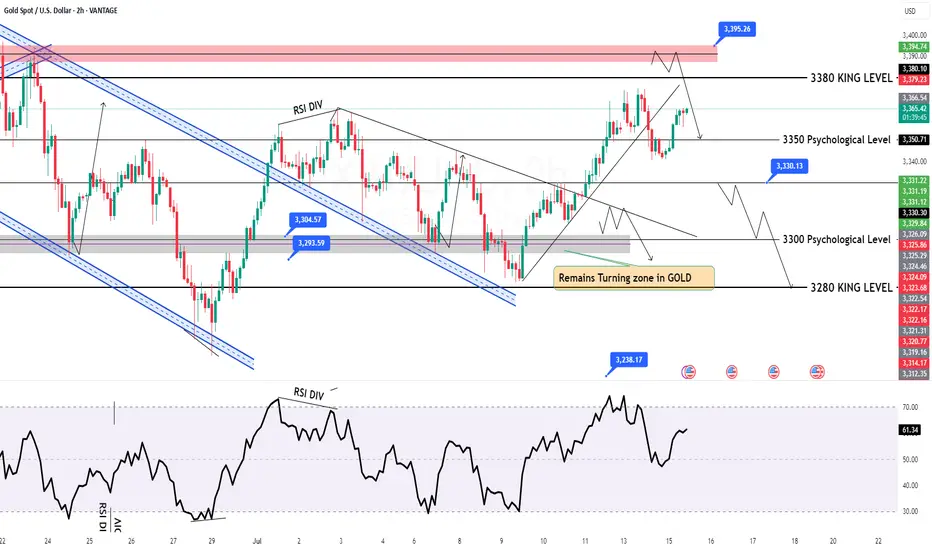
XAUUSD Analysis : Bullish Move Toward Key Resistance + Target🟩 Overview:
Gold is currently showing a clear bullish breakout on the 2-hour timeframe. The market structure has shifted from a downtrend into a bullish phase, with price now approaching a critical Reversal Zone. Let’s break down the key levels, structure shifts, and potential trade opportunities.
🔍 1. Structure Shift – Trendline Break & BOS Signals:
The price previously followed a Blue Ray Descending Trendline, which acted as dynamic resistance and guided the bearish trend.
As highlighted, “Blue Ray Always Continue Trend” – but in this case, we’ve seen a clean Break of Structure (BOS) that invalidated the bearish setup.
A Minor BOS occurred first, which hinted at weakening selling pressure.
Later, a Major BOS confirmed the bullish transition as the price broke above a key resistance level with strong momentum.
This transition was supported by consistent higher lows and a breakout above the descending resistance trendline — a classic reversal signal.
🟩 2. Demand Zone Reaction – Major Support Held Firm:
The Major Support Zone between $3,280 – $3,300 provided a strong base for buyers.
Multiple wick rejections and bullish engulfing patterns near this zone indicated aggressive buyer interest.
This support has now become the foundation for the recent bullish rally.
🎯 3. Next Target & Reversal Zone:
The current price is hovering around $3,358, showing strong bullish momentum.
The next major resistance area is marked between $3,380 – $3,400, identified as the Next Target + Reversal Zone.
This zone is critical — it aligns with a historical supply area and the previous market swing highs.
Traders should be cautious here, as price may react sharply. Reversal patterns (like bearish engulfing, pin bars, or double tops) could signal a potential retracement.
⚠️ 4. Trade Plan:
🟢 Bullish Bias (Short-Term):
If you entered from the support or trendline breakout, continue to hold long positions until price nears the reversal zone.
Trail stop-loss under the most recent higher low to secure profits.
🔴 Bearish Scenario (Near-Term Reversal Play):
Watch for bearish rejection patterns in the $3,380 – $3,400 zone.
If confirmation appears, potential short setups could offer a retracement back to $3,330 – $3,320.
📌 Key Levels Summary:
Major Support Zone: $3,280 – $3,300 ✅
Next Target + Reversal Zone: $3,380 – $3,400 ⚠️
Current Price: $3,358
Major BOS Level: Confirmed
Trendline: Broken with strong bullish pressure
🧠 Final Thoughts:
Gold has officially shifted gears. The bullish breakout is in motion, and the trendline break + BOS combo supports further upside — at least until the reversal zone is tested. However, this is also where the market could exhaust, making it crucial to monitor price action closely.
Stay patient, wait for confirmation, and let the levels guide your next move.

GOLD Massive Short! SELL!
My dear friends,
My technical analysis for GOLD is below:
The market is trading on 3353.5 pivot level.
Bias - Bearish
Technical Indicators: Both Super Trend & Pivot HL indicate a highly probable Bearish continuation.
Target - 3343.00
Recommended Stop Loss - 3359.88
About Used Indicators:
A pivot point is a technical analysis indicator, or calculations, used to determine the overall trend of the market over different time frames.
Disclosure: I am part of Trade Nation's Influencer program and receive a monthly fee for using their TradingView charts in my analysis.
———————————
WISH YOU ALL LUCK
How to seize deterministic trading opportunities?The rebound momentum of the gold market has been significantly enhanced today. After breaking through the 3345 resistance in the Asian session, it has continued to rise. It has now reached around 3360, and has rebounded by more than US$50 from this week's low of 3310, setting a new rebound high in the past three trading days. After the gold price effectively broke through the key resistance band of 3340–3350, it triggered some short stop loss trading and trend funds to enter the market, driving the price to accelerate the upward trend. Judging from the hourly chart, the trading volume has increased by about 30% compared with the same period yesterday, indicating that the market's recognition of this round of rebound has increased significantly.
A physically full sun candle chart has been closed in the 4-hour cycle, successfully standing on the Bollinger middle track, further confirming the upward structure, the mid-track support area 3340–3345 has become a key position for bulls' defense, and the short-term structure of the market is still relatively strong. Overall, the intraday retracement range of gold is limited, and the probability of continuing to rise is relatively high. In terms of strategy, it is still recommended to go long. In the short term, focus on the 3340–3345 area retracement support, and the stop-profit target is 3365–3370; if the upward breakthrough, pay attention to the suppression performance of the 3370–3375 line, beware of highs and falls, and pay attention to controlling risks.
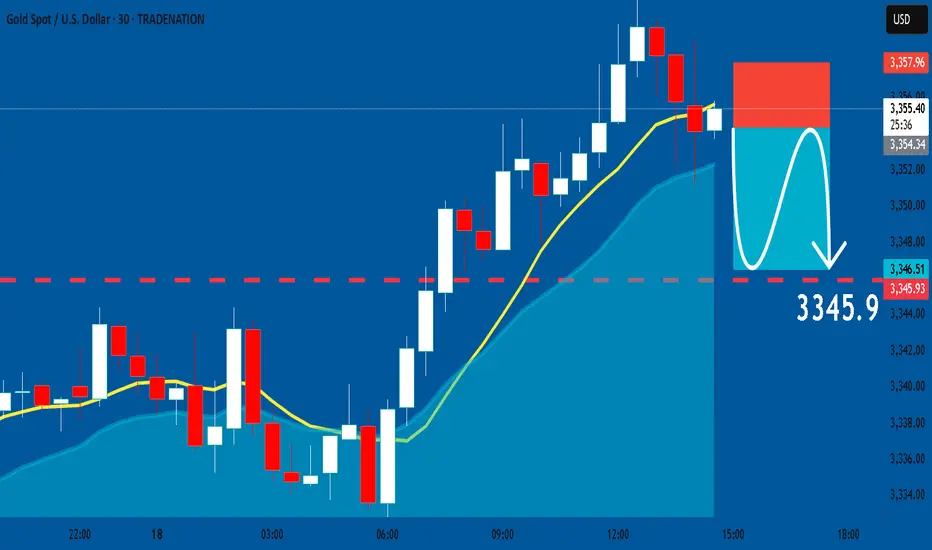
GOLD: Short Trade Explained
GOLD
- Classic bearish pattern
- Our team expects retracement
SUGGESTED TRADE:
Swing Trade
Sell GOLD
Entry - 3354.53
Stop - 3357.9
Take - 3345.9
Our Risk - 1%
Start protection of your profits from lower levels
Disclosure: I am part of Trade Nation's Influencer program and receive a monthly fee for using their TradingView charts in my analysis.
❤️ Please, support our work with like & comment! ❤️
Xausd techinical analysis.Xausd techinical analysis next move posibale at h1 time frame.not finchinal advice.

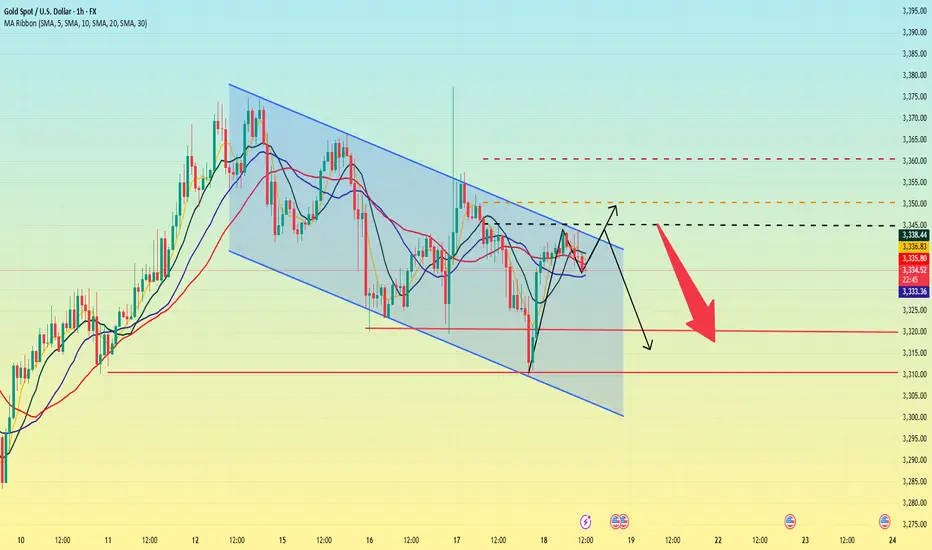
Gold is in danger. Could it fall?Gold started to fall slowly after the Asian market opened on Thursday, and continued to fluctuate and fall in the European market. The impact of the initial data in the US market fell sharply to around 3310, then stabilized and rose. It reached a high of around 3341 and then maintained a high sideways fluctuation, and the daily line closed with a negative line.
The price trend of gold this week was erratic. On Wednesday, it rose and fell, closing with a positive line, indicating that there was strong resistance above; on Thursday, it fell and rebounded, closing with a negative line, indicating that there was some support below. The current moving average system is chaotic, which further confirms that the overall situation is in a wide range of fluctuations.
Connecting the highs and lows of this week can form a fluctuating downward channel, which still has an important guiding role in the market. The current channel resistance is at 3345. If the gold price can break through this resistance level, it is expected to open up further upward space; and the channel support is around 3320. Once it falls below, it may trigger a new round of decline.
Overall, the upward resistance levels of gold are 3345, 3350, and 3360; the downward support levels are around 3320 and 3310. Operation strategy:
Short around 3350, stop loss at 3360, profit range 3330-3310.
Long near 3315, stop loss 3305, profit range 3330-3350.