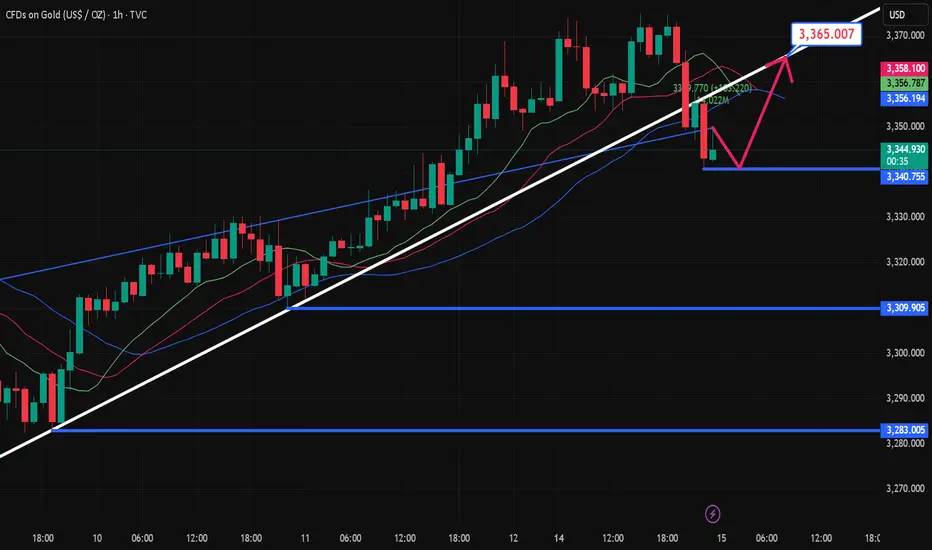
7.15 Gold Market Analysis and Operation SuggestionsFrom the 4-hour analysis, the short-term support below focuses on the neckline of the hourly line of last Friday, 3340-45, and focuses on the support of 3325-30. The intraday retracement continues to follow the trend and the main bullish trend remains unchanged. The short-term bullish strong dividing line focuses on the 3325 mark. The daily level stabilizes above this position and continues to follow the trend and bullish rhythm. Before falling below this position, continue to follow the trend and follow the trend. Maintain the main tone of participation.
Gold operation strategy:
1. Go long when gold falls back to 3340-45, and add more when it falls back to 3325-30, stop loss 3317, target 3365-70, and continue to hold if it breaks;
XAUUSDK trade ideas
Big Week for Markets: U.S. CPI Tomorrow – What It Means for GoldThis week is packed with news, but the main focus is the U.S. CPI report dropping tomorrow.
🗓 Key Event: U.S. CPI Report
📍 July 15, 2025 | 12:30 p.m. UTC
The CPI report measures inflation and heavily influences the Fed’s rate decisions. Last month’s CPI came in at 2.4% vs. 2.5% expected, following 2.3% vs. 2.4% in April. While it seems inflation is rising, the bigger picture shows stable annual inflation in the 2.3%–3.0% range, keeping things under control—likely the reason Trump is pressuring Powell to cut rates.
Market expects June CPI to be 2.7%.
🤔 Possible Scenarios:
1️⃣ CPI > 2.7%: Bullish for DXY 📈. The stronger the print, the bigger the spike, but I see this scenario as less probable.
2️⃣ CPI < 2.7%: Bearish for DXY 📉. We may see a USD dump, though likely shallow since CPI could still be higher than previous months.
✨ What About Gold?
I don’t expect a major reaction in gold:
✅ Higher CPI? Gold often benefits as an inflation hedge.
✅ Lower CPI? Also supportive for gold as it weighs on the USD.
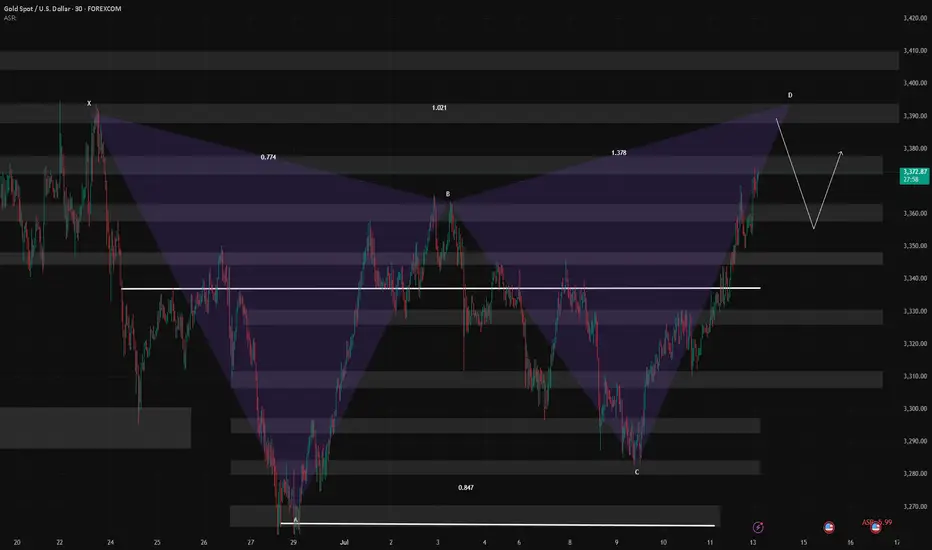
🔍 Technical Outlook:
Gold has been trading within a triangle since April 22, forming lower highs and higher lows. We may currently be in Wave D (Elliott Wave), aiming toward the triangle’s upper boundary slightly above $3,400 resistance. After that, Wave E may develop – but that’s a story for another post.
GOLD: Long Signal Explained
GOLD
- Classic bullish formation
- Our team expects growth
SUGGESTED TRADE:
Swing Trade
Buy GOLD
Entry Level - 3352.0
Sl - 3346.8
Tp - 3362.4
Our Risk - 1%
Start protection of your profits from lower levels
Disclosure: I am part of Trade Nation's Influencer program and receive a monthly fee for using their TradingView charts in my analysis.
❤️ Please, support our work with like & comment! ❤️


7/14: Sell High, Buy Low Within the 3400–3343 Range for GoldGood morning, everyone!
At the end of last week, renewed trade tariff concerns reignited risk-off sentiment, prompting a strong rally in gold after multiple tests of the 3321 support level. The breakout was largely driven by fundamental news momentum.
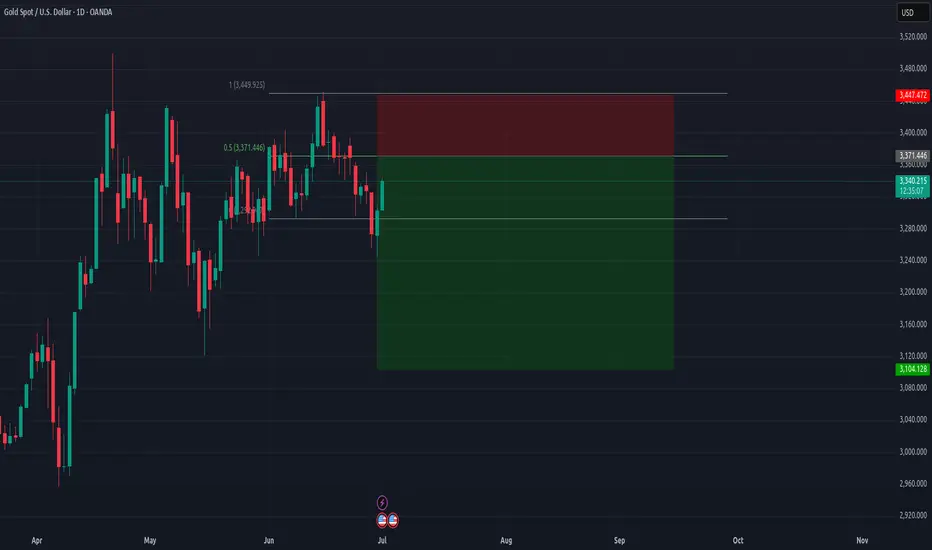
On the daily (1D) chart, the price has fully reclaimed the MA60 and broken above the MA20, signaling an emerging bullish trend. The key focus for this week includes:
Monitoring whether MA20 holds as support on any pullbacks
Watching the 3400 resistance zone for signs of exhaustion or continuation
From a 30-minute technical perspective, gold is currently trading within a short-term resistance band of 3372–3378, with a stronger resistance zone between 3387–3392. Key support levels are:
Primary support: around 3358
Secondary support: 3343–3332 zone
Given the recent increase in volatility due to geopolitical and macroeconomic headlines, flexible intraday trading is recommended within the 3378–3343 range, while broader trades can be framed around the 3400–3325 zone, still favoring a sell-high, buy-low approach.
Lastly, as we move into the mid-year period, I may have more personal commitments, and strategy updates could be less frequent. I appreciate your understanding, and as always, feel free to leave a message if you have any questions or need trading guidance—I’ll respond as soon as I can.

XAU/USD: Analysis and Strategy Amid Trade ConflictsA rate cut this month is highly unlikely, with the earliest possible delay to September. Currently, the gold market trend is still dominated by tariff factors. Although the tariff war was extended for 90 days in April, the 10% base tariff imposed on all trading countries during this period has already made the total tax revenue of these three months reach 70% of that in previous years.
Trump's launch of the tariff war has clear core goals: first, to directly increase U.S. fiscal revenue; second, to boost exports through policy inclination, while helping enterprises increase profits to expand the tax base; third, to promote the growth of domestic employment. Just last weekend, his administration announced that it would impose a 30% tariff on the European Union and Mexico, and the new regulations will take effect on August 1.
Against this backdrop, the escalation of trade conflicts has become increasingly obvious. For gold, this means continuous and strong support, and the certainty of its upward logic has been further enhanced. From a long-term perspective, the gold market is not expected to see a deep correction in the second half of the year.
After pulling back to around $3,280 last week, the price has embarked on a sustained upward trajectory and now fluctuates within the range of $3,345-$3,380. For this interval, a strategy of buying low and selling high would be appropriate.
I am committed to sharing trading signals every day. Among them, real-time signals will be flexibly pushed according to market dynamics. All the signals sent out last week accurately matched the market trends, helping numerous traders achieve substantial profits. Regardless of your previous investment performance, I believe that with the support of my professional strategies and timely signals, I will surely be able to assist you in breaking through investment bottlenecks and achieving new breakthroughs in the trading field.

GOLD LONG TERMGold made a good push from 3250 and back up over 1000 pips.
Additionally, a break above 3340 failed, making a lower low below, opening up opportunity for further drops.
Also a perfect equal lows at 3250. Let's see if price sets up retracement sells from 3360-70 zone.
Gold begins bullish recoveryIon Jauregui – Analyst at ActivTrades
Gold posted a slight gain during Monday's Asian session, driven by renewed safe-haven demand amid escalating trade tensions between the United States and several key economies, as well as rising geopolitical uncertainty surrounding Russia and Ukraine.
The initial uptick in gold was supported by the announcement of 30% tariffs by Donald Trump on Mexico and the European Union, in addition to harsher levies on Japan, South Korea, and Brazil. The prospect of a renewed wave of protectionism has raised concerns over global economic stability, boosting gold's appeal as a safe-haven asset. Added to this is geopolitical tension following reports that Trump is planning to send offensive weapons to Ukraine, potentially escalating the conflict with Russia. These factors have reinforced risk-off sentiment in the markets.
However, the strength of the US dollar (DXY +0.1%) and anticipation ahead of the US CPI data, due Tuesday, are capping gold’s upside. Higher-than-expected inflation could reinforce expectations of a tighter monetary policy from the Federal Reserve, which would weigh on precious metals.
After reaching an intraday high of $3,361.42 per ounce, the Asian market closed lower, leaving gold at $3,356.66 per ounce, a level at which it has since consolidated ahead of the European open. This behavior reflects a technical pause in the initial bullish momentum, with the current point of control aligning with that same price zone, suggesting a temporary neutralization of buying pressure. The RSI at 54% confirms a lack of strength, while the MACD indicates a potential upward directional shift with a signal line crossover and a modestly green histogram to start the week. Moving average crossovers show the 50 and 100 SMAs supporting the bullish push that began last Wednesday. Gold’s next decisive move may depend on upcoming US inflation data and developments in geopolitical tensions.
Silver, meanwhile, stood out with a sharp 1.4% surge to $39.493 per ounce, its highest level since 2011, while platinum and copper delivered mixed performances.
This week, gold prices could be driven by the confirmation of elevated US inflation data, which would strengthen the metal's role as a hedge against purchasing power loss, especially if doubts persist regarding the Fed’s policy stance. Added to this are rising geopolitical tensions due to Trump’s potential delivery of offensive weapons to Ukraine, further protectionist measures that could worsen the global trade war, and increased risk aversion should equity markets react negatively. In this context, gold is positioned as one of the main beneficiaries amid growing economic and political uncertainty.
*******************************************************************************************
The information provided does not constitute investment research. The material has not been prepared in accordance with the legal requirements designed to promote the independence of investment research and such should be considered a marketing communication.
All information has been prepared by ActivTrades ("AT"). The information does not contain a record of AT's prices, or an offer of or solicitation for a transaction in any financial instrument. No representation or warranty is given as to the accuracy or completeness of this information.
Any material provided does not have regard to the specific investment objective and financial situation of any person who may receive it. Past performance and forecasting are not a synonym of a reliable indicator of future performance. AT provides an execution-only service. Consequently, any person acting on the information provided does so at their own risk. Political risk is unpredictable. Central bank actions can vary. Platform tools do not guarantee success. Regulated status does not guarantee security.

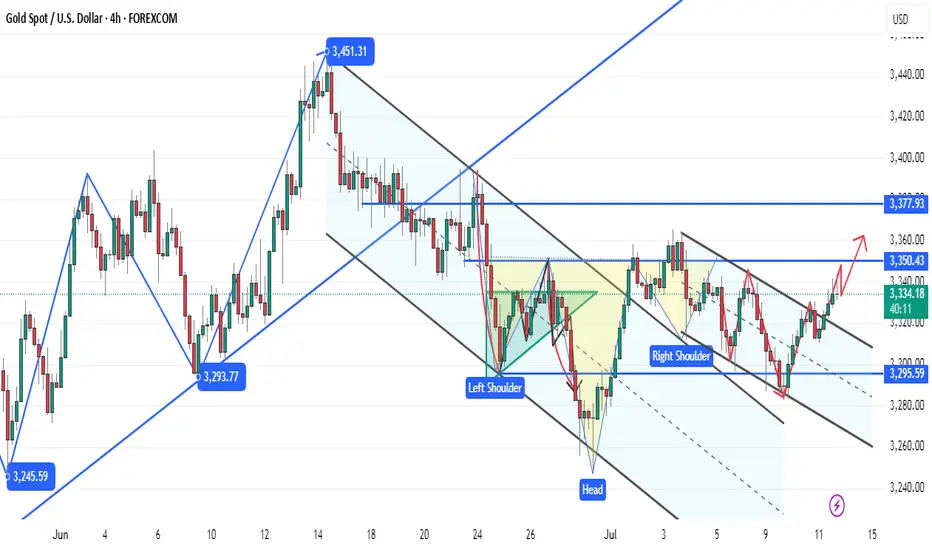
Gold (XAU/USD) 4-hour chart4-hour chart of Gold (XAU/USD)** showing a key technical setup near the \$3,344 level. Price action is testing a significant **resistance zone** highlighted in grey, with two possible scenarios unfolding from this level.
**Chart Analysis Overview:**
* Gold has been in a **bullish short-term trend**, forming higher lows and pushing above the **EMA 7, 21, and 50**, all converging near the \$3,324–\$3,331 area (acting as dynamic support).
* Price is now approaching a **multi-tested resistance zone** near \$3,360–\$3,390, where it has previously faced selling pressure.
* Volume is rising, supporting the current bullish momentum.
**Scenario 1: Bullish Breakout (Green Path)**
**Conditions:**
* Price breaks and holds above the \$3,360–\$3,390 resistance zone.
* Continued bullish momentum supported by trade tensions, safe-haven demand, and Fed uncertainty.
**Target:**
* First target: \$3,400
* Extension: \$3,420–\$3,440 zone if momentum strengthens.
**Invalidation:**
* Failure to hold above \$3,360–\$3,390 range could limit upside potential.
**Scenario 2: Bearish Rejection (Red Path)**
**Conditions:**
* Price gets rejected from the resistance zone (\$3,360–\$3,390).
* Fails to establish support above the breakout level and drops back below \$3,330.
**Target:**
* Immediate support at \$3,310–\$3,290
* Deeper correction towards \$3,260–\$3,220 if bearish pressure increases.
**Confirmation:**
* Look for bearish candlestick patterns near resistance (e.g., shooting star, bearish engulfing).
* Drop below EMA cluster (\$3,324–\$3,331) to confirm weakness.
**Conclusion:**
Gold is at a decision point near major resistance. A breakout above \$3,390 could extend the bullish rally, while failure to break this level may invite sellers and trigger a correction. Watch price action around this resistance for confirmation of the next move.

check the trendIt is expected that the upward trend will pass the resistance range and with the stabilization above this range, we will see the continuation of the upward trend.
If the price crosses the support trend line, the continuation of the correction will be formed. And with the failure of the support range, the beginning of the downtrend of the scenario will be likely.

XAUUSD BREAKOUT TRADE (READ CAPTION)hi trader's. what do you think about gold
current price: 3318
gold is breakout bullish trade line gold retest down side. then gold taking support and jump upside
support zone: 3314,3295
resistance zone :3345,3365
stop loss: 3282 market low

GOLD to the MoonHiper Clear Structure and the beginning of a new impulse towards 3.600 and 3.700
Hope everybody had a chance to got in
gg

The gold bull-bear game intensifiesThe gold bull-bear game intensifies: a breakthrough opportunity is hidden in the short-term shock
The gold market experienced violent fluctuations this week, and the core contradiction came from contradictory employment signals:
ADP cooling: The number of private sector jobs in the United States unexpectedly decreased in June, which once strengthened the expectation of a rate cut in September and pushed the gold price up
Non-farm counterattack: The subsequent non-farm employment announced exceeded expectations (206,000), which quickly extinguished the enthusiasm for rate cuts and gold prices gave up gains
Central bank support: Global central banks continue to buy gold (China increased its gold reserves in June), building a safety cushion for long-term prices
The essence of the "data fight" reflects that the resilience of the US economy remains, but cracks have appeared. The Federal Reserve dares neither cut interest rates too early (inflation risk) nor over-tighten (loosening of the employment market). This swing state will prolong the volatility cycle of gold, but every sharp drop is an opportunity for central banks and long-term investors to enter the market.
Technical aspect: Breakthrough signal of the four-hour chart
Current market characteristics:
Key position: 3344-3346 area has become the watershed between long and short positions. After three unsuccessful tests, the probability of this breakthrough has increased
Morphological structure: Breakthrough of the downward trend line of the four-hour chart + MACD golden cross, long arrangement of hourly moving average
Volume coordination: After yesterday's retracement to 3330 support, the volume rebounded, showing strong low-level support
Operation strategy:
Bull defense line: 3330-3325 (if broken, it will turn into shock)
Upward target:
▶ The first target is 3360 (previous high psychological position)
▶ The second target is 3380 (Fibonacci extension position)
▶ Ultimate target 3400 (option barrier)
Specific plan:
Conservatives:
Light long position at 3333-3335 (stop loss 3323)
After breaking through 3347, add more positions (stop loss 3335)
Radicals:
Batch layout above the current price of 3340, with 3325 as the ultimate defense
Risk warning:
⚠️ Beware of the volatility caused by Powell's speech on Friday night
⚠️ If 3320 is lost, beware of a deep correction to the 3300 mark
Currently, gold is in the "accumulation breakthrough" stage, with a bullish technical side but requiring fundamentals to cooperate. It is recommended to use the "small stop loss breakthrough" strategy, and it is better to miss it than to go against the trend. If it can stand firm at 3350 this week, it will no longer be a fantasy to look at 3400 in the third quarter.
A buy opportunity on gold!Price broke and retested the level of 3311.56 therefore, from the technical perspective, a double button pattern is already formed and the neckline is broke. So, buy opportunity is envisaged.

The latest gold analysis and strategy on July 10:
Core logic of the market
Risk aversion supports gold prices: Trump postponed tariffs but threatened to increase them in the future. Market concerns about trade frictions remain, and gold is still supported as a safe-haven asset.
Impact of the US dollar trend: If trade tensions escalate, the US dollar may be under pressure, which is further beneficial to gold.
Technical side is bullish and volatile: The daily line closed positive and stabilized the lower Bollinger track. The H4 cycle rebounded with consecutive positives, but it has not yet broken through the key resistance of 3345. Be wary of repeated fluctuations.
Key point analysis
Support level: 3310-3300 (short-term), 3285 (strong support)
Resistance level: 3340-3345 (Daily Bollinger middle track), 3365 (target after breakthrough)
Key day of change: The rebound may continue on Thursday. If it breaks through 3345, it may further attack 3365-3400 on Friday.
Trading strategy
1. Low-to-long (main strategy)
Entry point: 3310-3315 (retracement support area)
Stop loss: 3305 (prevent false breakthrough)
Target: 3325 (short-term), 3335-3345 (key resistance area)
Logic: H4 cycle continuous positive shows bullish momentum, and it is expected to continue to rebound after retracement support.
2. High-level short-selling auxiliary trading strategy (if key resistance is touched)
Entry point: 3340-3345 (first test resistance area)
Stop loss: 3350 (prevent breakout and upward movement)
Target: 3325-3320 (short-term correction)
Logic: 3345 is a strong pressure from the middle track of the daily Bollinger. You can short before breaking through, but you need to enter and exit quickly.
Key observation points
3345 breakthrough situation:
If it stands firmly at 3345, you can go long with a light position after the correction (target 3365, 3400).
If it falls under pressure, it may return to the 3310-3340 oscillation range.
3300 defense situation:
If it falls below 3300, it may fall back to 3285, and we need to be alert to short-term weakness.
Summary
Main idea: Low-long (3310-3315) as the main, target 3345, and look at 3365+ after breaking through.
Auxiliary strategy: 3340-3345 short, fast in and fast out.
Risk control: Strictly stop loss, avoid chasing up and selling down, and pay attention to the changes in the momentum of the US market.

XAU/USD 1H Outlook
FVG Fill (3320–3318)
Price is expected to drop into the unfilled Fair Value Gap between 3320 and 3318.
London/NY Liquidity Hunt
After filling the FVG, look for a swift bullish impulse during the London and New York sessions to trigger stop-runs and collect liquidity.
Downward Correction to 3305 & 3298
Once the liquidity grab completes, expect a retracement:
First target: 3305
On a break below 3305, next target is the unfilled FVG at 3298
Summary:
Drop → FVG fill (3320–3318) → Bullish liquidity hunt (London/NY) → Retracement toward 3305 (then 3298)

Perfect prediction, pay attention to the high short entry pointTrump extended the tariff agreement to August 1 and began to collect tariffs again. Although it eased market tensions, his remarks will not be extended after the expiration, and he issued a tariff threat, which increased global trade uncertainty and pushed up risk aversion. There was no clear direction coming out of the Fed's meeting minutes last night, but the potential bias was bullish.
At the beginning of the Asian session this morning, I also indicated that gold would rise and then fall. At present, it has reached the highest point near 3325 and then began to retreat, but the 4H golden cross has just been formed. There is still a certain pressure above 3333. If the gold price repeatedly competes for this position, we can continue to short without hesitation. The second short position today is near 3340-3345. There is potential momentum for the bulls in the short term. If the European session continues to fluctuate below 3333, then the entry of short positions will be slightly more stable. Yesterday, short orders were given at the key points of 3321 and 3333, and TP looked at 3310. If the bulls re-emerge below 3310-3305, you can consider short-term long positions and target 3330-3335.

Trump blasted Powell again. Interest rates remain unchanged.Information summary:
Trump blasted Powell on Wednesday, saying that the current interest rate is "at least 3 percentage points higher" and once again accused Fed Chairman Powell of "making the United States pay an extra $360 billion in refinancing costs each year." He also said that "there is no inflation" and that companies "are pouring into the United States," and urged the Fed to "cut interest rates."
During the U.S. trading session, gold also showed a significant rebound momentum, rebounding from a low of 3285 to above 3310 in one fell swoop. As of now, gold has stood above 3320.
Market analysis:
From the daily chart:
It can be seen that the first suppression position above gold is currently at 3325, followed by around 3345. Gold did not close above 3320 on Wednesday, which means that even if gold is currently above 3320, as long as today's daily line closes below 3320, it is still in a bearish trend. On the contrary, if the closing price today is above 3320, then the subsequent test of the suppression position near 3345 may be further carried out.
Secondly, from the 4-hour chart, the current suppression position above 4 hours is around 3330-3335. Therefore, today we should focus on this position. If we cannot stand firm and break through the range suppression here in the 4-hour chart, we may retreat again in the future. The key support position below is around 3310, which is the opening price today. If the price is to retreat, it is likely to fall below 3310. But it may also remain above 3310 for consolidation.
However, as long as it falls below 3310, I think the low point near 3285 may be refreshed, so pay attention to this.
Operation strategy:
Steady trading waits for 3310 to fall and break through to short, and the profit range is 3385 or even lower.
Aggressive trading can short near 3340, with a stop loss of 3350.

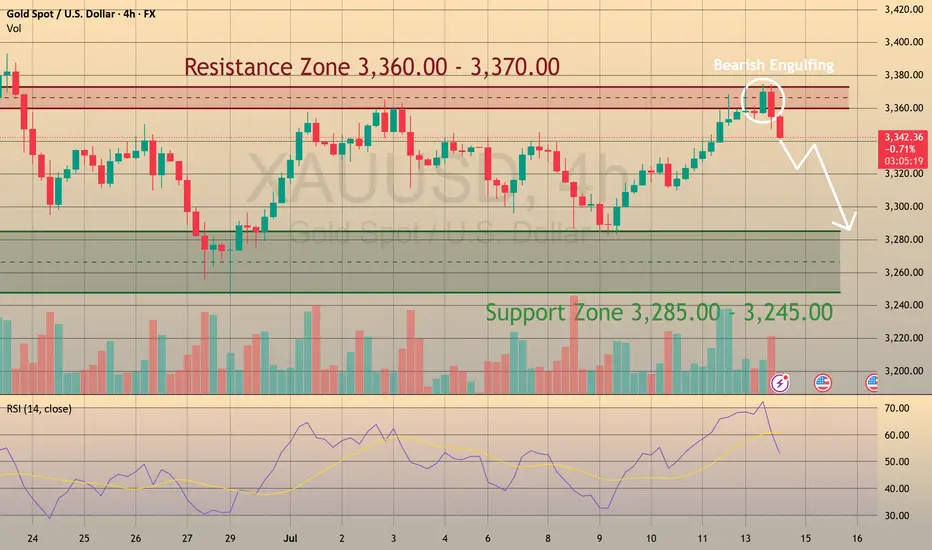
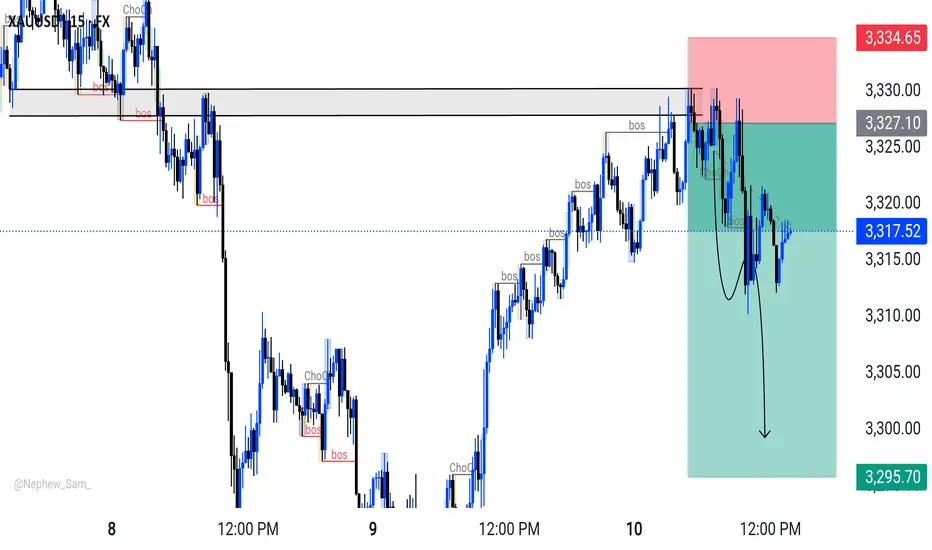
Market Structure Break & Bearish Reaction from Supply Zone.🔍 GOLD – Market Structure Break & Bearish Reaction from Supply Zone
Gold has recently broken its market structure (MSS), which is a significant shift in momentum and a potential indication of a change in the prevailing trend. Following this break, price retraced into a key supply zone, where it was rejected sharply—this rejection came in the form of a strong bearish engulfing candle, highlighting aggressive selling interest.
Interestingly, the market has now printed a second consecutive bearish engulfing from the same zone. This is a powerful signal that sellers are active and defending this level, making it a valid and confirmed short-term resistance zone. The repeated rejection suggests that smart money or institutional sellers may be positioned here.
Given this price action, we can anticipate a potential retracement from the current levels. The most probable downside target for this retracement would be the Fair Value Gap (FVG) that has been marked on the chart. If price respects the FVG and reacts bullishly from there, we may then see a resumption of the uptrend, possibly taking price higher again.
This setup presents a good opportunity for both short-term intraday traders and swing traders to watch for confirmation signals before entering the trade.
📌 Key Takeaways:
MSS indicates shift in trend
Consecutive bearish engulfing candles from supply zone
Sellers likely active in this area
Potential retracement toward marked FVG
Possible bullish continuation from FVG zone
🚨 As always, Do Your Own Research (DYOR) and manage your risk accordingly before making any trading decisions.

Gold Rebounds from 3283, Eyes 3315 Resistance📊 Market Overview:
• Gold dropped sharply to a low of $3283 earlier today before rebounding strongly back to around $3312, supported by renewed buying interest.
• The recovery is fueled by risk-off sentiment amid ongoing trade negotiation uncertainty and a mild pullback in the U.S. Dollar Index.
• Central bank buying continues to underpin gold’s base, despite mild pressure from rising U.S. bond yields.
________________________________________
📉 Technical Analysis:
• Key Resistance: $3315 – $3335
• Nearest Support: $3280
• EMA 09: Price is trading above the 9-period EMA, signaling a short-term bullish trend.
• Candle pattern / Momentum: A strong bullish engulfing candle formed after bouncing from $3283 on the H1 chart. MACD is crossing upward, and RSI is approaching the 60 level, suggesting bullish momentum.
________________________________________
📌 Outlook:
Gold may continue to recover in the short term if it holds above the $3300 level and successfully breaks through $3315 resistance. However, failure to break above this resistance could lead to a short-term pullback toward $3290–$3280.
________________________________________
💡 Suggested Trading Strategy:
🔻 SELL XAU/USD at: $3315–3325
🎯 TP: $3295
❌ SL: $3330
🔺 BUY XAU/USD at: $3285–3295
🎯 TP: $3315
❌ SL: $3280
