XAUUSDK trade ideas

XAU/USD: Bullish Reversal with Inverted Head & Shoulders PatternTechnical analysis of the XAU/USD (Gold) on the 15-minute timeframe. We are seeing a classic bullish reversal pattern that could offer a solid long opportunity.
The Pattern: Inverted Head and Shoulders (IH&S)
As highlighted on the chart, an Inverted Head and Shoulders pattern has clearly formed.
Left Shoulder: The initial dip and recovery.
Head: A lower dip, marking the potential bottom of the recent downtrend.
Right Shoulder: A higher low, indicating that sellers are losing strength and buyers are stepping in at higher prices.
This pattern signals a potential shift in market sentiment from bearish to bullish.
Confirmation and Trade Setup
The key to confirming this pattern is the neckline, which has been acting as a significant resistance level. We have now seen a decisive candle break and close above this neckline, providing the confirmation we need to consider a long position.
Here is the trade idea based on the chart:
Entry: A long position is initiated right after the breakout of the neckline, around the 3,428.542 level. A potential entry could also be on a retest of this broken neckline, which would now act as support.
Stop Loss (SL): To manage risk, the stop loss is placed below the low of the Right Shoulder at 3,419.498. A move below this level would invalidate the bullish pattern.
Take Profit (TP): The profit target is determined by measuring the height from the Head to the neckline and projecting it upwards from the breakout point.
Primary Target (TP1): 3,445.548. This target also aligns well with the '2' Fibonacci extension level, adding extra confluence to the trade.
Risk/Reward Ratio: This setup offers a favorable Risk/Reward ratio of approximately 1.88, making it an attractive trade from a risk management perspective.
Additional Confluence
Moving Averages: The price is now trading above the key moving averages, which are beginning to curl upwards, suggesting building bullish momentum.
Stochastic Oscillator: While the Stochastic is in the upper region, in a strong bullish move, it can remain overbought for an extended period.
Conclusion
The confirmed breakout from the Inverted Head and Shoulders pattern on the 15M chart presents a compelling bullish setup for XAU/USD. The defined entry, stop, and target levels provide a clear and actionable trade plan.

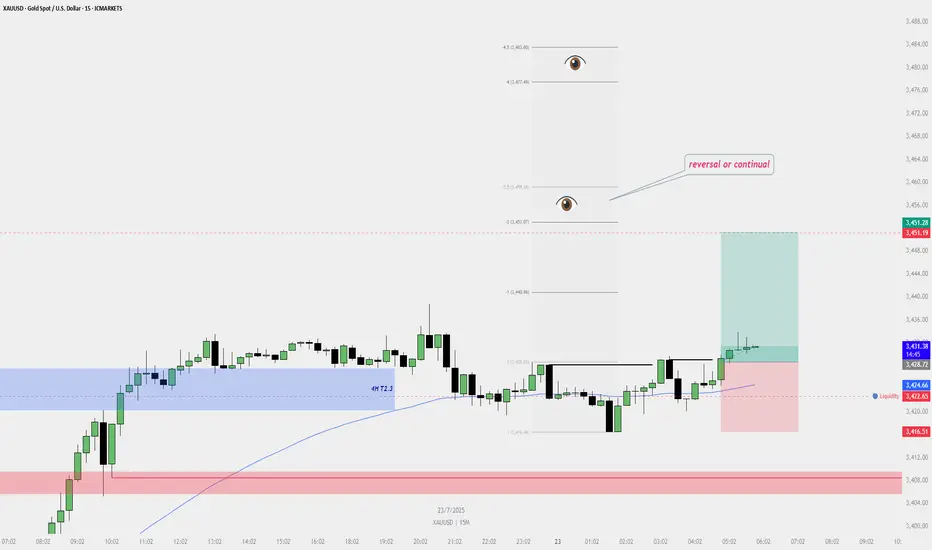
Buy Plan – XAUUSD (Gold Spot) | 15M Chart📈 Buy Plan – XAUUSD (Gold Spot) | 15M Chart
Entry Reason:
Price reclaimed liquidity below the internal range and formed a bullish shift in structure. A valid bullish dealing range was confirmed, supported by the 200 EMA and 4H T2.3 zone.
✅ Entry Zone:
➤ Entry taken after confirmation above short-term swing high
➤ Liquidity sweep confirmed below M15 consolidation
➤ Bullish FVG + support from HTF zone
🎯 Target:
TP1: 3,440.86 (1R)
TP2: 3,451.07 to 3,459.18 (Eyes above – possible reversal or continuation zone)
🛑 Stop Loss:
Placed below most recent swing low: 3,416.51
Below liquidity & invalidation of bullish structure
🧠 Bias:
Bullish (short-term continuation expected)
Reclaim above EMA and HTF zone respected
📌 Key Notes:
Watch price behavior near 3,451.07–3,459.18 for potential reversal or breakout
If price fails to maintain strength above 3,440, consider locking partial profits
Monitor 15M and 1H structure for any sign of internal break
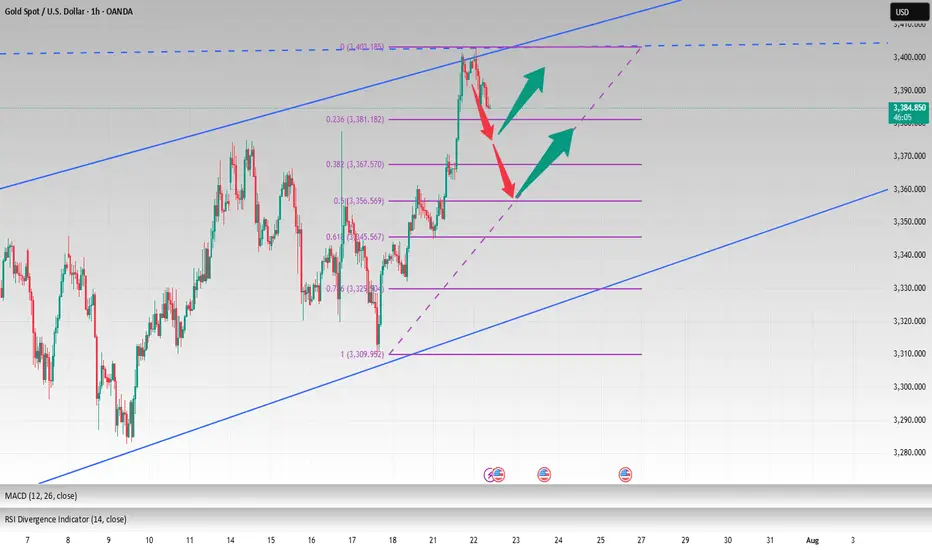
3400 has been reached, wait patiently for a pullback to go longGold opened on Monday with a volatile rise. After breaking through the 3360-65 area, the bulls turned strong. After breaking through the 3375~80 area in the evening, the bulls accelerated their rise, reaching the highest point of 3402. It fluctuated sideways in the late trading, and the daily line closed at around 3397 with a big positive line! Gold temporarily broke the small range oscillation pattern, but the bulls were not strong, and it still fluctuated upward.
From the perspective of the intraday cycle, after yesterday's rapid rise, the market fell into a serious overbought state; however, yesterday's $60 big positive line supported the bulls, and it is expected that the market will fluctuate; the next focus is still the 3400 mark area. The pressure in the 3400~05 area was dense last night, and adjustments may be made at any time before the breakthrough; and since the rise of 3282, it has just touched the upper edge of the parallel channel. The big sweep will continue, but the range is constantly changing!
So although gold broke the recent volatility yesterday and hit the 3400 mark with a big positive line; however, if it cannot stand above it, then it will continue to fall; recently we have repeatedly and many times emphasized the importance of the 3400 mark. If it stands here, the market will gradually rise to 3420~25 and break through to the 3450 area before looking for a decline.
Today we will continue to focus on the 3400 mark area. First, we will rush to the high altitude, with the goal of retracement to the 3375 and 3356 regional support platforms, and then pay attention to long opportunities; if the bulls stand above the 3400 mark, they will further bullishly impact 3420~25 and break through the 3450 area before falling back.
OANDA:XAUUSD
GOLD Will Go Up! Buy!
Please, check our technical outlook for GOLD.
Time Frame: 2h
Current Trend: Bullish
Sentiment: Oversold (based on 7-period RSI)
Forecast: Bullish
The market is trading around a solid horizontal structure 3,427.91.
The above observations make me that the market will inevitably achieve 3,460.54 level.
P.S
We determine oversold/overbought condition with RSI indicator.
When it drops below 30 - the market is considered to be oversold.
When it bounces above 70 - the market is considered to be overbought.
Disclosure: I am part of Trade Nation's Influencer program and receive a monthly fee for using their TradingView charts in my analysis.
Like and subscribe and comment my ideas if you enjoy them!

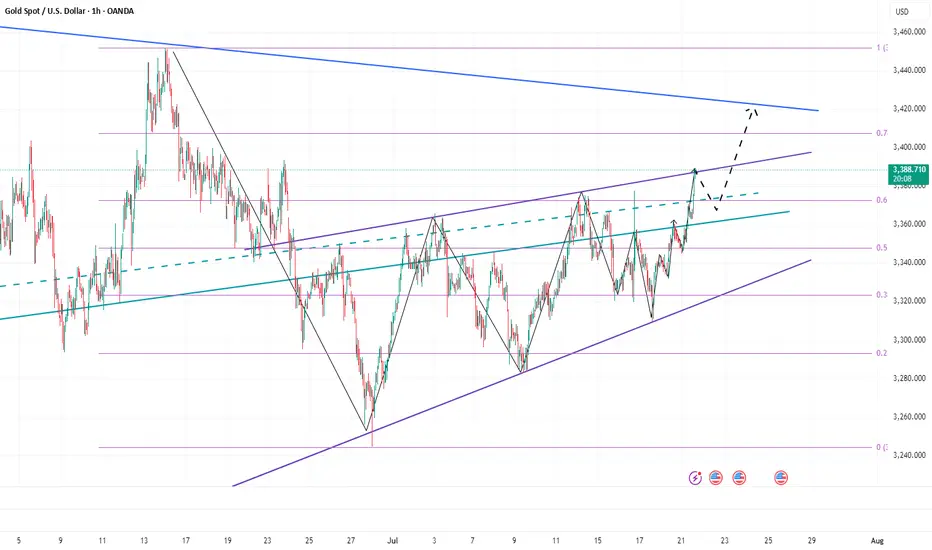
XAU / USD Weekly ChartHello traders. Taking a look at the gold chart before the overnight sessions get underway, I have marked my areas of interest for potential scalp buy / sell trade set ups on the weekly chart. This is just speculation and more of a visual of why the areas are of interest to me. Let's see if we push up some more to the top of the candle's body to the left and then see if we reject or start filling wicks. Being tomorrow is the half way point of the week, I can see gold pushing down to take out some of the leveraged long trades still in profit from today's move up. Big G gets a shout out. Let's see how the overnight sessions play out. Be well and trade the trend.

Gold Intraday Trading Plan 7/23/2025Gold rose yesterday as expected, although it didn't reach my target of 3450. With daily close above the resistance line drawn in the chart, we confirm the bullish momentum and it is strong.
For today's setup, I will buy from the trendline support which is around 3420.
1st target 3450
Final target for today 3500

Gold Trading Strategy | July 22-23✅As anticipated in our morning analysis, Gold prices pulled back during the Asian and European sessions, precisely touching the key support zone around 3385. In the U.S. session, futures prices once again drove a strong rally, pushing gold through the 3400–3402 resistance zone and reaching the measured move target after the breakout. The bullish trend remains intact, and our strategy of buying on pullbacks has once again proven effective.
✅Key Technical Levels:
🔴Resistance:
🔸3445–3450: Key resistance zone for swing trades and the primary upside target;
🔸3430: Intraday one-ATR projection level and previous daily closing high;
🟢Support:
🔹3420: Short-term support level; if the price holds above, further upside is likely;
🔹3402–3405: Key support zone and critical stop-loss area for breakout long positions;
🔹3383–3385: Critical support zone and today's low;
🔹3371–3375: Previous resistance turned support; if broken, the bullish structure needs reassessment.
✅Trading strategy reference:
🔰The overall trend remains strongly bullish, with buying on dips as the primary strategy.
🔰Shorting is only suitable for experienced traders and should be approached with caution and tight risk control.
🔰If gold pulls back but holds above 3405, buying opportunities remain valid;
🔰If the price reaches the 3445–3450 zone and shows signs of exhaustion or bearish reversal, consider reducing long exposure or testing shorts with strict stop-losses.
🔥Trading Reminder: Trading strategies are time-sensitive, and market conditions can change rapidly. Please adjust your trading plan based on real-time market conditions. If you have any questions or need one-on-one guidance, feel free to contact me🤝

GOLD SELL POSITIONPrice have been correcting the last move down and now is showing a strong resistance at this level. expect price to move down in any news coming soon from US session.

Warning Signs After Gold’s Sharp Rise — Is a Pullback Coming?Today, gold rebounded from around 3345, and has now rebounded to around 3389, which is only one step away from the 3400 mark. Gold has hardly retreated during the rise, and the rise is strong. However, we can see from the small-level candle chart that gold suddenly accelerated its rise after consolidating around 3365, and continued to around 3390, and is now oscillating near the recent high trend line.
After gold accelerated its rise and oscillated near the recent high trend line, this made me have to be more cautious, because we must be careful that the acceleration of gold's rise in the short term is a trap for buyers, so even if we are bullish on gold in the short term, we should not directly chase gold at a high level; according to the current structure of gold, I think it is necessary for gold to retest the 3370-3360 area support before continuing to rise and hitting 3400. Only after verifying that the support in this area is effective can it be conducive to a better rise in gold!
So for short-term trading, I think we can still try to short gold now, and then wait patiently for gold to retest the 3370-3360 area.
GOLD (XAUUSD) IdeaGold Broke the previous major resistance and probability is to come back to resistance and make the resistance become support. As well as, the zone is the Previous Day High which can also be dense liquidity zone. So we looking for buy setups at that level. Good LUCK

Technical Analysis of XAU/USD (Gold) - 1-Hour ChartThis chart presents a bullish trade setup for XAU/USD based on several technical indicators and patterns. The analysis suggests a potential buying opportunity after a significant breakout and subsequent pullback.
Key Observations:
Bullish Trend Reversal: The price has clearly broken out of a major descending trendline (shown in green), which had been acting as resistance. This breakout indicates a potential shift in momentum from bearish to bullish.
Continuation Pattern: Following the initial breakout, the price has established a new short-term uptrend, which is supported by the steep yellow ascending trendline. The current price action is a pullback or consolidation after a strong upward impulse.
Fibonacci Retracement: A Fibonacci retracement tool has been applied to the most recent upward wave (from the low around the 19th to the recent high). This helps identify potential support levels for a long entry:
0.382 level: ~3,360.19
0.5 level: ~3,358.26
0.618 level: ~3,356.33
This "golden zone" between the 0.382 and 0.618 levels is a common area for a trend to resume after a pullback.
Proposed Trade Setup (Long Position)
The chart explicitly outlines a long (buy) trade with the following parameters:
Entry: The suggested entry point is within the Fibonacci retracement zone, likely around the 3,360.00 area. The trader is waiting for the price to dip into this support zone before entering.
Stop Loss (SL): The stop loss is placed at approximately 3,350.553. This level is strategically set below the 0.618 Fibonacci level and the recent swing low, invalidating the bullish setup if breached.
Take Profit (TP):
TP 1: The first target is marked by the white horizontal line at approximately 3,371.00.
Final Target: The full target of the trade setup extends much higher, towards the 3,388.00 price area.
Risk/Reward Ratio (R/R): The trade setup shows a highly favorable risk-to-reward ratio of 4.21. This means the potential profit is over four times the potential loss, making it an attractive setup from a risk management perspective.
Conclusion
The analysis points to a high-probability bullish continuation for XAU/USD. The strategy is to enter a long position during the current pullback, targeting the support levels identified by the Fibonacci retracement. The well-defined stop loss and excellent risk/reward ratio make this a structured and compelling trade idea. The key is for the price to find support in the entry zone and continue its upward momentum.

Monday market forecast and analysis ideas#XAUUSD
There will be a lot of data next week, such as the 8.1 tariff deadline that I have repeatedly emphasized, the Federal Reserve decision, NFP data, etc. It can be said that it is relatively difficult to analyze purely from a technical perspective, because there is uncertainty in many data, the data results are often non-linearly correlated with market reactions (good news does not necessarily lead to a rise, and bad news does not necessarily lead to a fall), and large fluctuations can easily form oscillating K-lines with long upper and lower shadows. Therefore, the first arrangement for next week is to participate in trading with a light position and avoid letting emotions control your thinking.
The closing price on Friday was near 3337, proving that the short-term judgment on the rebound momentum of gold is correct, so there are two possible situations on Monday.
1. The first thing we need to pay attention to is 3345-3350 to determine whether it constitutes a short-term pressure level. The weekly line closed with a negative cross star. Combined with the monthly line trend, in terms of support, focus on the trend line support near this week's low of 3325. If this position is not broken, the market is expected to usher in a wave of rebound; if it falls below 3325, the bottom may look to 3310 or even 3295 for support.
2. The rebound momentum of Friday continued on Monday, breaking through 3350 first, and then it is possible to reach the previous high resistance area of 3370-3380. If it encounters resistance here, gold will continue to fall and fluctuate, and the target may even be 3310. If the price remains strong and issues such as interest rate cuts and tariffs are imminent, it means that the short-term downward trend has ended and may even set a new high.
The above content is only a forecast for Monday’s market. It will be greatly affected by data and news, and may be adjusted in real time next week based on intraday trends. You can refer to this, but remember not to be swayed by emotions. We will participate with a light position, and the specific trading strategy can wait for my trading signal.

GOLD (XAU/USD) SHORT TRADE PLAN
July 25, 2025
Trade Overview (My setup)
- Direction: Short (SELL)
- Entry Price: $3,330
- Take-Profit: $3,270
- Stop-Loss: $3,370
- Lot Size: 0.18 lots (18 oz)
- Risk: $720
- Reward: $1,080
- Risk/Reward Ratio: 1.5 : 1
Technical Analysis Supporting the Bearish Bias
1. Price Structure & Trend
- Descending channel observed on the 4H chart - strong short-term bearish signal.
- Series of lower highs and lower lows confirms bearish trend.
- Price is testing $3,325-$3,300 support - breakdown opens downside to $3,270-$3,250.
2. Key Support/Resistance Zones
- Key support: $3,300 being tested.
- Resistance: $3,360-$3,370 zone - logical stop-loss location.
3. Indicator Confirmations
RSI (4H): ~35-40, bearish territory, no bullish divergence.
Moving Averages: Price below 50 EMA and 200 EMA - bearish crossover.
MACD: Bearish crossover, histogram confirms selling momentum.

XAUUSD Our old trade is holding in profits from top. but this one is reetry and played well but news can change thing dramatically
Manage risk at first
Sell short plan 15 minutes time frame

Weekly Analysis on GOLDFor next week trading sessions i will be more patience in waiting for my set up to appear before taking trades.
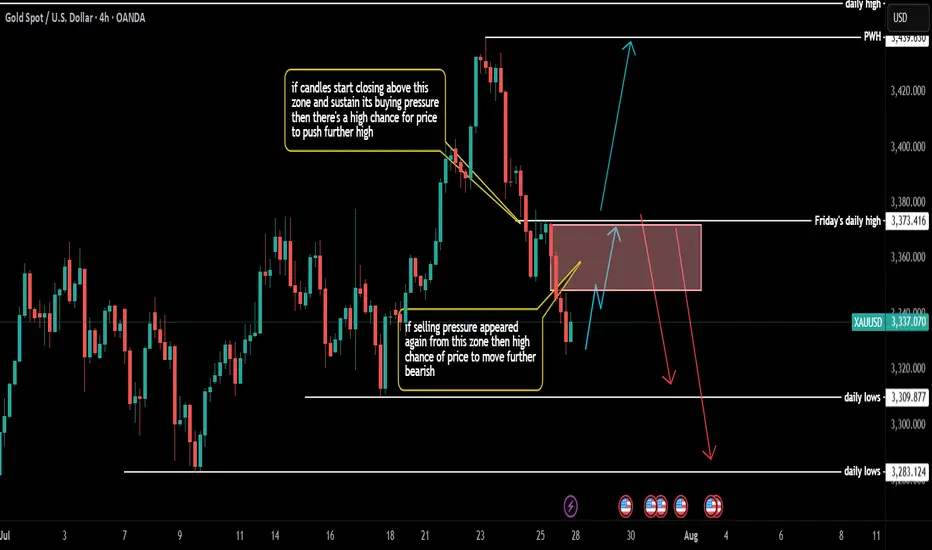
Gold Spot / U.S. Dollar (XAUUSD) - 4 Hour Chart (OANDA)4-hour chart from OANDA displays the price movement of Gold Spot (XAUUSD) from late July to early August 2025. The current price is $3,332.775, reflecting a decrease of $35.935 (-1.07%) as of 07:54 PM PKT on July 25, 2025. Key levels include a sell price of $3,332.480 and a buy price of $3,333.050. The chart shows recent volatility with a shaded support zone around $3,312.314 to $3,367.326, indicating potential price stabilization or reversal areas.

Gold to Take Support Gold at key support level, There is two chances.. where it can grab the liquidity... we will wait and watch... Cheers

GOLD The Target Is UP! BUY!
My dear followers,
I analysed this chart on GOLD and concluded the following:
The market is trading on 3354.1 pivot level.
Bias - Bullish
Technical Indicators: Both Super Trend & Pivot HL indicate a highly probable Bullish continuation.
Target - 3361.01
Safe Stop Loss - 3350.5
About Used Indicators:
A super-trend indicator is plotted on either above or below the closing price to signal a buy or sell. The indicator changes color, based on whether or not you should be buying. If the super-trend indicator moves below the closing price, the indicator turns green, and it signals an entry point or points to buy.
Disclosure: I am part of Trade Nation's Influencer program and receive a monthly fee for using their TradingView charts in my analysis.
———————————
WISH YOU ALL LUCK

Gold : Sell Continuation Gold: Top Formed at Major Supply Zone 🔻 | 4H Reversal Setup
Looking for continuation after bearish BOS. Targeting clean liquidity below. SL above structure. R:R ~3:1

Gold's safe-haven attribute has lost its key pivot pointA comprehensive judgment, the current market overall defense mechanism is lifting. With the liquidity risk gradually easing, gold's safe-haven attribute has lost its key pivot point. the market preference indicators tracked show that gold as a defensive asset is being marginalized, with trading activity and capital attention both declining.
The structure of institutional positions in gold tends to be decentralized, and funds are migrating to assets with higher return expectations. This indicates that in the short term the market is not looking forward to gold out of the systematic market, but rather more inclined to use it as a hedging asset rather than the main configuration.
It is recommended that investors appropriately shrink the gold direction of the strategy exposure, to avoid high-frequency operations in the trend of the state of uncertainty. Position should be light, operation should be stable. In the future, if the system captures the signal of the refocusing of risk aversion logic, we will be the first time to issue strategy alerts.
Gold Buy OfferIn 4H time frame there is a good Demand area in 3309.5-3351 price.
Ofcourse it is a thick one and S/L would be too far. So I prefer to enter the Buy position in the middle it .( some price around 3330 if drops )

XAUUSD 24/07 Bullish Reversal Potential from Falling Channel1. Price Overview & Trendline Context
Gold (XAUUSD) is currently trading around 3,369.67 USD after a notable pullback from the recent high near 3,428. A clear descending channel has formed, marking a short-term corrective move within a larger bullish trend. Price action suggests a potential reversal setup as price approaches a strong support zone around 3,340 – 3,350 USD, previously acted as demand in the breakout on July 22.
2. Fibonacci & Structure Analysis
The Fibonacci retracement drawn from the recent swing low to the top at ~3,428 reveals that the pullback has reached the 0.9 level, often seen as an exhaustion point for corrections in strong bullish trends. This area aligns with:
Key horizontal support: 3,340 – 3,350
Previous breakout zone
Volume spike at base (20.6K vs avg.)
This convergence suggests a high-probability bullish reversal setup.
3. EMA & Momentum Indicators
Although the chart primarily uses SMA 9, the structure suggests price is extended from shorter EMAs. A break above the upper boundary of the falling channel may trigger EMA crossovers, further confirming reversal momentum.
4. Trading Strategy Suggestion
Setup
Description
Buy Zone: 3,350 – 3,365 USD
Take Profit 1: 3,385 USD (short-term supply zone)
Take Profit 2: 3,428 USD (recent swing high)
Stop Loss: Below 3,340 USD
This trade follows the "Buy the Dip in Uptrend" strategy, aligning with trendline, fib support, and volume confirmation.
5. Key Resistance & Support Levels
Resistance: 3,385 – 3,428 USD
Support: 3,340 – 3,350 USD
Breakout Confirmation Level: 3,375 (channel breakout)
6. Final Insights
Gold remains in a broader bullish structure. Today’s chart shows strong technical confluence for a short-term reversal. Traders should monitor closely for breakout candles from the falling wedge/channel, preferably with volume confirmation.
