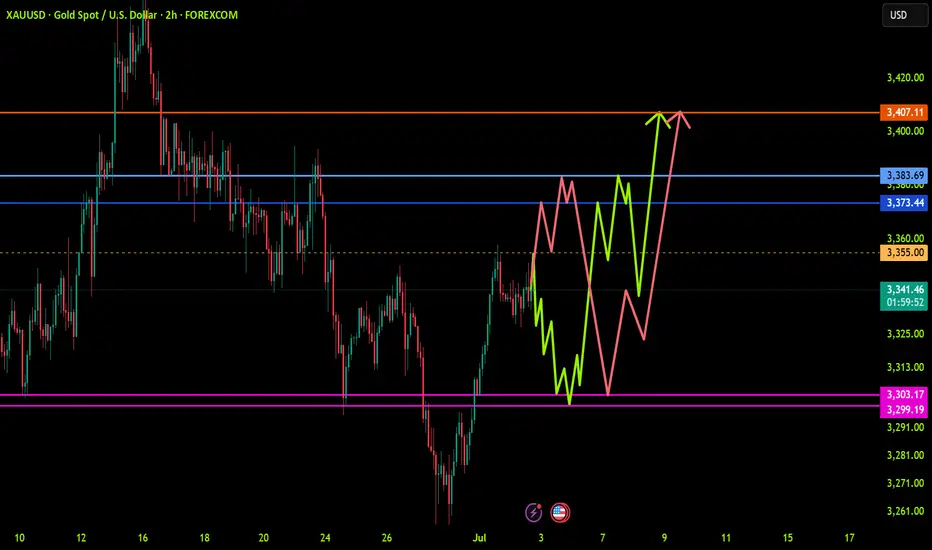
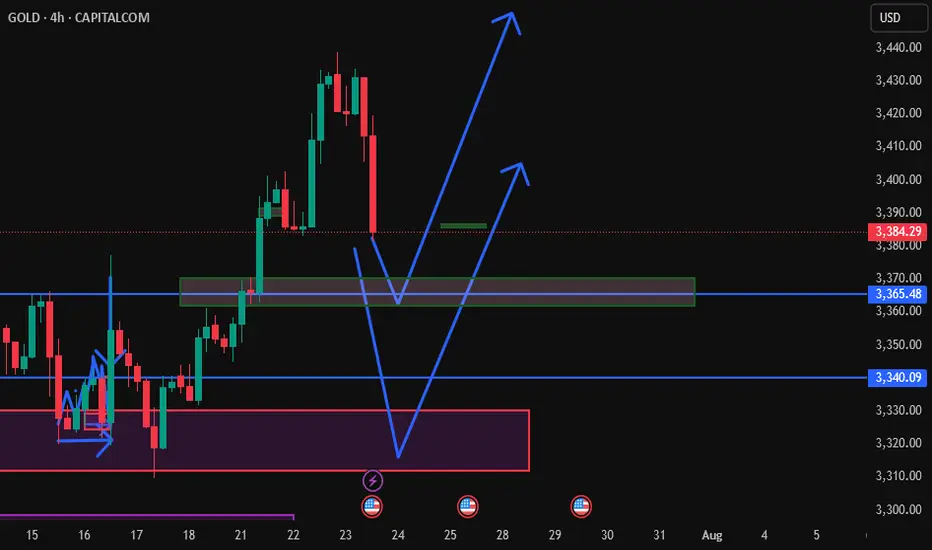
XAUUSD: Trend in 2H timeframevery important levels for GOLD, we have two trends,
Please pay special attention to the colored levels.
Trends are very accurate,
>>>>>>>>>>>>>>>>>>> The setup is very sensitive <<<<<<<<<<<<<<<<<<<<<<<<
Be careful
BEST
MT
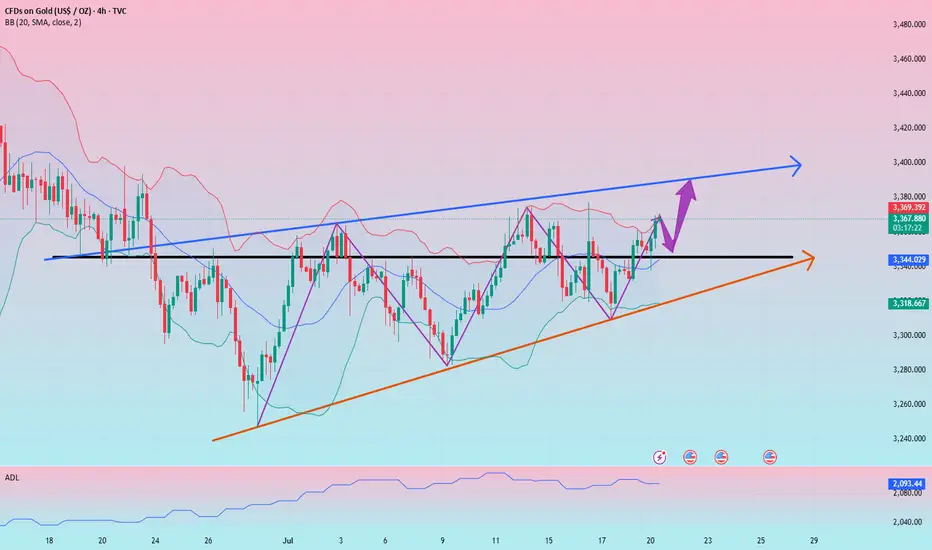
XAUUSDK trade ideas
July 24, 2025 - XAUUSD GOLD Analysis and Potential OpportunitySummary:
After yesterday’s sharp drop from 3420 to 3385, today may bring a corrective rebound. Watch the 3385 level closely — if price breaks below, bearish momentum could increase, and the strategy shifts to selling on pullbacks. If 3385 holds, consider buying on dips, targeting a retest of 3400. A sustained move above 3400 may strengthen bullish momentum, but if rejected, price could range between 3385–3400. Stay flexible and focus on key reactions at major levels.
🔍 Key Levels to Watch:
• 3434 – Resistance
• 3420 – Resistance
• 3405 – Key resistance
• 3400 – Psychological level
• 3385 – Intraday key support
• 3375 – Support
• 3364 – Support
• 3358 – Support
• 3345 – Strong support
📈 Intraday Strategy:
• SELL if price breaks below 3385 → target 3380, then 3375, 3370, 3364
• BUY if price holds above 3400 → target 3405, then 3410, 3420, 3434
👉 If you find this helpful or traded using this plan, a like would mean a lot and keep me motivated. Thanks for the support!
Disclaimer: This is my personal view, not financial advice. Always use proper risk control.
XAUUSD BuySimple set up, trend continuation. Gold is buying, so we will be looking at an entry on smaller time frames as they get more bullish.

Xausd techinical analysis.Xausd techinical analysis next move posibale at 30mint time frame.not finchinal advice.

Gold technical analysis and trading strategyGold technical analysis and trading strategy
From the daily level, the gold price has confirmed that it has broken through the lower track support of the large convergence triangle, forming a typical three-day continuous pull-up pattern. Yesterday's big positive line was full of entities, not only breaking through the 3365-3377 area of the previous few weeks of shock highs, but also standing on the 3380 mark of the small convergence triangle trend pressure level, which opened up technical space for subsequent rises.
The 4-hour chart shows that the price continued to strengthen after breaking through the middle track, and the MACD indicator golden cross ran well, indicating that the bullish momentum is increasing. It is worth noting that the previous resistance area of 3365-3377 has now been transformed into an important support belt, and together with the 5-day moving average of 3360, it constitutes a callback defense line.
【Key price analysis】
Support:
The primary support is in the 3380-3383 range, which is the resonance area of the trend line conversion support and the middle track of the hourly chart
The secondary support is at 3360-3365, including the 5-day moving average and the previous breakthrough position
Resistance:
The short-term primary target is the 3408-3420 area, which is the upper track of the large convergence triangle
After the breakthrough, it will challenge the space above 3450, and then a unilateral upward trend may be launched
【Disk details observation】
In the morning, the gold price experienced a technical correction after testing the overnight high of 3401, but it remained above the 3380 support. From the hourly chart:
There is obvious buying in the 3382-3383 area
Although the price briefly fell below the middle track of 3386, it quickly recovered the lost ground
If the US market can regain the 3400 mark, it will confirm the start of a new round of upward attack
It is particularly worth noting that the current market presents a typical time-for-space feature. If the 3380 support fails to be effectively broken before 22:00, it is likely to complete the adjustment through sideways consolidation and then directly start the upward attack.
"In the context of a clear positive trend, it is recommended to adopt a trading strategy of mainly doing more on pullbacks:
Ideal entry point for long orders: 3400-3405 range
Strict stop loss setting: below 3395
Initial target: 3415-3420 area
After breaking through 3420, you can continue to hold and look at 3450
For aggressive traders, you can try to go long with a light position in the 3400-3410 support area, but you need to strictly control your position. Conservative investors can wait for the price to stabilize at 3400 before intervening."
Professional reminder: "The essence of trend trading is to follow the trend. The current gold price has formed a complete upward channel, and each pullback is a good opportunity to arrange long orders. But you need to pay attention to controlling your position and guard against the short-term volatility risks that may occur in the US market."
(Probably) short again!Hello all. after last idea that hit the TP, it may go down again. it may be a risky. be happy(wink)

Gold is under pressure. There is hope for another rise.Today's important news:
At 8:30, Fed Chairman Powell delivered a welcome speech at a regulatory meeting; at 13:00, Fed Governor Bowman hosted a fireside chat session at the large bank capital framework meeting hosted by the Fed.
Market conditions:
The current daily trend is mainly "strong rise" (Monday closed positive and broke through the shock, and the moving average turned upward). The core logic is that short-term bullish momentum is dominant, and it is necessary to focus on the effectiveness of support and the rhythm of breaking through resistance.
Today, we need to focus on the support belt 3365-3360 area (this position is the 5-day moving average position and the low point of yesterday's European session). As a short-term moving average support, this area is the first line of defense for bulls today. If it can stabilize here, it can be regarded as a signal of short-term strong continuation.
The key pressure level is still around 3420. As a trend line resistance that has been under pressure many times in the early stage, if it can break through, it means that the bulls will break the shock suppression and open up more room for growth.
In terms of operation, it is still mainly low-long. The current gold is still strong. Operation strategy:
Short around 3420, stop loss 3430, profit range 3400-3380
Long around 3360, stop loss 3350, profit range 3380-3400

Daily gold analysisDaily gold analysis
A long position with the target and stop loss as shown in the chart
The trend is up, we may see more upside
All the best, I hope for your participation in the analysis, and for any inquiries, please send in the comments.
He gave a signal from the strongest areas of entry, special recommendations, with a success rate of 95%, for any inquiry or request for analysis, contact me
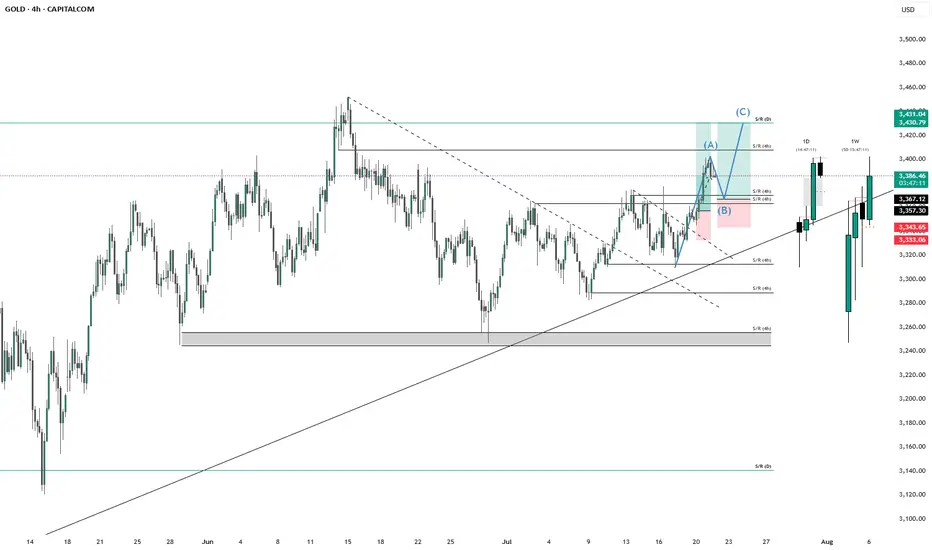
Gold Possible Buy EntryIm already on this trade and I am looking at another possible trade entry for a possible ABC pattern. Let me know what you think.
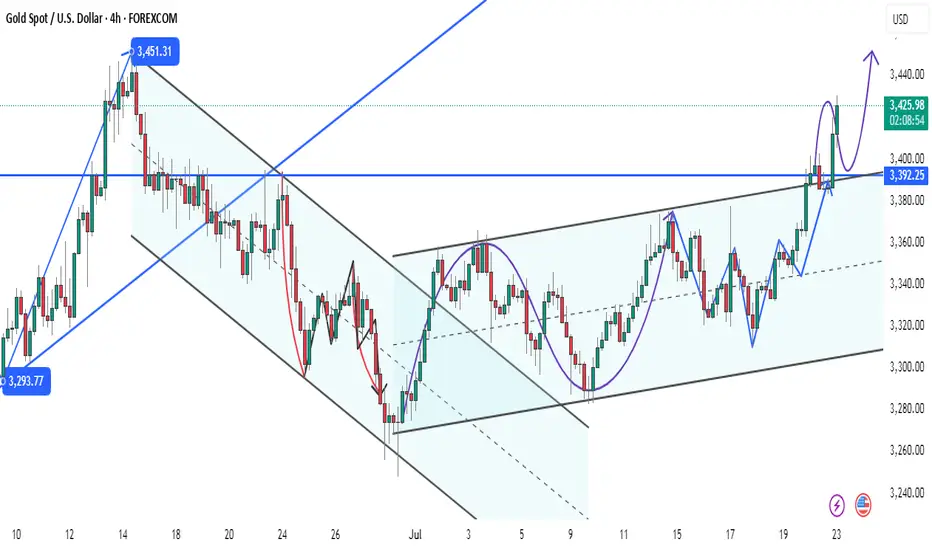
XAUUSDXAUUSD in a longterm its going to 5K like i already said in 2022
On a short/ midterm we going to 3500.
The price must close above and reject the consolidation like a support to allow us to buy.
Otherwise the best thing to do is wait.

GOLD Wait For Breakout!
HI,Traders !
#GOLD has formed a Bullish Flag pattern
While trading in an uptrend As
we mentioned in a previous analysis
So we are bullish biased and
IF we see a bullish breakout
We will be expecting a
Further bullish move up !
Comment and subscribe to help us grow !

SELL XAUUSDFirst scenario hit stop loss, I a still expecting price to dump very hard soon towards 3440. Patience is key here

Gold is rising steadily, finding the right buying point is the k
There are no eternal friends, only eternal interests. Value exchange is the "code" of interpersonal relationships. From the president to individuals, the game of interests is everywhere.
Half a year ago, Musk strongly supported Trump to take office. The two joined forces to win the swing states. One gained power and the other gained fame. After Musk became the head of the efficiency department, he made drastic reforms and fought corruption from the outside to the inside.
Now, the two have parted ways. According to US media reports on July 20, Trump began to review the order contract between Musk's Space X and the federal government. In just 6 months, the two went from close friends to opponents. The "big and beautiful" bill was also strongly resisted by Musk.
If the big guys are like this, let alone ordinary people, their butts determine their heads, sitting in different positions to think about different interests, emotions and friendship are just outer garments, Musk spent $270 million and got fame, and Trump also got the power he pursued, there is no right or wrong.
This struggle is far from over. It is estimated that the game will continue during Trump's four years in office. Musk stands on the high-dimensional pursuit of interests for the exploration of human progress, while Trump's slogan is to make America great again. The two people have taken different routes.
What we care about is not the right and wrong of the two, but whether this right and wrong will bring turmoil to the financial market. Will Tesla be the "prince in distress"? Is there a possibility of bargain hunting after the stock price plummets in the short term? Will the gold market trigger risk aversion because of Trump's unpredictable approach? This is what we need to ponder and study.
Okay, let's talk about the gold market today:
During this period, the volatility of the gold market has become smaller and smaller, and the range of fluctuations has also been compressed. The sentiment of investors in the market is relatively low. When the fluctuations just started in April, some people who were trapped were concerned about when to get out of the trap every day. After 3 months, everyone is tired, and the fight between bulls and bears has cooled down.
However, as the shock is coming to an end, the gold price may explode into a new round of unilateral market at any time due to fundamentals, especially on August 1, Trump will implement equal tariffs on global trading partners. This king bomb has been delayed. Once it starts to land, it will inevitably cause turmoil in the financial market.
Since last week, affected by Trump's threat to fire Fed Chairman Powell, the gold price quickly hit the high of $3,370 and then fell back to $3,310. After that, the price lows continued to rise and rebounded. The top and bottom conversion of $3,345 in the morning and the support of the low point in the early morning of last Friday were the starting points for the rise. Today, the focus is on the long-short dividing point of $3,345, that is, the price is temporarily not empty above $3,345. Today is not a sharp rise at the opening. The prerequisite for a sharp rise must be that $3,345 breaks.
Today, I think that 3345 USD should be used as the dividing point between long and short positions, that is, your stop loss should be placed below 3345, and then find a position to go long, such as within the range of 3360-55, first look at 3370-75 above, and then look at 3392-95 USD after breaking through. Some people say that they dare not do such a large stop loss? In fact, just reduce the position. The stop loss space is dynamically adjusted according to the support level. Fixed stop loss space is a false proposition.
Gold Approaches New Resistance – Potential Short-Term Pullback📊 Market Update
Gold is currently trading around $3,368–$3,370/oz, up approximately 0.5% today, supported by a weaker USD and slightly declining US Treasury yields. This comes amid global trade concerns and expectations that the Fed may adjust policy in upcoming meetings.
📉 Technical Analysis
•Key Resistance: $3,375–$3,380 (pivot R2: $3,374.9, R3: $3,389.6)
•Nearest Support: $3,360 (S1: $3,335.8)
•EMA: Price is trading above the EMA9 / EMA20 / EMA50 / EMA200, confirming a strong uptrend
•Candlestick / Volume / Momentum:
o MACD & ADX still confirm strong bullish momentum
o Price consolidating in a rectangle range of $3,352–$3,366 → watch for breakout or rejection at resistance
📌 Outlook
Gold may pull back slightly if it fails to break through the $3,375–$3,380 resistance area and RSI continues hovering near overbought levels.
💡 Suggested Trade Strategy
🔻 SELL XAU/USD at: $3,375–$3,380
🎯 TP: 40/80/200 pips
❌ SL: $3,385
🔺 BUY XAU/USD at: $3,345–$3,348
🎯 TP: 40/80/200 pips
❌ SL: $3,339

Buy first when gold falls back, and pay attention to the strengtGold went on a roller coaster ride last week. It rose to around 3377 at the beginning of the week and then fell back under pressure. After stabilizing near 3309 on Thursday, it strengthened again on Friday and came under pressure near 3361. It fell back slightly to around 3344 at the opening in the morning and is currently rising again. In the morning, pay attention to the opportunity to buy first after the pullback, pay attention to the strength of the European session, and pay attention to the pressure near 3378/80 on the upside.

Gold After.......Ill do a break down of this pair sometime tonight I did go ahead and close my positions due to the fact I didn't get my proper entry confirmation so I wasn't 100% comfortable even though I did trail my stops on lower time looking to reenter once I can get a clean retest on fibs or structure retest to take another buy currently sitting on my hands till a set up presents it self.

Gold next target According to analysis Gold next target around 3377 /3400 possible move next week if you satisfied with analysis you play

Monday market forecast, pay attention to the 3339 retracement📰 News information:
1. The Trump administration puts pressure on the Federal Reserve to cut interest rates
2. The continued impact of tariffs and the responses of various countries
📈 Technical Analysis:
This week's basic judgment and forecast on the gold market trend were consistent, but on Friday, the overall gold fluctuations were not large. The overall trend of the daily line fluctuated around 3345, and the 3345 line also became a short-term long-short watershed. Although prices are likely to rise more easily than fall in the short term, it should be noted that the three-month adjustment cycle is coming to an end while the fundamentals of the bull market have not changed. It is recommended that you focus on preventing risks from short position operations next week. At the same time, the overall strong shock pattern, the anti-pulling momentum has not reached the top suppression position, and the area around 3339 below is the previous intensive trading area, which constitutes a certain support in the short term. If the market fails to effectively break below next week, it will greatly boost the bullish momentum, and it is not ruled out that there will be a possibility of refreshing the high point near 3380 next week.
On the whole, the short-term focus next week is the 3345-3335 area below. If it falls back to this point, you can consider arranging long orders. The short-term target is 3355-3365, and the strong trend is expected to continue to touch 3375-3385.
🎯 Trading Points:
BUY 3345-3335
TP 3355-3365-3375-3385
In addition to investment, life also includes poetry, distant places, and Allen. Facing the market is actually facing yourself, correcting your shortcomings, confronting your mistakes, and strictly disciplining yourself. I hope my analysis can help you🌐.
TVC:GOLD PEPPERSTONE:XAUUSD FOREXCOM:XAUUSD FX:XAUUSD OANDA:XAUUSD FXOPEN:XAUUSD

XAU / USD 4 Hour ChartHello traders. Taking a look at the 4 hour I have marked my areas of interest. This is going to be a great week. Big G gets a shout out. Let's see how Gold's moves with the week's opening and the overnight sessions. Be well and trade the trend.

Simplified trading on gold. Buy low sell high.
Trend is your friend.. until it isn't.
Support is support until it is broken.
Resistance is resistance until it is broken.
Long from support, short at resistance.
Stop position and switch direction if S/R is broken.
Keep it simple, keep it together.

Gold is weak. Will it explode next week?Gold prices failed to stabilize above $3,400 after a bullish breakout this week. The technical outlook highlights the recent indecision of gold bulls.
In the first two trading days of this week, spot gold prices rose by 2.4%, but the cumulative decline in the last three trading days of this week reached nearly 3%. The sharp fluctuations this week were due to the positive progress in Trump's trade negotiations, and the rebound in market risk appetite, which hit the safe-haven demand for gold.
Looking at next week, the economic calendar will provide several high-impact data releases. The Federal Reserve will announce its monetary policy decision after the policy meeting on July 29-30; the US Bureau of Labor Statistics will release the July employment report; and some important news such as the US-China trade negotiations may trigger the next major move for gold.
From a technical perspective, the current market short-term technical outlook highlights the hesitation of gold buyers. The daily chart shows that the RSI is still slightly below 50, and gold prices have difficulty staying away from the 20-day and 50-day MAs after breaking through these two levels earlier this week.
On the upside, 3450 constitutes the first resistance for gold prices. If it breaks through this resistance, gold prices will most likely hit the 3400 integer mark again.
On the downside, if gold prices remain below 3340, technical sellers may still be interested. In this case, 3310 can serve as the first support level, followed by the second support level near 3285.
A new week is about to begin, and I wish all traders good luck.