Will gold continue to fall on July 25?
1. Brief analysis of gold fundamentals
The current gold price is fluctuating downward, and the core driving factors are:
Risk aversion has cooled down:
The United States and Japan reached an agreement on automobile tariffs and promoted an agreement with the European Union, easing previous global trade tensions;
The overall risk appetite of the market has increased, and safe-haven funds have withdrawn from gold.
The US dollar rebounded in stages:
The US dollar index rebounded after the previous decline, which partially offset the safe-haven appeal of gold;
Although there are expectations of interest rate cuts within the Federal Reserve, there are large differences, and the overall trend is still "wait-and-see", which has increased the volatility of the US dollar trend.
2. Technical analysis of gold
Trend characteristics:
Gold has fallen from the high of 3438 and has been under pressure for two consecutive days;
It is currently testing the 0.618 retracement support (about 3360) of the 3310-3438 increase;
The European session continued to fall. If there is a rebound before the US session, there may be a risk of "false breakthrough and real decline";
If the US session still does not rise in the early session, it is necessary to pay attention to the possible V-shaped reversal in the future.
Technical indicators:
The short-term MACD bottom divergence gradually emerges, and the probability of oversold rebound correction increases;
Important support: 3350-3340 range (once lost, it may test the lower track of the 3337 daily triangle);
Key pressure: 3393-3403 range (initial rebound resistance), stronger resistance is around 3416-3418.
III. Short-term operation strategy suggestions
✅ Main idea: shorting on rebound is the main, and long on callback is the auxiliary
Short order layout reference:
If the 3393-3403 area encounters resistance, you can try to short with a light position;
Stop loss is set above 3410, and the target is 3360-3350;
If the market breaks through 3403 strongly and stabilizes, the short order strategy needs to be suspended.
Long position layout reference:
If it drops to 3350-3340 and stabilizes, you can try short-term long with a light position;
Stop loss is set below 3335, and the target is 3375-3385;
If the market quickly breaks below 3337, wait for the lower support to stabilize before intervening.
IV. Trend warning points
If the price does not rebound significantly before the early US market, it is necessary to guard against a sudden V-shaped pull after the US market;
If it directly falls below 3340, the space below opens, it is recommended to stop loss in time and wait for new support points.
✅ Conclusion:
In the short term, gold is still in the downward correction stage, but as the technical oversold signs appear, short-term sharp pull rebound should be guarded against. It is recommended to respond flexibly in operation, pay attention to the response of key support and resistance levels, and avoid chasing up and selling down.
XAUUSDK trade ideas
gold bearishgold has not respected any support ony to H4 3351.
will it make its way up from here. only candle stick reaction to tell us.
however the safest trade for today to end the week is shorts.

Xausd techinical analysis.Xausd techinical analysis next move posibale at h2 time frame not finchinal advice.

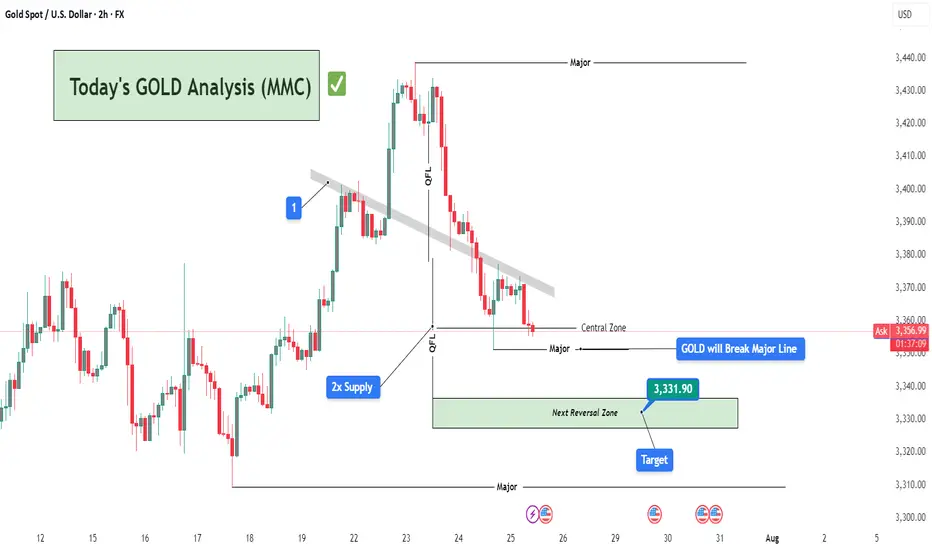
Today's GOLD Analysis (MMC) – Sell Bias Continues To Next TargetChart Overview:
This 2-hour GOLD (XAU/USD) chart showcases a clear bearish structure in line with the Mirror Market Concepts (MMC) methodology. Price action is respecting key supply zones and continues to reject significant levels, confirming the dominance of sellers in the short-term structure.
🔍 Key Technical Elements:
1️⃣ Break of Trendline (MMC QFL Entry Model)
The descending grey trendline marks consistent lower highs, showing clear bearish pressure. The breakout and rejections around this trendline zone (annotated “1”) confirm it as a strong supply area. This breakdown set the stage for a QFL (Quick Flip Liquidity) drop.
🧊 2x Supply Zone (High Confidence Rejection)
The 2x supply label highlights an area where price rapidly reversed with aggressive bearish momentum. This zone was tested and respected again, leading to further downside pressure, reinforcing the idea of institutional selling interest from that level.
📉 QFL Levels & Central Zone
Two major QFL drops are evident, where price broke previous demand structures and created new supply imbalance. The Central Zone currently acts as short-term support, but price is hovering just above it with weak bullish reaction, indicating potential for further breakdown.
🎯 Target & Reversal Zone – 3,331.90
The green zone below marks the Next Reversal Zone, with a highlighted price target at 3,331.90. This is where:
Previous liquidity was absorbed.
Demand imbalance may attract buyers again.
MMC reversal structures might be anticipated.
This zone aligns perfectly with the broader MMC concept of flipping between major zones and reversal blocks.
🧠 Trade Idea & Strategy (MMC Traders’ Minds)
Current Bias: Bearish
Entry Trigger: After rejection from trendline & 2x supply area.
Stop-Loss Suggestion: Above the trendline or recent supply wick (~3,375-3,380).
Take-Profit Zone: Primary TP at 3,331.90, with eyes on lower reversal targets if momentum persists.
Market Behavior: Controlled by sellers, liquidity sweeps seen, weak demand below Central Zone.
📌 Key Events to Watch
As marked at the bottom, major US news events are scheduled between July 30th and 31st, which could act as catalysts for price acceleration toward the reversal zone or cause sharp volatility. Plan accordingly.
🧭 Conclusion:
Gold is respecting bearish market structure under the MMC model. With clear QFL breakouts, rejection from 2x Supply, and weak bullish attempts near the Central Zone, this chart favors short setups targeting the 3,331.90 zone. MMC traders should monitor price action closely within the Reversal Zone for potential buy signals or trend continuation if sellers remain aggressive.
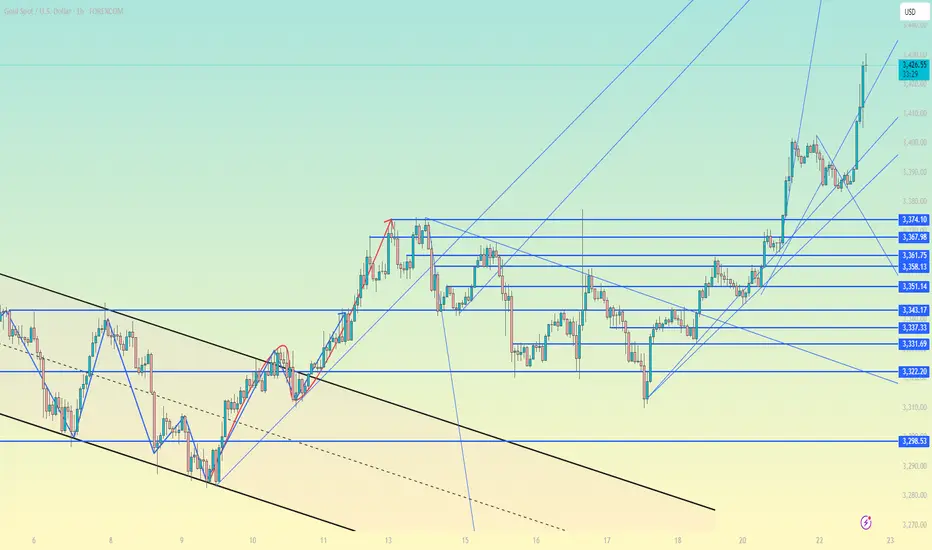
Gold fluctuated downward. Or it will continue.Gold was blocked near 3393 in the early trading on Thursday and began to fluctuate and fall, falling to 3351 as low as possible, then stopped falling and rose, and after rebounding near 3377, it was blocked and fell back to 3370 and fluctuated up and down, and the daily line closed with a negative line.
After three consecutive positive rises from last Friday to Tuesday this week, gold ushered in a turning point on Wednesday. On Thursday, it continued to fall and broke through the 5-day and 10-day moving averages, and the short-term market weakened. From the overall structure, the rising channel since June 26 remains valid. The highs on Tuesday and Wednesday approached the upper edge of the channel and then fell. The current price turned to fall and approached the lower edge of the channel.
There are two key positions for the support below: the first support level is near 3345, which is the lower edge support of the current rising channel; the second support level is near 3325, which is the trend line support formed by the connection of the previous low points.
From the 4-hour chart, the 3351 low point and the rebound resistance level can be used as a reference for today's long-short game. The breaking of key support and resistance will determine the trend direction of the next stage.
Operation strategy:
Short near 3375, stop loss 3385, profit range 3350-3330
Long near 3330, stop loss 3320, profit range 3350-3370

xauusdupdate on gold ,right now on the daily we are still looking forward on a break so waiting carefully for that monster push above the 3440 areas

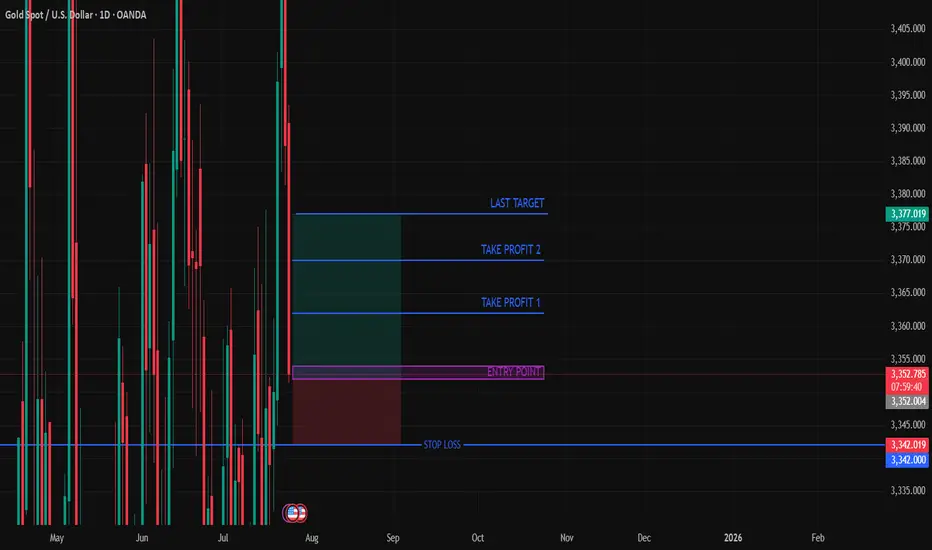
CHECK XAUUSD SIGNAL READ CAPTIONEntry Point 3352 -3354
Take profit 1 3366
Take profit 2 3370
Last target 3377
STOP LOSS 3342
Gold (XAU/USD) Analysis:Gold prices declined yesterday and today, driven by selling pressure that broke the $3,420 level and held below it. Currently, the price is testing the $3,365 zone.
1️⃣ If the $3,360 support is broken and price holds below it, we may see a further decline toward $3,340, which could act as strong support and potentially trigger a bullish rebound.
2️⃣ On the other hand, if buying momentum emerges and price breaks above $3,380 and holds, this could lead to a move toward retesting $3,400 and eventually $3,420.
⚠️ Disclaimer:
This analysis is not financial advice. Please monitor market movements carefully and make trading decisions based on your own analysis.

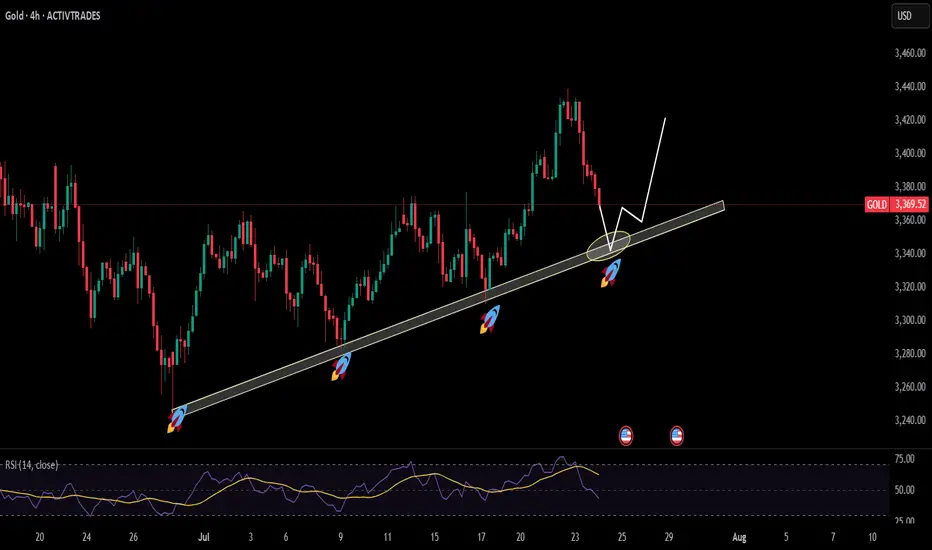
Gold is coming at support leveldrawn trendline has been proven a major support level for gold as the price has tested it multiple times and get a decent bounce to make new highs currently price is again approaching the support level opportunity will be when price hit that level then look for buy setups on shorter tfs to get higher RR
XAUUSD
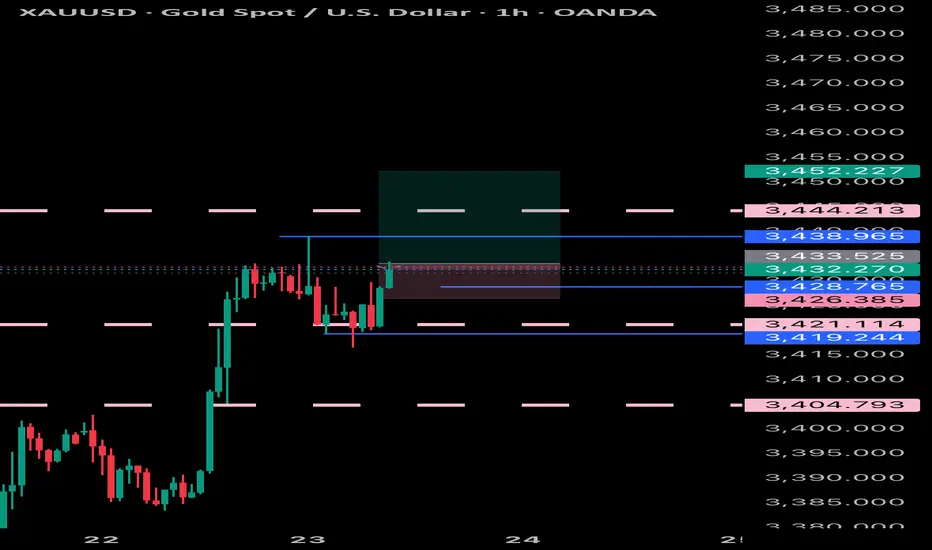
XAUUSD Updated in H1 :
The gold signal is marked on the chart based on the latest price changes and the supply and demand in the market. These points include the entry point, stop loss, and take profit

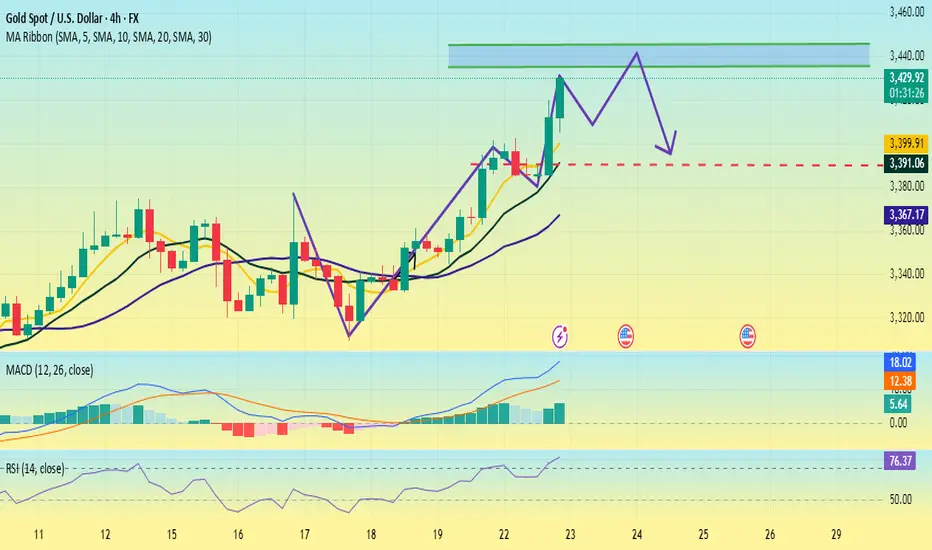
XAUUSD📈 Gold (XAUUSD) Price Prediction After Weekly Resistance Rejection
After gold price touched a weekly resistance and faced a strong rejection, while the overall trend remains bullish, we can outline two potential scenarios:
🔹 Primary Scenario (Bullish Continuation)
Price performs a healthy pullback to the nearest support zone (e.g., 50 EMA on H4 or previous minor support).
A rejection candle forms (e.g., pin bar or bullish engulfing), indicating buyers are still in control.
If the pullback holds:
Price could break through the weekly resistance again
And continue rallying toward the next resistance zone (e.g., $2,480 or $2,500)
✅ Confirmation:
RSI remains above 50 (bullish momentum intact)
No strong bearish divergence on H4/D1
Volume or open interest increases during upward moves
🔸 Alternative Scenario (Deeper Correction)
If the rejection leads to weaker buying volume:
Price may correct deeper toward a stronger support zone like the previous consolidation area (e.g., $2,400 or even $2,375)
Possible formation of a double bottom or higher low before resuming the uptrend
📊 Trading Strategy:
Buy on dip: Look for entries around key support zones, wait for bullish reversal confirmation
Use trailing stop if already in a buy position, as breakouts can be sharp and quick
Watch for upcoming fundamental catalysts (e.g., FOMC, CPI, US labor data) that may drive volatility

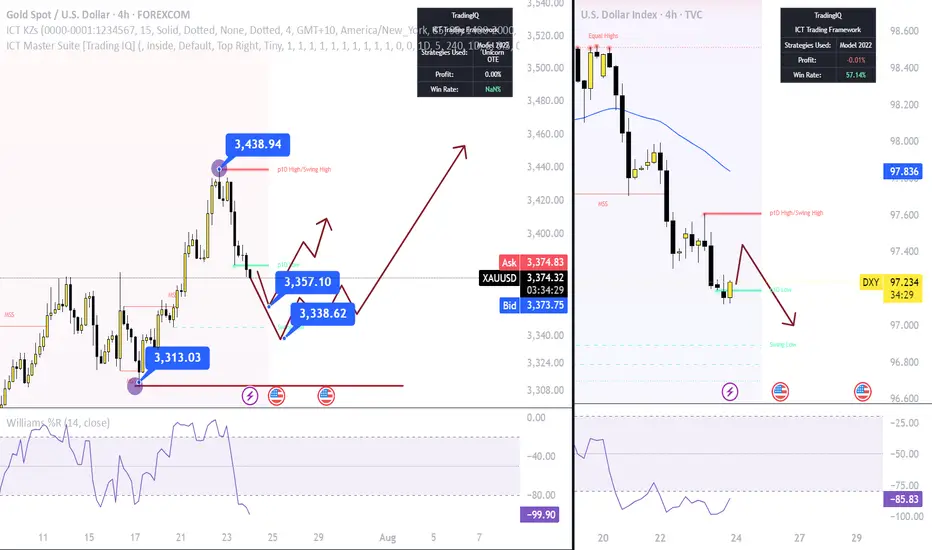
Gold at a Critical Reversal Zone – Waiting for Structural Break 📉 Gold Outlook – Corrective Dollar Strength & Potential Reversal Zones
🧭 Market Structure-Based Outlook with Multi-Timeframe Confluence
Gold is currently experiencing a controlled decline, primarily driven by a short-term corrective appreciation in the U.S. dollar.
This dollar strength is likely temporary and is expected to reverse toward the 3370–3354 zone — a technically significant area marked by previous liquidity sweeps and imbalance fills.
🔍 Technical Setup:
Bias (HTF): Bullish
Current Move (LTF): Corrective
Key Observation: No shift in long-term market structure on higher timeframes; price action remains within a bullish regime.
✅ Strategic Trade Plan:
We will not engage prematurely.
The optimal entry will only be considered upon a confirmed bullish market structure shift on the 15-minute timeframe — ideally a BOS (Break of Structure) followed by mitigation.
🛒 Entry Zone:
Around 3370 – 3354, contingent upon a clean bullish break in structure.
⛔ Invalidation Level (SL):
Below 3308 (structure invalidation + liquidity trap zone)
🎯 Profit Targets (Scaled):
TP1: 3400
TP2: 3430
TP3: 3500 – 3560
TP4 (Extended): 3600 – 3720
(Use partials & scale accordingly based on trade management plan)
🧠 Fundamental Confluence:
The macro picture remains supportive of higher gold prices.
Anticipated dovish shifts from the Federal Reserve, particularly in the form of rate cuts or forward guidance softening, may act as the macro catalyst for continuation toward new highs.
🛎 Conclusion:
While the current correction appears sharp, it lacks HTF structural reversal characteristics.
Patience and precision are essential — no entry should be considered without a 15m bullish break in structure.
Gold is weak. Will it continue to fall?Yesterday, the price of gold did not continue to rise as strong as in the previous two days. After reaching the previous top position, it began to retreat under pressure.
The market is too bullish, and under this pattern, the market is likely to have an unexpected reversal. Yesterday, it fell below the 3400 integer mark, so it is likely to maintain a volatile downward trend in the future.
The current main support level is around 3370, which is also the primary point for the bears to continue to break down in the future. Once it falls below this position, the target may be around 3345-3355. It cannot be said that it has completely turned to a bearish position at the moment. It is just a bearish oscillation pattern within a large range, and the upper pressure is maintained near 3405, which is also the support point for the first downward step of the bears on Wednesday.
Today, we still need to operate around the short position first. The price rebounds to 3405 and shorts, and the profit range is around 3390-3380, and the stop loss is 3415.
After a new low appears in the European session, wait for the US session to rebound and continue shorting.


Gold fell from a high and may fall back to the rangeGold fell from a high and may fall back to the range
During the U.S. trading session on Wednesday (July 23), spot gold fell from a high and is now trading around $3,390/ounce. Previously, gold prices broke through the $3,400 mark on Tuesday, reaching a high of $3,433.37/ounce during the session, a new high since June 16, and finally closed up 1% at $3,431.59/ounce.
The main factors driving the rise in gold prices include:
Weak U.S. dollar: The U.S. dollar index fell 0.3% to 97.545, a two-week low, providing support for gold.
Trade uncertainty: The market is closely watching the deadline for U.S. tariff negotiations on August 1, and the continued deadlock has increased risk aversion demand.
Lower U.S. Treasury yields: The downward trend in yields weakens the attractiveness of the U.S. dollar, and funds flow to gold.
However, if there is a breakthrough in trade negotiations or the Federal Reserve releases hawkish signals, market risk appetite may rebound and gold prices may face correction pressure. In the short term, gold prices are still dominated by fundamentals, but we need to be alert to the possibility of high-level shock adjustments.
Technical aspect: Overbought signals appear, pay attention to key support and resistance
Daily level:
Strong rise: three consecutive days of positive closing, breaking through the 3400 and 3420 trend line pressure, the Bollinger band opening widens, showing strong bullish momentum.
Overbought risk: RSI and MACD show a top divergence, technical correction needs are enhanced, but market sentiment still dominates the trend.
Key observation points: If it continues to close positive today, the upper target will look at 3450; if it closes negative, it may start a short-term adjustment and test the 3380-3370 support.
4-hour level:
Short-term peak signal: It hit 3438 in the early trading and then fell back. If it falls below the 3405-3400 support, it may further test 3385 or even 3375-3350.
Long-short watershed: If 3400 is held, high-level fluctuations will be maintained; if it is lost, the correction may continue.
Operation strategy: Be cautious about high-level fluctuations
Short-term resistance: 3400-3405 (if the rebound is under pressure, consider shorting)
Short-term support: 3380-3370 (if it stabilizes after a pullback, you can try long with a light position)
Summary: Although gold is still in a bullish trend, the technical overbought and fundamental uncertainty require vigilance against the risk of a high-level correction. It is recommended to rebound high and short as the main, and pull back low and long as the auxiliary, and pay close attention to the gains and losses of the 3400 mark and changes in market sentiment.
Gold going for ath again?Im looking for another long on gold! Dollar is dumping so gold should go up.. right? If it close above 3431 my long will be entered! So i will be sitting on my hands till than!

XAUUSD on bearish retest sellGold is currently still holding rising channel along with the swing moves we were on sell throughout from yesterday and my 1st Attempt on sell achieved with 200 PIPs Tp now I'm expecting the again reversal retest move!!
What's possible scanarios we have?
▪️I opened again sell opportunity from 3420-3425 area by following our structural retest strategy, my Selling trade target will be 3405 then 3395 in extension.
▪️if H4 candle closing above 3435 this Parallel moves will be invalid.
#XAUUSD

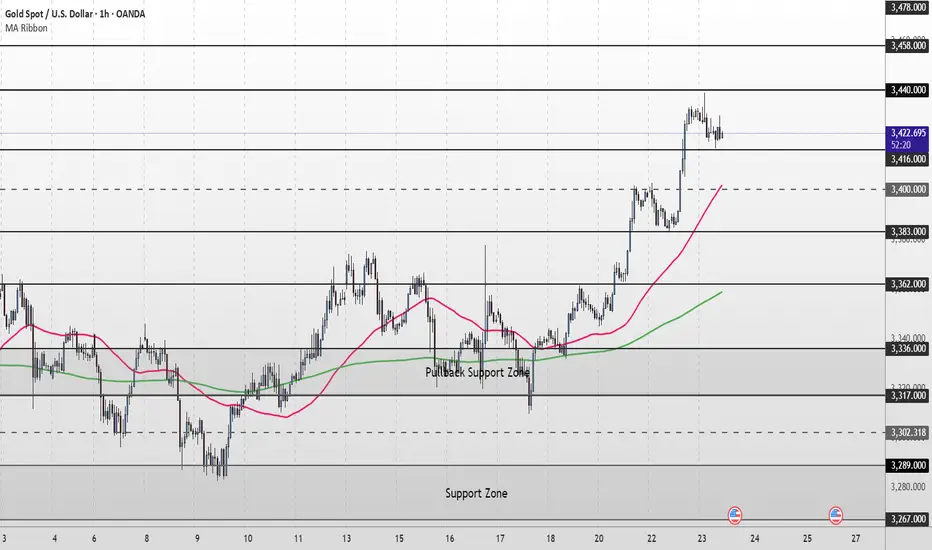
XAU/USD Intraday Plan | Support & Resistance to WatchGold has continued its rally, breaking through the 3,416 resistance and pushing into the next upside zone.
Price is now trading around 3,421, just below the 3,440 resistance cluster.
The structure remains bullish with price holding firmly above both the 50MA and 200MA, which are acting as dynamic support.
A confirmed break and hold above 3,440 would open the path toward 3,458 and potentially the higher‑timeframe target at 3,478 if momentum extends.
If price fails to sustain above 3,416–3,440 and begins to fade, watch the initial pullback toward 3,400.
A deeper move below that would shift focus to 3,383 - 3,362 and then the Pullback Support Zone.
Failure to hold there could expose price to the lower Support Zone if bearish pressure builds.
📌 Key Levels to Watch
Resistance:
‣ 3,440
‣ 3,458
‣ 3,478
Support:
‣ 3,416
‣ 3,400
‣ 3,383
‣ 3,362
‣ 3,336
🔎 Fundamental Focus
⚠️Not much on the calendar today. Still, manage your risk and stay prepared for any unexpected volatility.
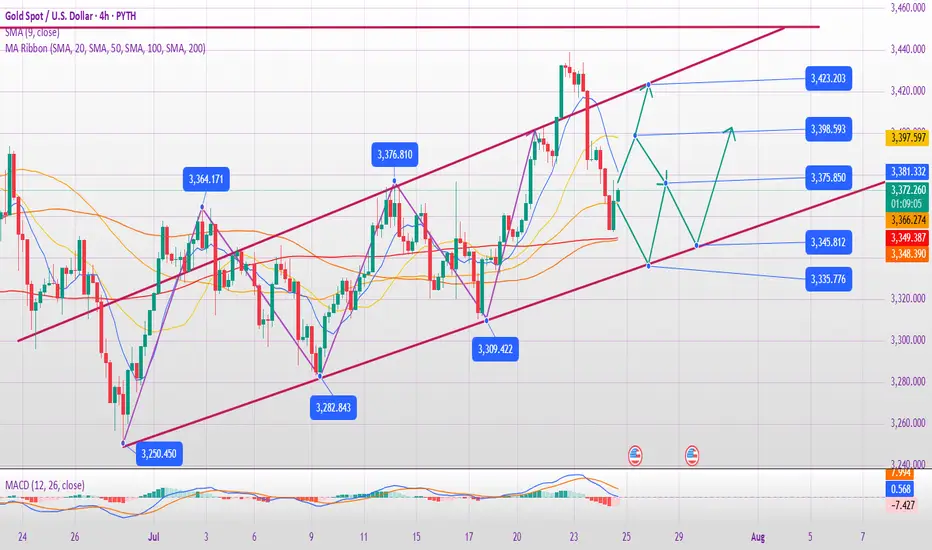
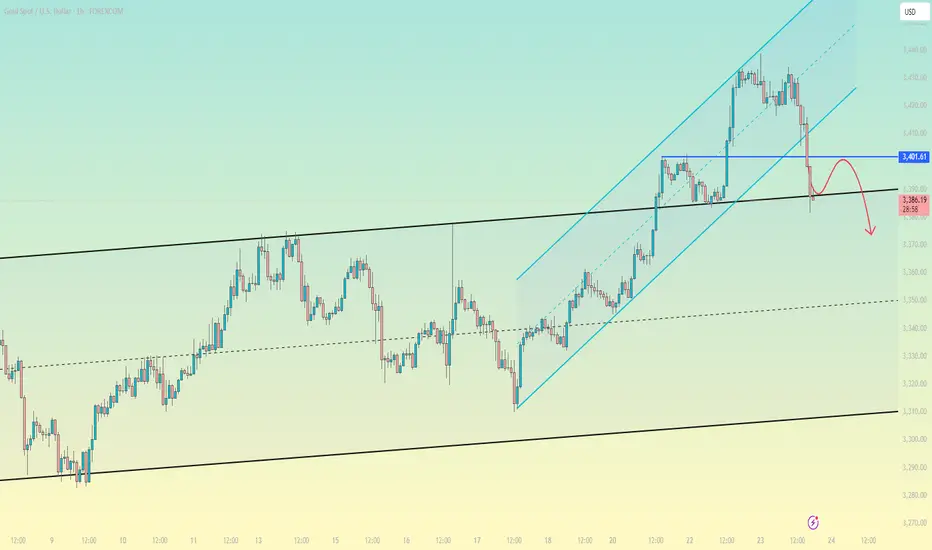
Gold (XAU/USD) 4‑Hour Technical Analysis: July 23, 2025Gold continues to trade in a bullish structure on the 4‑hour timeframe, holding above $3,420 after a steady advance from early July lows. At the time of writing, XAU/USD stands at $3,423.8, confirmed by Investing.com. This analysis employs a comprehensive blend of globally‑recognized technical tools — ranging from price action and classical indicators to institutional concepts — to identify the most probable trading zones and a high‑conviction setup.
Current Price Structure and Trend
On the 4‑hour chart, gold maintains a clear bullish market structure, consistently printing higher highs and higher lows since early July. The current price action unfolds within a well‑defined rising channel, bounded approximately between $3,400 on the lower side and $3,450 on the upper. Twice in the past week, price has tested and respected the channel’s lower boundary, confirming its validity.
Support and resistance levels are evident: immediate support lies at $3,410, coinciding with the 50% Fibonacci retracement of the July impulse wave. Below that, $3,390–$3,395 offers secondary support at the channel’s base and a longer‑term Fibonacci cluster. Resistance is concentrated at $3,445–$3,450, aligning with the channel top, upper Bollinger Band, and prior swing highs, while a secondary ceiling may emerge near $3,468–$3,470, corresponding to an Elliott Wave 3 extension target.
Candlestick, Volume, and Momentum
Recent price action has been supported by bullish candlestick formations. Notably, a strong bullish engulfing bar formed at $3,410 earlier this week, affirming institutional demand at that level. Volume profile analysis shows the heaviest transaction cluster between $3,410–$3,420, confirming this area as a smart money accumulation zone.
Volume‑weighted average price (VWAP ) currently runs near $3,418, with price holding above it, reflecting institutional positioning in favor of the bulls. Momentum indicators support the trend: MACD on the 4‑hour has just crossed bullish, RSI prints at 60 — strong but not overbought — and ADX climbs to 24, indicating a trend strengthening phase.
Indicators, Patterns, and Institutional Concepts
Trend indicators reinforce the bullish view. The 50‑ and 100‑period exponential moving averages converge around $3,415–$3,420, providing dynamic support. Ichimoku analysis shows price well above the Kumo (cloud), with a bullish Tenkan‑Kijun configuration. Bollinger Bands are widening, and price is leaning toward the upper band — a classic signal of volatility expansion in trend direction.
Classical and harmonic patterns offer further evidence. The current consolidation resembles a bull flag, suggesting continuation. Elliott Wave analysis points to a third wave in progress, with an upside projection into the $3,448–$3,468 area. Smart money concepts confirm that the recent break above $3,420 constituted a bullish break of structure (BOS), with price now retracing into a favorable gap (FVG) and a 4‑hour bullish order block anchored around $3,410–$3,415.
Liquidity and stop‑clusters likely sit above $3,445 and $3,468, making these logical targets for bullish campaigns.
Market Context and Sentiment
Gold is benefiting from a softening US dollar and a drop in volatility indexes. Seasonal tendencies also lean bullish into late summer. Sentiment on professional platforms aligns with this view: TradingView top authors and FXStreet analysts favor buying pullbacks into $3,410–$3,415 and targeting $3,450–$3,468, which harmonizes with this analysis. No major divergence from consensus is noted, adding to confidence.
Identified Trading Zones
Two strong buy zones emerge on the 4‑hour chart. The most immediate and highest‑confidence zone is $3,410–$3,415, supported by channel support, Fibonacci retracement, VWAP, moving averages, and an order block. Below this lies a secondary buy zone at $3,390–$3,395, tied to deeper Fibonacci support and the rising channel’s lower boundary.
On the other hand, clear sell zones are defined at $3,445–$3,450, where upper channel resistance, Bollinger bands, and prior highs converge, and a secondary zone at $3,468–$3,470, aligned with wave targets and round‑number psychological resistance. These areas are likely to attract profit‑taking and potential reversals.
The Golden Setup
Among the findings, one trade stands out as the highest‑conviction setup:
A long position at $3,415, with a stop loss at $3,405 and a take profit at $3,450.
This trade is backed by strong confluence: price pulling back into a well‑defined demand zone ($3,410–$3,415) that features order block support, Fibonacci retracement, VWAP alignment, EMA cluster support, and a rising channel boundary. The target sits just below the first significant resistance band ($3,445–$3,450), offering a favorable risk‑to‑reward ratio. The confidence level on this setup is rated at 8/10, given the multi‑method alignment and consistent sentiment from professional sources.
Summary Table
Category Levels / Details
Buy Zones $3,410–$3,415, $3,390–$3,395
Sell Zones $3,445–$3,450, $3,468–$3,470
Golden Setup Long @ $3,415 / SL $3,405 / TP $3,450 (Confidence: 8/10)
In conclusion, gold maintains a constructive technical outlook on the 4‑hour timeframe. The prevailing bullish structure, reinforced by classical and institutional methodologies, supports a continuation toward the $3,450–$3,468 region. The suggested Golden Setup provides a disciplined, high‑probability entry at a key inflection zone, consistent with both technical evidence and prevailing market sentiment.

XAUUSD IN A MAJOR REISTANCE ZONE Gold is forming a bearish harmonic pattern near a key supply zone. Momentum is waning, suggesting a potential reversal setup.

Gold is under pressure. Can it break through?Since the "W bottom" pattern was formed at the low of 3344 US dollars, the gold price broke through the neckline of 3380 and further stabilized at 3400 today, confirming the continuation of the medium-term upward trend. The moving average system is arranged in a bullish pattern, with the 5-day, 10-day and 20-day moving averages diverging upward in turn, and the support strength is stable.
The MACD indicator golden cross continues to expand, the upward momentum is enhanced, and no divergence occurs; the RSI indicator rises to around 76. Although it enters the overbought range, there is no obvious turn, indicating that the bullish momentum is still being released.
The current support level has risen to around 3390, and the support level has risen sharply. The resistance position needs to pay attention to 3430-3440. At present, several times have tested above 3430, but they have not stabilized above this position.
Operation suggestions:
3390-3400 light position to try more, stop loss 3360, profit range 3435-3445.
If it encounters resistance and falls back near 3435, you can consider short-term short orders with stop loss at 3445 and profit range at 3400-3380.
Although the upward momentum continues, some risk information still needs to be paid attention to; this week, we need to pay attention to the US June existing home sales data (July 23), the preliminary value of the second quarter GDP (July 25) and the core PCE price index (July 26). If the data is stronger than expected, it may trigger expectations of interest rate cuts.
Gold technical analysis and operation strategyGold technical analysis and operation strategy
Market review and current trend
Gold fell from $3402 as expected in the morning trading today. After the price rose in resonance in the evening, it chased more again at 3397.8. The current gold price has broken through the short-term acceleration line. The key resistance above is at $3420 (the pressure of the convergent triangle trend line). If it is touched for the first time, you can try shorting. The support below focuses on 3400-3405. After stabilization, it is still bullish. Breaking through 3420 is expected to challenge the previous high of 3452.
Key driving factors of fundamentals
Fed policy expectations: The market focuses on the speech of Fed Chairman Powell at 20:30 tonight. If he releases dovish signals (such as hinting at a rate cut), it may boost gold; if he maintains a hawkish stance, gold prices may be under pressure by 37.
Geopolitical and trade risks:
The escalation of the conflict between Russia and Ukraine has boosted safe-haven demand, and gold open interest has surged by 23%5.
As trade frictions between Europe and the United States intensify, the EU may impose retaliatory tariffs of $72 billion on the United States, exacerbating market volatility6.
US dollar and US Treasury yields: The US dollar index fell below 98, and the 10-year US Treasury yield fell back below 2%, reducing the cost of holding gold and supporting the gold price of 610.
Key points of technical analysis
Support level:
3400-3405 (short-term long-short watershed)
3385 (today's low, key defensive position)
3360-3350 (daily moving average support) 18
Resistance level:
3420 (convergent triangle upper track, short short for the first time)
3452 (previous high pressure, may accelerate upward after breaking through) 10
Operation strategy
Short-term short order: first touch 3430 light position short, stop loss 3438, target 3415-3410.
Pullback long: 3410-3405 stabilizes and then long, stop loss 3395, target 3430, break to see 3430-3452.
Breakout strategy: If it stands firm at 3420, you can follow up with long orders, with the target being 810 above 3450.
Risk warning
Powell's speech may cause violent fluctuations. It is recommended to control positions and avoid heavy positions in the data market.
If it falls below 3385, the short-term bullish structure may be destroyed, and we need to be vigilant about further corrections to 3360-3350.