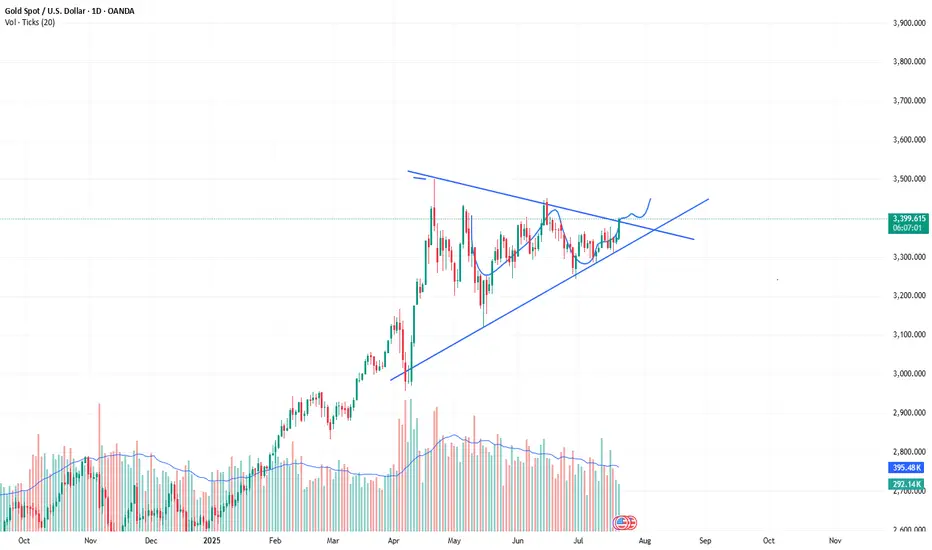
XAUUSD(GOLD) Triangle pattern formation I can see triangle pattern formation in gold. I am waiting for brakeout above the supportzone in Daily TF and 4H TF.
XAUUSDK trade ideas

Bearish ContinuationOn a daily Overview,buyside liquidity has been taken out and then structure broken to the downside, price has retraced back to the premium price
XAUUSD SEEMS BEARISHAs we can see gold has created Descending triangle pattern which lead the gold in more bearish momentum.

XAUUSD | 22 July 2025XAU/USD (Gold Spot) Technical Analysis – 15-Minute Timeframe
Date: July 22, 2025
Current Market Condition:
Gold is currently in a correction phase after a strong bullish move. The price is hovering around $3,385.51, just below the 0.618 Fibonacci retracement level, indicating potential bearish pressure.
Technical Breakdown:
Fibonacci Retracement & Extension:
The 0.618 retracement is at $3,388.49, acting as a key resistance zone.
Price attempted a pullback to the 0.5–0.618 retracement area but failed to break above, suggesting continuation to the downside.
Bearish targets lie at:
1.272 extension @ $3,382.85
1.618 extension @ $3,379.87
2.618 extension @ $3,371.25
Extreme target: 3.618 @ $3,362.64
Base Area (Demand Zone):
A consolidation zone is identified around $3,368 – $3,364, marking a strong demand area.
This zone could act as a potential rebound point if price continues to drop.
Price Action:
Clear rejection from a small supply zone (highlighted in red) near the 0.618 retracement.
Price formed lower highs and lower lows, supporting a short-term downtrend.
A downward arrow indicates expectation of further bearish movement.
Trading Bias:
Short-term bias: Bearish, as long as the price stays below the $3,389 resistance.
Ideal short entries were triggered in the 0.5–0.618 retracement zone, with stop loss above recent highs (~$3,393).
🎯 Summary & Strategy:
Sell on Rally: Bearish continuation is expected unless price breaks and holds above $3,388–$3,389.
Take Profit Targets:
TP1: $3,379.87
TP2: $3,371.25
TP3 (extreme): $3,362.64
Strong Rebound Zone: Watch for potential buy signals near the Base Area at $3,368–$3,364

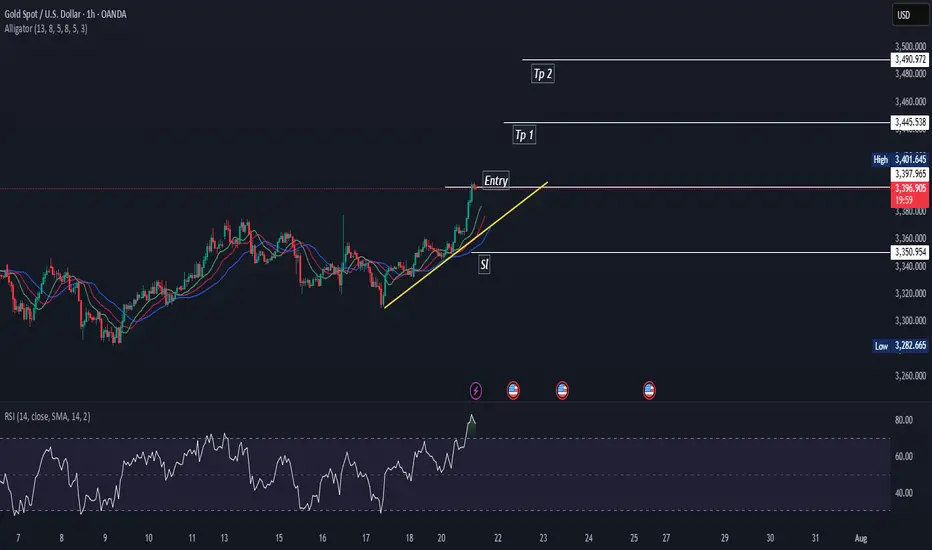
Gold Poised for Further Gains After Consolidation BreakoutGold looks well-positioned for further upside.
We've seen consolidation at the current level since April, volatility has decreased over the past few weeks, and yesterday there was a decent breakout to the upside, with price hugging the moving averages.
As of the current trading session, the price has pulled back slightly.
I believe the chances for continued growth are high.
📝Trading Plan
Entry: To enter the position, I’ll drop to the hourly chart and plan to buy around the 3360–3370 zone.
Alternatively, if the price doesn’t reach that area, I’ll look to buy on a breakout above yesterday’s high at 3404.
Stop Loss: A stop should be placed below yesterday’s candle low, around the 3340 level (-1.3%). Overall, that’s not a very long stop, so I’ll be looking to try a long position.
Target: Target is around $3.700.

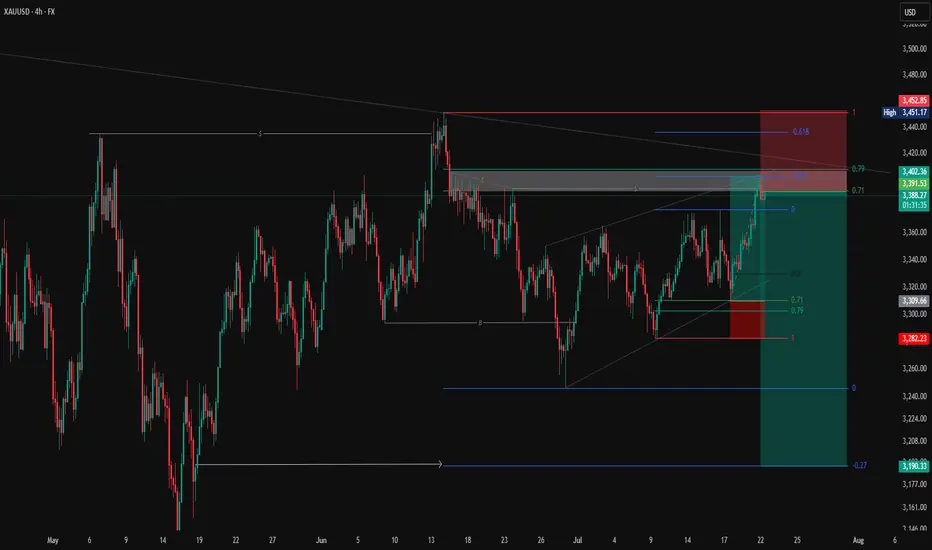
Elliott Wave Update – Is Wave 2 Complete?OANDA:XAUUSD
We're currently in an ABC correction following our Wave 1.
Potentially, Wave C is already completed, which would mean that Wave 2 has found its top.
❗ Why do I say potentially?
Because there's still a chance we could see a higher high before the real drop begins.
However, based on the current structure, I believe the top is in ✅
⚠️ Key Confirmation – White Trendline
📉 If we break below the white trendline, it confirms the end of Wave 2.
Then I expect a 5-wave move down:
➡️ (1) - (2) - (3) - (4) - (5)
📈 If the trendline holds, we might still see a higher Wave 2 before reversal.
📏 Fib Zones are marked on the chart for confluence and targets.
Let’s see how price reacts in the coming hours. A confirmed breakdown would set the stage for the next impulse ⚡

Gold Wave Analysis – 21 July 2025
- Gold broke resistance daily Triangle
- Likely to rise to resistance level 3450.00
Gold recently broke the resistance zone between the resistance level 3370.00 (upper border of the narrow sideways price range inside which Gold has been trading from the end of June) and the resistance trendline of the daily Triangle from April.
The breakout of this resistance zone accelerated the active impulse wave 3, which is a part of the intermediate impulse wave (5) from May.
Given the clear daily uptrend, Gold can be expected to rise further to the next resistance level 3450.00 (top of the minor impulse wave 1 from the middle of June).

Xausd techinical analysis.Xausd techinical analysis next move posibale at h1 time frame. not finchinical advice.

XAUUSDXAUUSD is in strong bullish trend.
Potentiallly printing HH and HL.
Alligator mouth is open which strongly indicates trend will continue.
We buy at CMP.
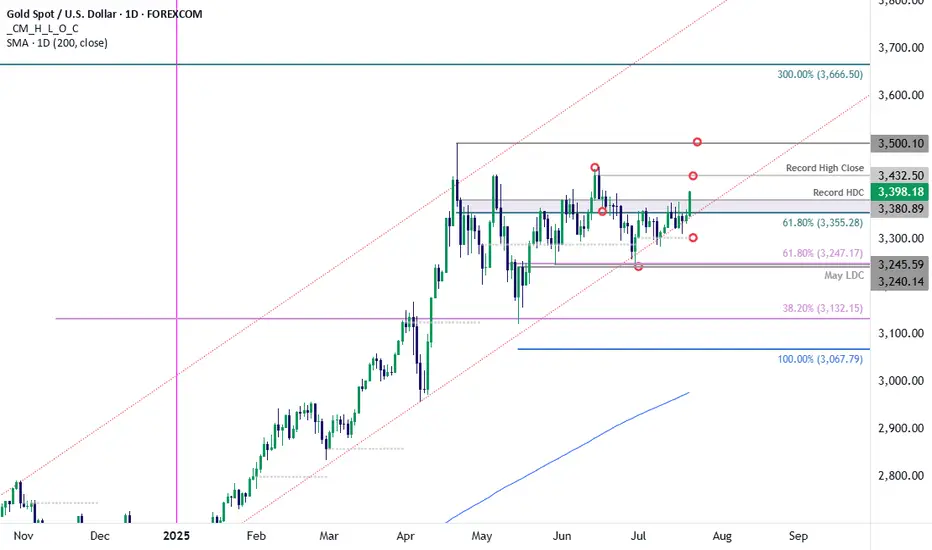
Gold Bull Charge- XAU/USD Clears July Opening-RangeGold is attempting to breach resistance today at the 61.8% retracement of the April decline / record high-day close (HDC) at 3355/80- watch the close.
The advance marks a breakout of the July opening-range and a topside breach here exposes the record high-close at 3432 and the record highs at 3500.
Initial support now back at 3355 with bullish invalidation steady at the objective monthly open at 3303.
-MB
XAUUSD:The next target is 3430.The market is developing completely in accordance with the expectations of the band trading center. Today is a day of sharp rise. As Monday, this increase is quite considerable.
The three reminders to buy are all at a lower position. The post clearly points out that the market has reached 3400. 3400 is a controversial position. It needs to fluctuate in the New York market, and then there will be some breakthroughs. If it is stronger, it will directly break through the New York market. In the short term, you can pay a little attention to the retracement position of 3390-3395. Then continue to buy. The next target is 3430.
XAU/USD Start July 20251. i start after XAU/USD break previous High and correction (fibbo 32.0) respected. based on elliot wave strategy we can targeting end of wave 3 at 3353 area and than correction wave 4 (target at fibbo 32.0 - 50.0). after target correction, continue wave 5 at target 3403 area.
2. fundamentally speaking, new months new quarter. there ins't new catalist and sentiment. Macro Economic this week focus on labour market at US and FED projection to cut rate.
3. War at Iran and Israel, Russia and Ukraine, India and Pakistan, Trade War case, etc,.
4. Will be update

Trading Game of the Day 21-JULY-2025Trading Plan :-
1-PDA:-from IRL (30m FVG )to the ERL(HOW)
2-Rejection +ifvg+fvg
3-mss
Thank you

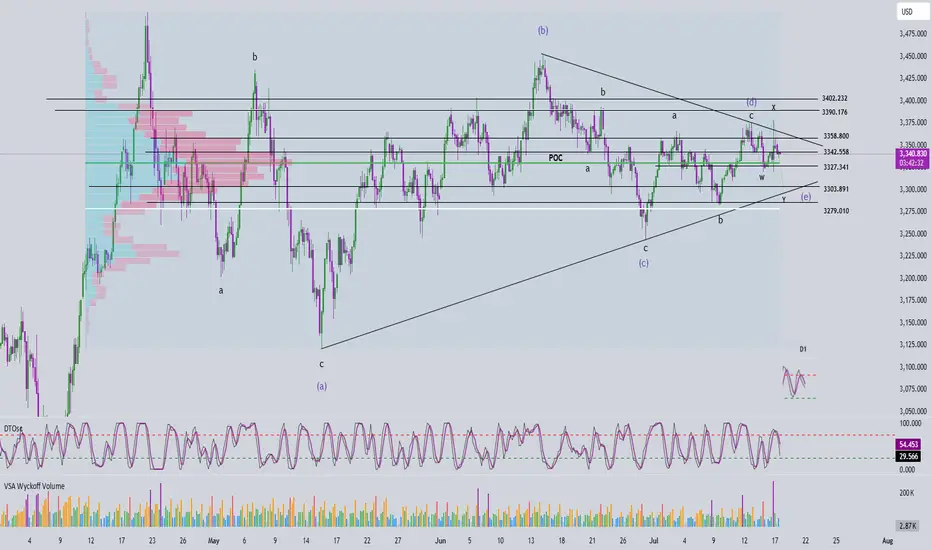
Elliott Wave Analysis – XAUUSD July 17, 2025
🔍 Momentum Analysis
D1 timeframe: Momentum is still trending downward, but we’re starting to see signs of convergence between the indicator lines. Normally, we would expect another two daily candles to reach the oversold zone and trigger a potential reversal. However, with the current narrowing pattern, we cannot rule out the possibility of an earlier reversal. Today’s daily close will be crucial for confirmation.
H4 timeframe: Momentum is clearly declining, suggesting that the market may either continue downwards or consolidate sideways throughout the day.
🌀 Elliott Wave Structure
On the H4 chart, price action is compressing tightly at the end of a symmetrical triangle pattern – a classic setup in Elliott Wave theory. Notably, this final point of compression coincides with the POC (Point of Control), indicating a key price level where high volume has accumulated.
Wave W (in black) follows a 3-wave structure. Yesterday, price surged to the beginning of wave W and then sharply reversed, forming the basis for two potential scenarios:
Scenario 1 – WXY structure with current price completing wave Y within wave e (green):
+ Target 1: 3327
+ Target 2: 3303
Scenario 2 – Wave e (green) evolves into a triangle:
+ In this case, price may consolidate sideways above the 3327 zone.
🔗 Combining Wave and Momentum Analysis
Both D1 and H4 momentum indicators are still pointing downward. However, the price candles appear overlapping and lack clear directional strength – a common trait of compression near the triangle’s apex. With price sitting right on the POC, there’s a high chance of continued tightening before a breakout. At this stage, the recommended strategy is to wait for a strong bullish candle at one of the target zones before entering a BUY position.
📈 Trade Setup
✅ Scenario 1 – BUY at 3327 – 3326
+ Stop Loss: 3317
+ Take Profit 1: 3342
+ Take Profit 2: 3358
+ Take Profit 3: 3402
✅ Scenario 2 – BUY at 3305 – 3302
+ Stop Loss: 3295
+ Take Profit 1: 3327
+ Take Profit 2: 3358
+ Take Profit 3: 3402
gold on sell#XAUUSD sell at 3362, the candle is rejecting on bullish which will make retracment on the price.
Entry below 3362 on H1 or M15 closure. Target 3344, stop loss 3372.
Bullish can break following longer candle closure on H1.

GOLD IN WAVE 3 – THE BULLISH MOMENTUM IS NOT OVER YETGOLD IN WAVE 3 – THE BULLISH MOMENTUM IS NOT OVER YET
Gold is currently unfolding within an Elliott Wave structure and is now in Wave 3 – typically known as the strongest and most impulsive wave in the cycle. Wave 3 often brings sharp price increases, supported by high trading volume and growing market participation.
Recent pullbacks may simply be internal corrections within this ongoing Wave 3, suggesting that further upside potential remains intact. From a technical standpoint, the broader trend remains bullish, and gold is likely to continue its upward trajectory in the coming sessions.
Traders and investors should monitor key support zones and continuation patterns on lower timeframes to identify good entry points. However, proper risk management is essential, especially in a volatile macroeconomic environment.
Conclusion: With gold in the middle of Wave 3, the prevailing trend is still upward. This is a key opportunity for medium- to long-term trend followers not to be missed.

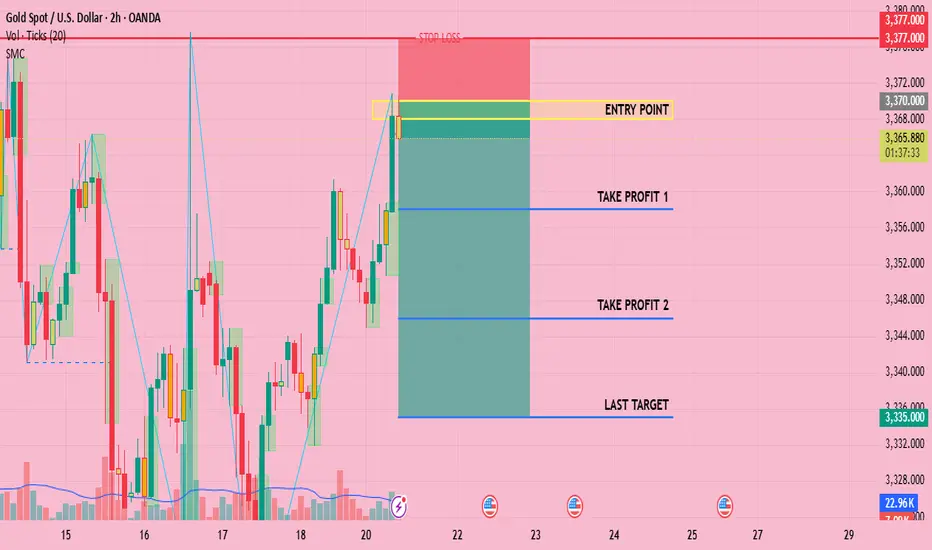
CHECK XAUUSD SIGNAL READ CAPTAINEntry Point: Around 3368 3370
Stop Loss: Around 3377.000
🎯 Target Levels
Take Profit 1:
3358.000
Take Profit 2:
3346.000
last target
3335.000
The range breakthrough is waiting for CPI to take effectIn the early stage, it was mainly volatile, and the lowest level in the morning reached 3334, which was also the position we went long last night. Today, we continue to focus on the 3340-45 line and go long, focusing on the release of CPI data. If CPI rises as expected, it means that inflation is rising, and the Fed's annual interest rate cut expectations will be further reduced, and gold prices may be under pressure to fall again; on the contrary, if CPI is lower than expected or even performs well, it means that Trump's tariff war has not had such a big impact on the market, and the Fed's interest rate cut expectations have increased significantly. After breaking through 3375, gold prices may accelerate to rebound to 3385-90 or even 3400. We focus on the release of data. If your current gold operation is not ideal, I hope I can help you avoid detours in your investment. Welcome to communicate with us!
From the 4-hour analysis, the bullish strong dividing line below is 3325-30. Below, we pay attention to the short-term support of 3340-45. The daily level stabilizes at this position and continues to maintain the bullish rhythm of stepping back and falling. The short-term pressure focuses on the vicinity of 3370-75. The overall high-altitude low-multiple cycle participation in this range remains unchanged. I will prompt the specific operation strategy in the link, so please pay attention to it in time.
Gold operation strategy:
1. Go long when gold falls back to 3340-45, and add more when it falls back to 3325-30. Stop loss 3317, target 3365-70, and continue to hold if it breaks;

XAUUSD - Bullish OutlookPair: XAUUSD (Gold) Bias: Bullish HTF Overview (4H): Price has taken major liquidity and mitigated a strong order block. We’re now seeing internal breaks of structure forming to the upside, indicating momentum toward the next high around 3440.000.
MTF Refinement (30M – 45M): Refined bullish structure is forming on the 30M chart, with clear signs of continuation. I’m watching for a deeper mitigation into the 30M OB where LTF confirmations (5M and below) will validate entry. The 45M helps provide a broader structure perspective and context.
Entry Zone: Pending — awaiting mitigation into the 30M OB + lower timeframe confirmation (i.e., 5M LH break or refined CHoCH).
Mindset Note: Currently in analyst mode — preparing for execution only after structure respects the top-down narrative. No rushing. Let price come to me.
Bless Trading!

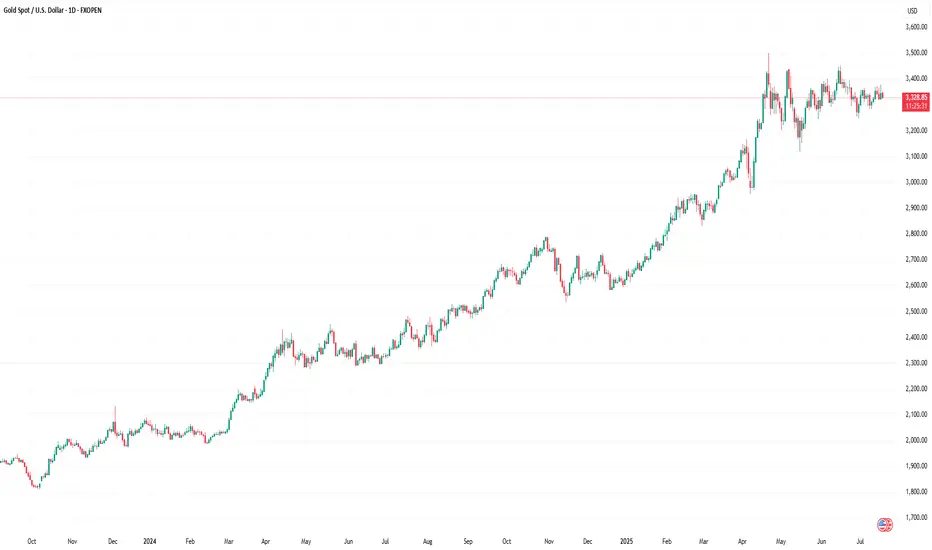
XAU/USD Chart Analysis: Volatility at a Yearly LowXAU/USD Chart Analysis: Volatility at a Yearly Low
The daily chart of XAU/USD shows that the Average Directional Index (ADX) has reached its lowest level since the beginning of 2025, indicating a significant decline in gold price volatility.
Yesterday’s release of the US Producer Price Index (PPI) initially triggered a sharp spike in gold prices, but the gains were short-lived, with the price quickly reverting to previous levels. This price action aligns with a broader market narrative of equilibrium—where supply and demand are in relative balance, and the market appears to be efficiently pricing in key influencing factors, including geopolitical tensions and tariff-related developments.
However, this fragile balance may soon be disrupted.
Technical Analysis of XAU/USD
From a broader technical perspective, gold remains within a long-term ascending channel (highlighted in blue) in 2025. Key observations include:
→ Attempts to rebound from the lower boundary of the channel (marked with arrows) lack conviction. Bulls are not capitalising on these opportunities to reignite the uptrend, suggesting a potential exhaustion of buying interest.
→ A trendline drawn across the major highs of 2025 has proven to be a strong resistance level. All recent breakout attempts have failed at this barrier.
As a result, the XAU/USD chart is showing signs of forming a large-scale triangle pattern, with its axis centred around the $3,333 level. If bulls continue to falter in extending the multi-month rally, it could encourage bears to challenge the lower boundary of the ascending channel, increasing the risk of a downside breakout.
This article represents the opinion of the Companies operating under the FXOpen brand only. It is not to be construed as an offer, solicitation, or recommendation with respect to products and services provided by the Companies operating under the FXOpen brand, nor is it to be considered financial advice.
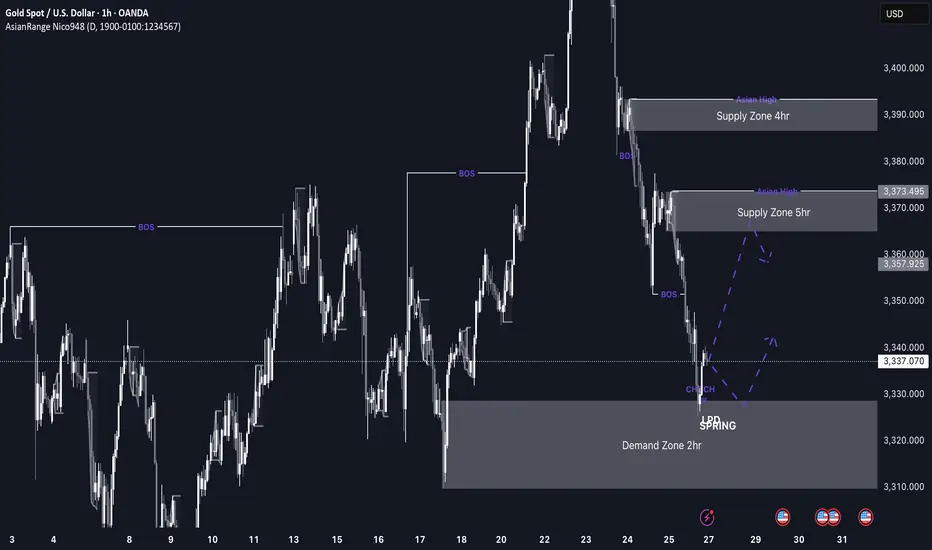
GOLD imminent possible buys up to 3,370 This week’s price action on GOLD is shaping up to be very interesting. After weeks of sustained bearish pressure, price has now entered a discounted 2hr demand zone sitting at a swing low, which makes it a high-probability area for a bullish reaction, especially as markets open.
If we do get the expected bullish reaction from this level, I’ll be watching the 3,370 region, where there’s a clean 5hr supply zone. If price reaches that level, I’ll be looking out for distribution and a potential short setup from there.
Confluences for GOLD Longs:
Price has been very bearish recently, so a retracement is expected
Currently sitting in a discounted 2hr demand zone
The overall long-term trend is still bullish
Early signs of accumulation and bullish reaction from this zone
P.S. If price fails to hold this current demand zone and breaks lower, then bearish momentum may continue. In that case, I’ll look for new long opportunities around 3,290 where a deeper demand zone exists.
Gold Weekly Summary and Forecast 7/27/2025My last week's weekly post is still valid at this moment.
I was expecting heavy drop for gold last week. However, the market doesn't follow my instruction. Rather we have to react to whatever it provides. Gold rose at the first few days and gave a false break. It quickly dropped back down below 3365 and closed the week with a red candle.
This false break signals a strong momentum towards downside. I am still expecting price to touch at least 3255 this month or even 3180.
Next week my main strategy is selling. Let's see what the market will give us next week.

"GOLD Bandit Strategy: Loot Pips Like a Pro!🏆 GOLD HEIST ALERT! 🏆 XAU/USD Bandit Strategy (Swing/Day Trade)
Steal Pips Like a Pro! 💰🔓 Bull vs. Bear Raid Plan
🌟 Greetings, Market Pirates! 🌟
"The trend is your accomplice—time to loot!"
🔮 Thief’s Technical & Fundamental Intel:
XAU/USD (The Gold Vault) is flashing BEARISH signals, but we’re ready to raid both sides! Follow the heist blueprint below 👇
🎯 ENRY POINTS (Where to Strike!)
🏴☠️ LONG RAID (Bullish Thieves):
Break & Grab: Enter above 3450.00 (Pullback Zone)
"Wait for the breakout, then ambush!"
🐻 SHORT RAID (Bearish Bandits):
Sneak Attack 1: Sell below 3300.00
Sneak Attack 2: Sell below 3260.00 (Support Wall Cracked!)
🛑 STOP-LOSS (Escape Routes)
Bullish Trade: SL at 3230.00 (Guard your loot!)
Bearish Trade 1: SL at 3360.00 (Don’t get caught!)
Bearish Trade 2: SL at 3280.00 (Risk = Reward!)
(Adjust SL based on your risk appetite & lot size!)
💰 TAKE-PROFIT (Cash Out & Flee!)
Bullish Thieves: TP at 3270.00 (Or escape early!)
Bearish Bandits (1): TP at 3270.00
Bearish Bandits (2): TP at 3210.00 (Big score!)
⚠️ WARNING: Market Traps Ahead!
News = Danger Zone! 📢 Avoid new trades during high-impact news.
Trailing SL = Your Getaway Car! Lock profits & evade reversals.
📰 FUNDAMENTAL BACKUP (Why This Heist Works)
Bearish momentum fueled by macro trends, COT data, & sentiment.
Stay sharp—markets shift fast!
💥 BOOST THIS HEIST! 💥
Like & Share to strengthen our pirate crew! 🚀 More alerts = More profits!
🚨 Next Heist Coming Soon… Stay Tuned! 🚨
