Gold Trade Plan 08/07/2025Dear Trader,
Gold (XAUUSD) Analysis – 1H Timeframe | July 8, 2025
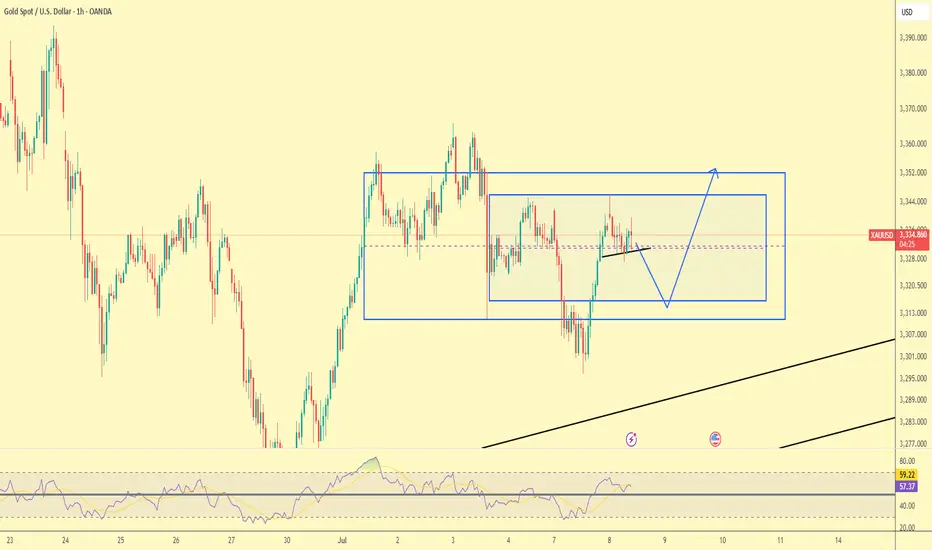
Gold has retraced from the 3,352–3,345 resistance zone and is now forming a slight bullish consolidation (small ascending triangle). A pullback toward the 3,316–3,311 support area is possible.
If price holds above this support, a bullish continuation toward 3,345 and 3,352 is likely. The 3,311 zone can act as a good potential scalp-buy area.
✅ Key Levels:
Resistances: 3,345 / 3,352
Supports: 3,316 / 3,311
Short-term trend: Bullish if support holds
RSI is at 56 — still has room for upward movement.
📌 Suggested Strategy: If price pulls back to 3,311–3,316 and shows confirmation (e.g., bullish candle pattern), short-term buy entries with targets at 3,345 and 3,352 can be considered.
Regards,
Alireza!
XAUUSDK trade ideas
Long on monday morning 3363 then short on Monday Gold still in range bound except both option 1st long on monday 3363 then sell from. this area to 3277 zone then continue till liquidation 3233

July 8, 2025 - XAUUSD GOLD Analysis and Potential OpportunityAnalysis:
Bullish momentum remains strong. Watch the 3350 level as key resistance.
No clear directional bias yet, so Asia session strategy will focus on buying pullbacks near support.
🔍 Key Levels to Watch:
• 3375 – Resistance
• 3365 – Resistance
• 3350 – Resistance
• 3345 – Intraday key resistance
• 3330–3333 – Intraday key support zone
• 3322 – Short-term support
• 3315 – Support
• 3306 – Support
• 3300 – Psychological level
• 3295 – Key support
• 3275 – Support
📈 Intraday Strategy:
• SELL if price breaks below 3330 → watch 3326, then 3322, 3315, 3306
• BUY if price holds above 3346 → watch 3350, then 3355, 3360, 3365
👉 If you want to know how I time entries and set stop-losses, hit the like button so I know there’s interest — I may publish a detailed post by the weekend if support continues!
Disclaimer: This is my personal opinion, not financial advice. Always trade with caution and manage your risk.

Gold Market Eyes 3326 Mitigation Ahead of London OpenGold market looks set to pull back toward the 3326 zone during the Asian session close, aiming to mitigate prior imbalances. A clearer sentiment is anticipated as the market transitions into the London open, which may define the next directional push. follow for more insights , comment for more opinions , and do well to boost idea if you find this helpful

Psychology 2025 7/7/7In this video I break down my psychology around trading we all in this game for the same reason but you must understand yourself first before you understand the market..... blessed week everyone have a successfully trading week

DeGRAM | GOLD formed a declining peak📊 Technical Analysis
● Price has slipped back beneath the inner rising-channel median and is now riding a fresh descending channel; repeated failures at 3 355 have carved a lower-high sequence.
● A clean hourly close under 3 308 would confirm loss of the late-June support shelf and open the next structural pivots at 3 248 (mid-May swing) and 3 202 (channel base / former demand).
💡 Fundamental Analysis
● Firmer US payroll headline and another uptick in 2-yr real yields revived the dollar, while CFTC data show a second week of long liquidation in COMEX gold—dampening bid strength.
✨ Summary
Sell rallies ≤3 330; sustained trade below 3 308 targets 3 248 → 3 202. Bias void on an H4 close above 3 355.
-------------------
Share your opinion in the comments and support the idea with a like. Thanks for your support!

Bears pressure early week below 3300⭐️GOLDEN INFORMATION:
Gold prices (XAU/USD) face renewed selling pressure, dipping toward the $3,320 level during the early Asian session on Monday. The pullback comes as June’s stronger-than-expected US Nonfarm Payrolls (NFP) report has reshaped market expectations around the Federal Reserve’s (Fed) policy path. Investors now turn their attention to the upcoming release of the FOMC Minutes on Wednesday for further guidance.
The US economy added 147,000 jobs in June, beating expectations and slightly up from May’s revised figure of 144,000. Meanwhile, the Unemployment Rate held steady at 4.1%. These figures reinforced the view that the labor market remains resilient, thereby lowering the odds of an imminent Fed rate cut. As a result, the US Dollar has strengthened, weighing on non-yielding assets such as Gold.
⭐️Personal comments NOVA:
Downtrend at the beginning of the week, gold price returns to accumulate below 3300
⭐️SET UP GOLD PRICE:
🔥SELL GOLD zone: 3337- 3339 SL 3344
TP1: $3328
TP2: $3312
TP3: $3300
🔥BUY GOLD zone: $3297-$3295 SL $3290
TP1: $3308
TP2: $3320
TP3: $3330
⭐️Technical analysis:
Based on technical indicators EMA 34, EMA89 and support resistance areas to set up a reasonable SELL order.
⭐️NOTE:
Note: Nova wishes traders to manage their capital well
- take the number of lots that match your capital
- Takeprofit equal to 4-6% of capital account
- Stoplose equal to 2-3% of capital account

Gold continues to fluctuate, where will it go next week?Fundamental analysis:
With the Trump administration's massive tax cut and spending bill officially implemented, the U.S. Treasury may start a "supply flood" of short-term Treasury bonds to make up for the trillions of dollars in fiscal deficits in the future. The market has begun to respond to future supply pressures. Concerns about the oversupply of short-term Treasury bonds have been directly reflected in prices - the yield on 1-month short-term Treasury bonds has risen significantly since Monday this week. A closer look at non-agricultural new jobs exceeded expectations, but nearly half came from government departments, which is likely to reverse in July. Slowing wage growth, declining total working hours, stagnant wage income growth, and worrying consumer spending are all signs of support for gold.
Gold bottomed out and rose from the low of 3245 this week, and then soared all the way to 3365. Finally, the weekly line closed with a positive line with an upper shadow. From the overall trend, after the data is digested, next week will still be treated with a volatile mindset. The large range will focus on the 3280-3393 area. If it does not break, it will still be mainly a sweeping operation. On the daily line, it also closed with a positive line with a long upper shadow, and closed firmly above 3323. It repeatedly tested the pressure of 3345 and did not break and fell back. The structure still maintained an oscillation rhythm within a small range. From the 4-hour cycle, the Bollinger Bands closed significantly. If it opens normally next week, pay attention to the 3325-3315 and 3311 areas when it falls back to support, and pay attention to the 3357 and 3365 positions when it hits the high pressure. It is recommended to maintain the strategy of selling high and buying low in operation and respond to the trend.For more specific operational details and strategy updates, please pay attention to the notifications at the bottom 🌐 and follow them in time.

Gold Market Update: Stuck in summer time range / SeasonalityGold is stuck so far last 4-6 weeks in tight range trading conditions
due to summer time seasonality also strong gains previously
expecting range locked conditions in July as well here's an
overview of 5 years and 10 years of seasonality data by month
until at least August expecting dead market conditions it's best
to focus on trading the range or trading with automated algo instead.
Here are the two tables showing month-over-month percent changes in gold prices (London PM fix USD/oz) for June, July, and August:
| Year | June Close | July Close | August Close | June % | July % | August % |
| ---- | ---------: | ---------: | -----------: | -----: | ------: | -------: |
| 2023 | 1,942.90 | 1,951.02 | 1,918.70 | –0.04% | +0.42% | –1.68% |
| 2022 | 1,836.57 | 1,732.74 | 1,764.56 | –5.65% | +1.80% | +1.80% |
| 2021 | 1,834.57 | 1,807.84 | 1,785.28 | –1.47% | –1.48% | –1.22% |
| 2020 | 1,761.04\* | 1,771.65\* | 1,968.16\* | +8.66% | +11.19% | +10.99% |
| 2019 | 1,342.66\* | 1,413.39\* | 1,523.00\* | +5.29% | +7.95% | +7.74% |
| 2018 | 1,270.00\* | 1,230.00\* | 1,194.00\* | –1.09% | –3.15% | –3.02% |
| 2017 | 1,257.00\* | 1,243.00\* | 1,280.00\* | +0.72% | –1.10% | +2.93% |
| 2016 | 1,255.00\* | 1,364.00\* | 1,322.00\* | +3.24% | +8.67% | –3.11% |
| 2015 | 1,180.00\* | 1,172.00\* | 1,116.00\* | –2.06% | –0.68% | –4.69% |
| 2014 | 1,320.00\* | 1,311.00\* | 1,312.00\* | –0.65% | –0.68% | +0.08% |
🔍 Summary Highlights
June has been weak more often than not—negative in 6 of the past 10 years.
July shows modest gains overall—positive in 7 of the last 10.
August is the strongest summer month—positive 6 times out of the past 10, with several double-digit y/y gains (like +10.99% in 2020).

On Swing Traders’ Radar: Gold Pattern Alert on the Daily Chart!Dear Traders,
In my daily gold analysis, I’m observing a Head and Shoulders pattern nearing completion. The neckline is currently positioned around the 3,247.00 level.
If this neckline breaks to the downside, gold could potentially drop toward the 3,150.00 area.
Since this is a one-day analysis—aligned with a swing trading style—it may take some time for the setup to fully play out.
I meticulously prepare these analyses for you, and I sincerely appreciate your support through likes. Every like from you is my biggest motivation to continue sharing my analyses.
I’m truly grateful for each of you—love to all my followers💙💙💙

Gold will exit from pennant and then rise to resistance levelHello traders, I want share with you my opinion about Gold. Recently, the price formed a pennant pattern after a sharp bullish impulse from the buyer zone (3275–3285 points). That upward movement started after the price bounced off the strong support level (3285) and broke out from the wedge structure formed earlier. This bullish momentum indicated strong demand near the lower boundary, reinforcing the current market structure. Now, the price is consolidating inside the pennant formation, slowly approaching its apex. At the same time, we are still above the support trendline and close to the upper border of the pattern. This suggests a possible breakout to the upside. I expect that gold will soon exit the pennant and start rising again toward the resistance level at 3385, which also matches the seller zone (3385–3395 points). This area previously acted as a major reversal zone, so if price reaches it, I will consider locking profits at that point. Given the breakout structure, recent bounce from the buyer zone, and current bullish consolidation, I remain bullish and expect GOLD to continue growing toward TP 1 at 3385. Please share this idea with your friends and click Boost 🚀
Disclaimer: As part of ThinkMarkets’ Influencer Program, I am sponsored to share and publish their charts in my analysis.

THE KOG REPORT - Update & NFP analysis End of day update from us here at KOG:
We managed to get the move into the red box we wanted which should have been a enough for the day. However, the levels were so clean during NY that we managed to get another decent trade into the Excalibur target to complete the day.
With NFP tomorrow and a US holiday on Friday, we're going to share our levels and view but due to unforeseen circumstances, I won't be around for the rest of the week to see it through.
We've added the updated red boxes, the key levels and the potential move if they break. So far, we've had a good week, so these levels are simply for reference and unless there is a clean set up, our traders will stay away until Monday.
Red boxes:
Break above 3350 for 3355, 3362, 3373, 3375 and 3390 in extension of the move
Break below 3335 for 3320, 3316, 3310. 3306, 3298 and 3285 in extension of the move
The week so far:
KOG’s bias for the week:
Bullish above 3250 with targets above 3278✅, 3285✅, 3297✅ and above that 3306✅
Bearish below 3250 with targets below 3240, 3232, 3220 and below that 3212
RED BOX TARGETS:
Break above 3275 for 3279✅, 3285✅, 3289✅ and 3306✅ in extension of the move
Break below 3260 for 3255, 3251, 3240 and 3235 in extension of the move
As always, trade safe.
KOG

XAUUSD BUY 3260On the 4-hour chart, XAUUSD is currently fluctuating and falling, and the short-term market is expected to continue to fall. The current support below can be focused on around 3260, which is a potential buying position for the bullish bat pattern, and this position is also in the previous demand area.

Bearish reversal off pullback resistance?XAU/USD is rising towards the resistance level which is a pullback resistance that is slightly below the 38.2% Fibonacci retracement and could drop from this level too ur take profit.
Entry: 3,324.16
Why we like it:
There is a pullback resistance level that is slightly below the38.2% Fibonacci retracement.
Stop loss: 3,344.28
Why we like it:
There is an overlap resistance level that aligns with the 61.8% Fibonacci retracement.
Takeprofit: 3,295.40
Why we like it:
There is a pullback support level that aligns with the 61.8% Fibonacci retracement.
Enjoying your TradingView experience? Review us!
Please be advised that the information presented on TradingView is provided to Vantage (‘Vantage Global Limited’, ‘we’) by a third-party provider (‘Everest Fortune Group’). Please be reminded that you are solely responsible for the trading decisions on your account. There is a very high degree of risk involved in trading. Any information and/or content is intended entirely for research, educational and informational purposes only and does not constitute investment or consultation advice or investment strategy. The information is not tailored to the investment needs of any specific person and therefore does not involve a consideration of any of the investment objectives, financial situation or needs of any viewer that may receive it. Kindly also note that past performance is not a reliable indicator of future results. Actual results may differ materially from those anticipated in forward-looking or past performance statements. We assume no liability as to the accuracy or completeness of any of the information and/or content provided herein and the Company cannot be held responsible for any omission, mistake nor for any loss or damage including without limitation to any loss of profit which may arise from reliance on any information supplied by Everest Fortune Group.

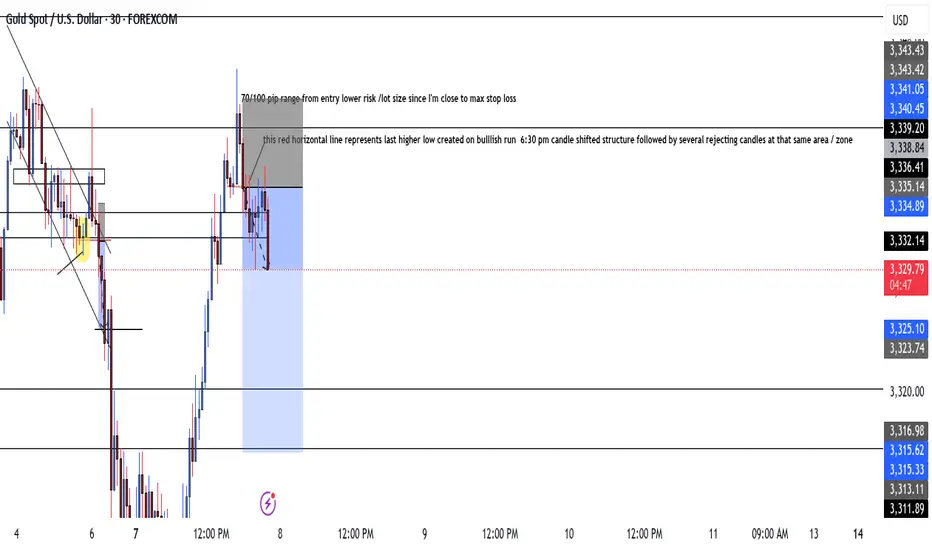
XAUUSD – High-Precision Sell Setup with 1:2.70 R/RGreetings, traders.
After a brief tactical pause, we’ve identified a **high-conviction short setup** on **XAUUSD**.
Despite the U.S. Independence Day holiday, structural momentum suggests there’s still room for meaningful movement in gold during today’s session. The risk-to-reward profile on this setup is exceptional — clocking in at **1:8.70**, it meets our highest-tier execution standards.
If momentum stalls or price consolidates excessively, the trade will be manually closed by **23:00 (UTC+4)**, regardless of outcome.
🧠 Trade Parameters:
• **Timeframe:** 1-Hour (H1)
• **Direction:** Sell
• **Entry:** 3337.09
• **Take Profit:** 3312.16
• **Stop Loss:** 3345.63
• **Risk/Reward Ratio:** 1:2,70
• **Trade Management Note:** Will be closed manually by 23:00 (UTC+4) if momentum conditions are not met.
🔗 Signal Source
All trade setups are published directly by Velatrix Capital — a high-discipline trading desk focused on FX, crypto, and global indices.
No opinions. No hype. Just statistically-grounded execution.
All signals are posted via our TradingView desk:
👉 (www.tradingview.com)
📈 **We don’t chase hype. We build edge.**
🔔 **Subscribe for future setups and institutional-grade trade intelligence.**
**Velatrix Capital**

GOLD → Consolidation after a trend break...FX:XAUUSD , after breaking out of a downtrend, is consolidating, which may continue for some time due to Thursday's news and low liquidity on Friday.
Gold stabilized after a correction, but volatility risks remain. After falling from a weekly high of $3,366, gold prices found demand again in Asia on Friday. Strong US employment data cooled expectations of an imminent Fed rate cut, which supported the dollar and limited gold's gains. Additional pressure is coming from the hawkish shift in Fed expectations, but US budget risks and weak liquidity due to the holidays could increase price volatility in the coming days.
Technically, the focus is on the boundaries of the current consolidation at 3311 and 3357. In addition, within the range there is an important level of 3325, which divides the market into bearish and bullish zones...
Resistance levels: 3350, 3357, 3393
Support levels: 3325, 3311
It is important to understand the situation: due to the holiday in the US, liquidity is lower, making it easier to move the price. The rest of the world, interested in gold, can easily push the price up. The trigger will be the zone 3350 - 3350. There is a chance that the market will try to break through the resistance without a pullback and continue to rise to 3393.
However, the most likely scenario is that after yesterday's volatility, gold will remain within 3325 - 3357 before rising next week
Best regards, R. Linda!

GOLD CONFIRM TRADE🔍 Chart Analysis Summary:
Current Price: ~3,336
Key Resistance (Supply Zone): 3,340 – 3,353
Major Resistance Above: 3,388 – 3,395
Key Support (Demand Zone): 3,320 – 3,330
Major Support Below: 3,294 – 3,305
⚔️ Trade Setup Ideas:
📉 Sell Setup (High Probability Intraday Short)
Scenario: Price is near the lower supply zone (3,340–3,353), showing rejection.
Entry: 3,340 – 3,345 (on bearish candle confirmation or rejection wick)
Stop Loss: Above 3,353 (zone high or recent swing high)
Take Profit Targets:
TP1: 3,330 (first minor support)
TP2: 3,320 (demand zone)
TP3: 3,295 (major support)
📌 Confirmation Tips:
Look for bearish engulfing / rejection candles
RSI divergence or weakness
Break of 3,330 support confirms continuation
📈 Buy Setup (If Price Drops to Demand)
Scenario: Price drops back into demand zone 3,320–3,330 with bullish reaction.
Entry: 3,322 – 3,328 (bullish wick or engulfing candle)
Stop Loss: Below 3,320
Take Profit Targets:
TP1: 3,340
TP2: 3,353 (supply)
TP3: 3,388 (major resistance)
📌 Confirmation Tips:
Bullish price action near 3,322 zone
Momentum buildup from demand
Use M15/M30 for refined entry

GoldHello everyone, I have a good prediction about gold. I analyzed chart of gold at monthly timeframe so in my opinion for some months, the price of gold will decrease and when it reach to blue line or reach to $2600 after that, it changed the road and it going to increase.
This analyze recommend to long-term traders
Have a good trade

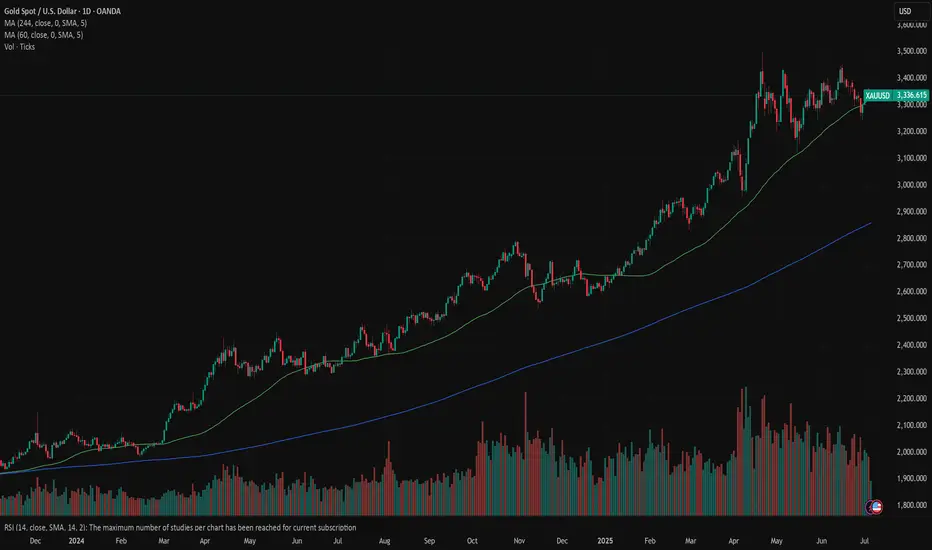
Gold: struggle with upside momentumThe price of gold was traded at modestly higher grounds during the week, which was impacted by the further weakening of the US Dollar and also concerns raised by the approval of the so-called Trump's tax megabill, which passed the US Senate during the previous week. Investors perceive tax cuts negatively, which are estimated to add $3,4 trillion to already concerned US debt over the period of the next 10 years. As analysts are commenting, on a long run increased US debt will further weaken US Dollar, which will be positive for the price of gold.
The price of gold started the week around the level of $3.250 and headed toward the highest weekly spot of $3.360. It is ending the week modestly lower, at $3.336. The RSI is still not showing any clear movement to either side, sliding around the level of 50.The MA50 has shortly continued to act as a supporting line for the price of gold, although it has been breached at one moment during the week. MA200 is moving without a change, with a holding uptrend. The potential cross is still not in store for these two lines.
The week ahead is not bringing currently important macro data for the US economy, in which sense, higher volatility is not expected. Still, any news related to trade tariffs, might shortly move the market to one side. Current charts are showing that the price of gold is struggling to sustain the upside momentum, in which sense, some further retracements might be possible in the weeks to come. As per current charts, the support line at $3.280 might be tested in the coming period. On the upside, no significant movements are to be expected. There are some probabilities for the level of $3.360 in the week ahead, with lower probability that $3.400 resistance could be tested again.
More than 2.500 pips down coming next week on gold.Next week I guess strong bearish rejection on gold. My expectation target is below 3100$ to pick up the liquidity before the next bull run regarding the fact of coming decreasing of interest rates.
My tp is 3070-3080$

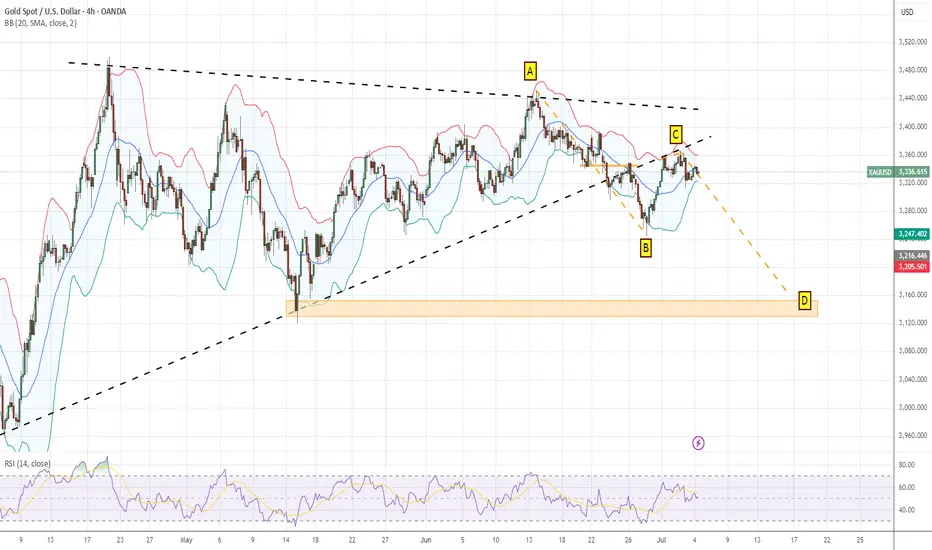
XAUUSD observationGold's current state
How should we view this?
Personal opinion:Retracement after the Triangle Convergence Breakout
Bearish expectations
The first Target is to complete AB=CD.
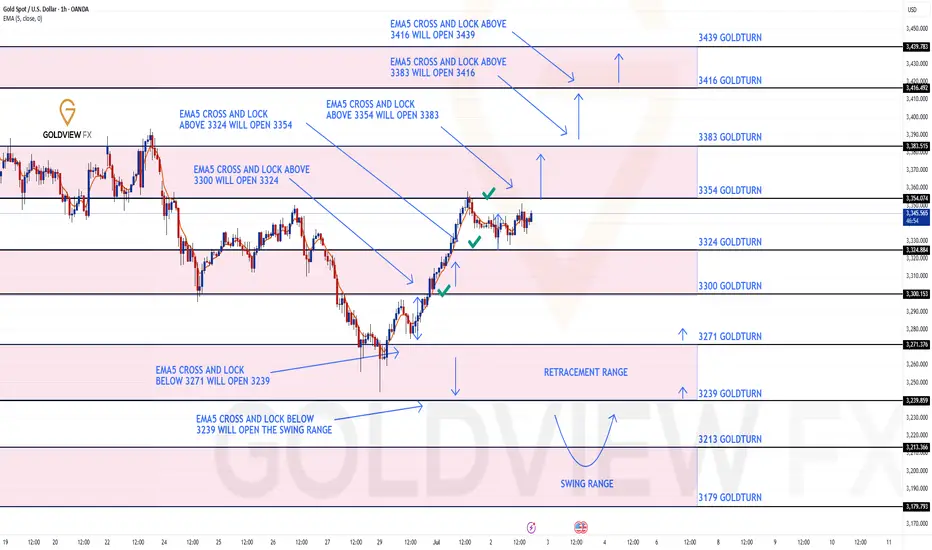
GOLD ROUTE MAP UPDATEHey Everyone,
Once again our chart idea and levels are being respected and playing out to perfection, allowing us to confirm continuations and rejections.
After completing our targets, 3324 and 3354 yesterday, we had no further cross and lock above 3354, confirming the rejection.
We are now seeing price play and consolidate between 3324 and 3354 and will need ema5 cross and lock on either level to confirm our next direction.
We will keep the above in mind when taking buys from dips. Our updated levels and weighted levels will allow us to track the movement down and then catch bounces up.
We will continue to buy dips using our support levels taking 20 to 40 pips. As stated before each of our level structures give 20 to 40 pip bounces, which is enough for a nice entry and exit. If you back test the levels we shared every week for the past 24 months, you can see how effectively they were used to trade with or against short/mid term swings and trends.
The swing range give bigger bounces then our weighted levels that's the difference between weighted levels and swing ranges.
BULLISH TARGET
3300 - DONE
EMA5 CROSS AND LOCK ABOVE 3300 WILL OPEN THE FOLLOWING BULLISH TARGETS
3324 - DONE
EMA5 CROSS AND LOCK ABOVE 3324 WILL OPEN THE FOLLOWING BULLISH TARGET
3354 - DONE
EMA5 CROSS AND LOCK ABOVE 3354 WILL OPEN THE FOLLOWING BULLISH TARGET
3383
BEARISH TARGETS
3271
EMA5 CROSS AND LOCK BELOW 3354 WILL OPEN THE FOLLOWING BEARISH TARGET
3239
EMA5 CROSS AND LOCK BELOW 3239 WILL OPEN THE SWING RANGE
3213
3179
As always, we will keep you all updated with regular updates throughout the week and how we manage the active ideas and setups. Thank you all for your likes, comments and follows, we really appreciate it!
Mr Gold
GoldViewFX