XAUUSD Bullish Outlook – Eyeing 3400+ Zone
Price is currently trading within a rising channel on the 1H timeframe. We are seeing a potential continuation move after a bullish structure was maintained above 3340 support.
🔹 Key Technical Highlights:
Price respecting ascending channel support.
Bullish reaction near lower channel & previous demand zone.
Short-term consolidation may occur near 3375–3385 supply before breakout.
Next key target: 3420–3440 Quasimodo supply zone.
XAUUSDK trade ideas

how i trade top down analysisits very important to known how to look at the Markert from head to shoulder

Why do you always miss the most stable trading opportunities?The market is always moving forward in the game between long and short positions. Sometimes the market is strong and sometimes it is falling rapidly. We cannot control the market trend. The only thing we can do is to protect the principal and stay rational. When the market is unclear, it is better to decisively exit and wait and see than to blindly waste energy. Whether the market rises or falls is not the most important thing. What you really need to think about is how you will deal with it, how much profit you can get when you are right, and how much loss you can avoid when you are wrong. This is the fundamental of trading.Trading method: follow the trend, macro resonance, refuse to bet everything, and implement iron discipline. Welcome like-minded friends to exchange technology, methods and trading experience, write analysis honestly, and trade seriously. I just hope you can take fewer detours!
Review of this week's upward trend analysis: This week, we did very well in gold. From Monday to Friday, the daily analysis layout and entry position were very accurate, the trend was correct, and it was simple and easy to do. Gold showed an overall volatile upward trend, which was in line with my previous prediction: First, the decline of the US dollar supported the gold price. The weakening of the US dollar increased the purchasing power of non-US currency holders, pushed up the demand for gold, and precious metals strengthened across the board. Second, the rise in risk aversion was affected by uncertainties such as the US fiscal deficit, tariff policy, and the independence of the Federal Reserve. The market's risk aversion demand increased, and bullish sentiment continued to be released.
As for the gold trend next week, the gold price bottomed out and rebounded this week, with obvious characteristics of washing and consolidation. The trend structure further converged and waited for the direction to be chosen. The weekly line closed with a long lower shadow and a small negative line. The daily line alternated between positive and negative, running between the middle and upper rails of the Bollinger Bands, continuing the slow bull shock pattern. Next week, focus on the break of the 3377-3309 range. If it does not break, maintain the high-altitude and low-multiple ideas. If it breaks, follow the unilateral trend. The short-term pressure is concentrated in the 3360-3370 area. It rose to this position on Friday and then fell back, showing obvious pressure. The lower support focuses on the 3330 line. It has not broken through many downward explorations, which has key support significance and needs special attention. If 3330 is lost, the bears may take the initiative. If it holds on and does not break, the bulls still have the upward momentum. Breaking through 3375 will open up the trend of rising space. In terms of operation rhythm, the short-term support focuses on 3345-3335. The key pressure above pays attention to the vicinity of 3380. Under the premise of no news stimulation, the market will most likely maintain a shock range this month.

XAUUSD
XAUUSD Updated in 30M :
The gold signal is marked on the chart based on the latest price changes and the supply and demand in the market. These points include the entry point, stop loss, and take profit.

How to seize deterministic trading opportunities?The rebound momentum of the gold market has been significantly enhanced today. After breaking through the 3345 resistance in the Asian session, it has continued to rise. It has now reached around 3360, and has rebounded by more than US$50 from this week's low of 3310, setting a new rebound high in the past three trading days. After the gold price effectively broke through the key resistance band of 3340–3350, it triggered some short stop loss trading and trend funds to enter the market, driving the price to accelerate the upward trend. Judging from the hourly chart, the trading volume has increased by about 30% compared with the same period yesterday, indicating that the market's recognition of this round of rebound has increased significantly.
A physically full sun candle chart has been closed in the 4-hour cycle, successfully standing on the Bollinger middle track, further confirming the upward structure, the mid-track support area 3340–3345 has become a key position for bulls' defense, and the short-term structure of the market is still relatively strong. Overall, the intraday retracement range of gold is limited, and the probability of continuing to rise is relatively high. In terms of strategy, it is still recommended to go long. In the short term, focus on the 3340–3345 area retracement support, and the stop-profit target is 3365–3370; if the upward breakthrough, pay attention to the suppression performance of the 3370–3375 line, beware of highs and falls, and pay attention to controlling risks.
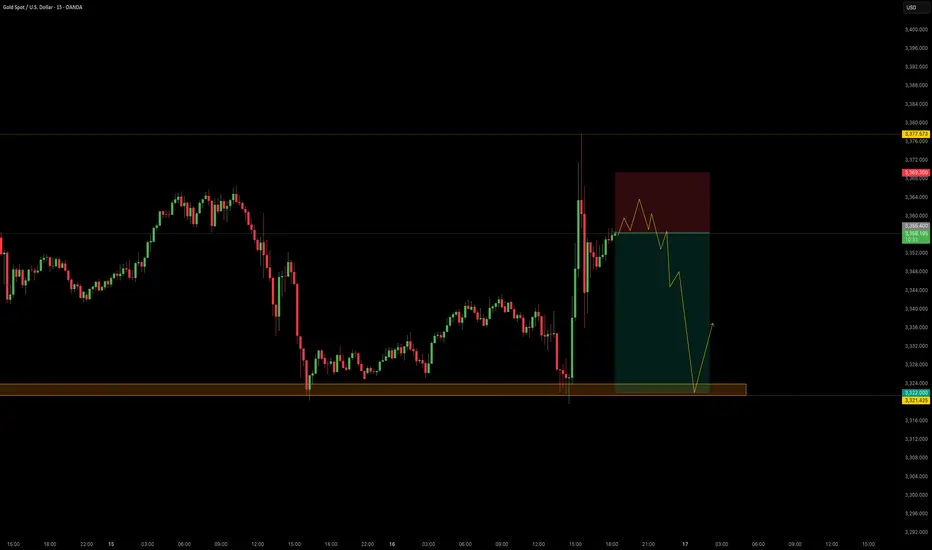
NordKern - XAUUSD InsightNordKern | Simplified Insight OANDA:XAUUSD Short Opportunity Ahead
Gold saw a sharp surge in price today, primarily driven by political headlines that temporarily shook market sentiment. To be specific:
📅 Jul 16, 2025 – 16:56 CET
CBS Reports: Trump asked Republican lawmakers whether he should fire Fed Chair Jerome Powell. This headline alone triggered an intraday spike of +$52/oz in gold as markets priced in increased macro and institutional risk.
As previously stated "Context Matters."
While the President cannot remove the Fed Chair without cause, even the suggestion introduces uncertainty and undermines confidence in the Fed’s independence especially ahead of a high-stakes election cycle.
However, further developments quickly followed: 📅 Jul 16, 2025 – 17:58 CET
Trump: “Firing Powell is highly unlikely.” 📅 Jul 16, 2025 – 18:06 CET
Trump: “Reports on me firing Powell are not true.” With this clarification, the initial rally appears overstretched and sentiment-driven, leaving room for a corrective pullback as the market digests the full picture.
Trade Setup - Short Bias
Parameters:
Entry: 3356.40
Stop Loss: 3690.30
Take Profit: 3322.00
Key Notes:
- The spike was headline-driven and not supported by policy shift or macro data.
- Trump’s denial removes much of the political risk premium that had been briefly priced in.
- Watch for momentum fading near resistance and confirmation via intraday structure.
This remains a tactically driven setup. Manage risk appropriately and stay alert for any renewed political developments.
THE KOG REPORT - UpdateEnd of day update from us here at KOG:
Nice start to the week with price attempting that higher red box and failing to breach it. We then activated an Excalibur signal short, identified the structure and got a lovely move into the 3552 level from 3371 activation. Traders then had the opportunity to capture the tap and bounce from the 50MA on the hourly, again giving a minimum of 100pips on the bounce.
Now, we have support below 3340 which was the bias level which has also rejected price giving a long, but, resistance here stands at 3357. Below that level we are more likely to see this range or attempt lower sticking to the plan on the KOG Report published yesterday.
KOG’s Bias of the day:
Bullish above 3340 with targets above 3375, 3388 and above that 3392
Bearish on break of 3340 with targets below 3335, 3332, 3320 and 3310 (No Breach)
RED BOXES:
Break above 3376 for 3382, 3390, 3396 and 3304 in extension of the move (No breach)
Break below 3365 for 3362✅ and 3355✅ in extension of the move
As always, trade safe.
KOG

Gold Weekly Summary and Forecast 7/19/2025Gold has been very choppy these two weeks. As the 2W closes, the falling line indicated in the 2W chart still interacts. As long as this line is not broken, gold could retrace further.
In weekly chart on the right, we are seeing a head and shoulder pattern has been formed. And the rejection level is aligning with 61.8% Fibo level retracement.
From the above two analysis, I am expecting gold to drop heavily next week to at least 3250 or even 3192.
Let's enjoy the weekend and I will come back with intraday analysis every day next week.

XAUUSD Bearish Structure Breakdown – Targeting 3310 ZoneXAUUSD is currently respecting the key resistance zone near 3340 and forming consistent lower highs, signaling a bearish momentum. After breaking the support area around 3325–3320, we expect price to continue its downward trajectory. If the support fails to hold, the next major target lies at the 3310 zone. This setup aligns with market structure and order flow, suggesting a high-probability sell opportunity on any pullback toward resistance.
Keep an eye on price action near the support zone for confirmation.
Bias: Bearish | Timeframe: 1H

GOLD tests $3,310 then recovers, continues sidewaysInternational OANDA:XAUUSD fell to the support level of 3,310 USD, then recovered and continued to stabilize sideways due to the stronger US Dollar and market tensions eased after US President Trump said it was "extremely unlikely" to fire Federal Reserve Chairman Powell.
As of the time of writing, spot OANDA:XAUUSD was trading at 3,339 USD/oz.
Reuters reported on Wednesday that Trump is still open to the possibility of firing Powell. However, Trump said on Wednesday that he has no intention of firing Powell at this time, but did not completely rule out the possibility and reiterated his criticism of the Fed chairman for not lowering interest rates.
Data showed US producer prices unexpectedly held steady in June, as the impact of higher import tariffs on goods was offset by weakness in the services sector.
The unchanged US PPI in June showed wholesale prices were stabilising, suggesting the economic impact of tariffs may be smaller than initially feared.
The lower-than-expected core CPI and core PPI data did not provide the boost that was expected, which could mean that the market is focusing on other aspects. More broadly, as the Fed gradually eases policy, real yields could continue to fall, and gold will maintain its upward trend. However, if the market continues to reprice expectations for a hawkish rate cut, this could trigger a short-term correction.
SPDR Gold Trust, the world's largest gold-backed exchange-traded fund (ETF), said its holdings rose 0.33% to 950.79 tonnes on Wednesday from 947.64 tonnes in the previous session.
Technical Outlook Analysis OANDA:XAUUSD
On the daily chart, gold rebounded after falling and tested the support level noted by readers in yesterday's edition at 3,310 USD. The recovery brought gold prices back to work around the EMA21, continuing the sideways accumulation trend.
Structurally there is no change, as for gold to qualify for an upside move it needs to break resistance at the 0.236% Fibonacci retracement level then the short term target is the raw price point of $3,400. Meanwhile for gold to complete its bearish cycle it needs to sell below the 0.382% Fibonacci retracement level then the short term target would be around $3,246, more than the 0.50% Fibonacci retracement level.
The relative strength index (RSI) is also unchanged with the RSI activity around 50, indicating a hesitant market sentiment without leaning towards any particular trend.
Intraday, the technical outlook for gold prices continues to be a sideways accumulation trend, and the notable positions will be listed as follows.
Support: 3,310 – 3,300 – 3,292 USD
Resistance: 3,350 – 3,371 USD
SELL XAUUSD PRICE 3386 - 3384⚡️
↠↠ Stop Loss 3390
→Take Profit 1 3378
↨
→Take Profit 2 3372
BUY XAUUSD PRICE 3276 - 3278⚡️
↠↠ Stop Loss 3272
→Take Profit 1 3284
↨
→Take Profit 2 3290

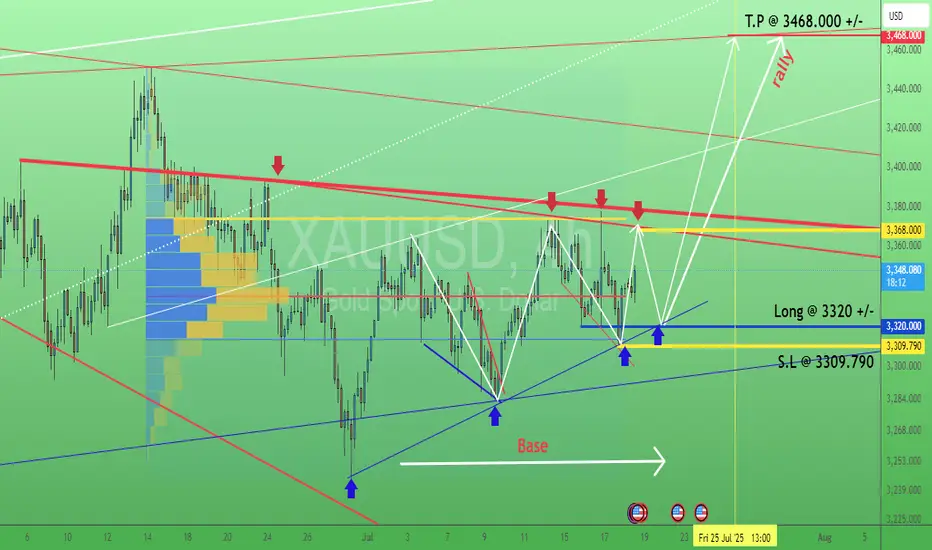
Gold. Swing trading signal. 18/July/25XAUUSD probably still ranging within 3309 - 3368 before breakout to the upside...targeting still around 3460 +/-
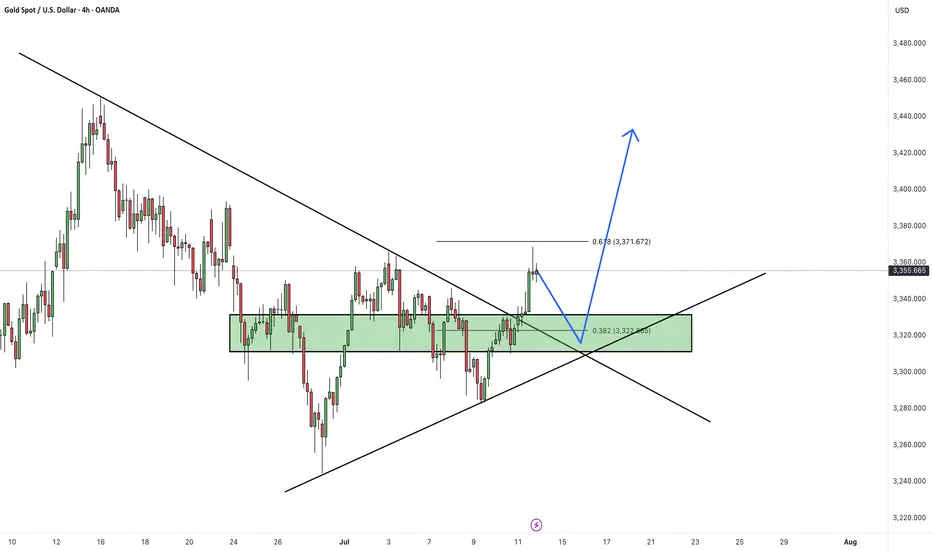
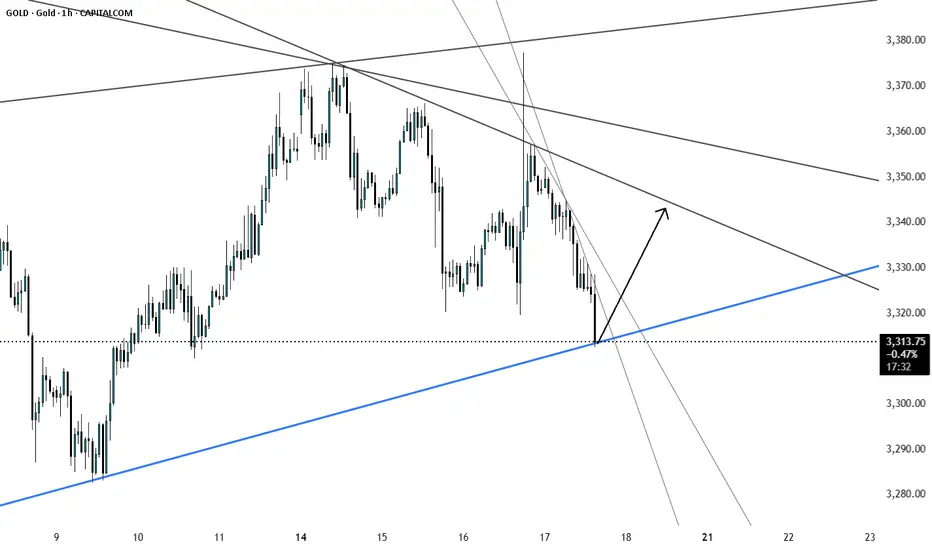
XAUUSDHello Traders! 👋
What are your thoughts on XAUUSD?
Gold has successfully broken above its descending trendline, signaling a potential shift in market structure and growing bullish momentum.
A pullback toward the broken trendline is now likely, as price may retest the breakout zone.
Once the pullback is completed, we anticipate a bullish continuation and a move toward higher levels.
As long as price holds above the identified support zone, the bullish outlook remains valid.
Will gold resume its rally after the pullback? Share your thoughts in the comments! 🤔👇
Don’t forget to like and share your thoughts in the comments! ❤️
XAUUSD: Market analysis and strategy for July 17.Gold technical analysis
Daily chart resistance: 3382, support below 3300
Four-hour chart resistance: 3375, support below 3320
One-hour chart resistance: 3352, support below 3320.
Trump's remarks in the NY market on Wednesday ignited the market. First, it was reported that Powell would be fired, and then it was reported that Trump denied the news. Gold quickly rose to 3375 and then quickly fell back. Under the impact of the news, the price fluctuated very quickly, jumping up and down quickly.
From the current market trend, the day before yesterday, it fell to 3319 and stopped falling and rebounded. Yesterday, it tested 3319 again and quickly pulled up. Yesterday, the price hit the high point of this week near 3375 again and fell back quickly. There is support below and resistance above. If it approaches the 3320 support for the third time today, it is likely to fall below, and then trigger a long stop loss, and it may fall rapidly at that time.
If it falls below 3319, it will look at the 3280~3300 range.
SELL:3319 SL:3324
SELL:3352 SL:3357

Gold Setup. Midas losing his touch.TVC:GOLD has reached an all time high of $3500. It further created a LH @ $3435 in the daily TF. This signals the beginning of a possible down trend of the commodity with the current fundamentals as confluence.
Furthermore, TVC:GOLD is likely to reach level $3160 and possibly test levels as low as $2960, below the much acclaimed $3000 support structure.

XAUUSD: Market Analysis and Strategy for July 18Gold technical analysis
Daily chart resistance: 3382, support: 3310
Four-hour chart resistance: 3375, support: 3332
One-hour chart resistance: 3365, support: 3345.
From a technical perspective, the price of gold has recently formed a wide range of fluctuations in the range of 3310-3365 US dollars, reflecting the unclear market direction. At present, the short-term moving average of gold is supported at 3332, and other periodic indicators are also in a bullish arrangement. The overall decline at the hourly level is limited, and the bulls still have the momentum to rebound.
3310 on the daily chart constitutes a key support. If it falls below, it may fall to the July low of 3287-3282. On the upside, if the resistance level of 3366 US dollars is effectively broken, it may trigger short stop losses and push the gold price back to the 3400 US dollar mark. Pay attention to the resistance of 3366-3377 above and the support of 3345/3332 below
BUY: 3345near
SELL: 3365near

XAUUSD will end July negative.During and post CPI, we saw the price of gold spike up towards 3366 to create a sell order block and quickly reversed to 3310 indicating weakening in bullish momentum. With all the geopolitical tensions easing up, XAUUSD price will respect the technical view. Currently, price seems to be printing a bearish flag pattern. We can expect sharp declines from XAUUSD next week.

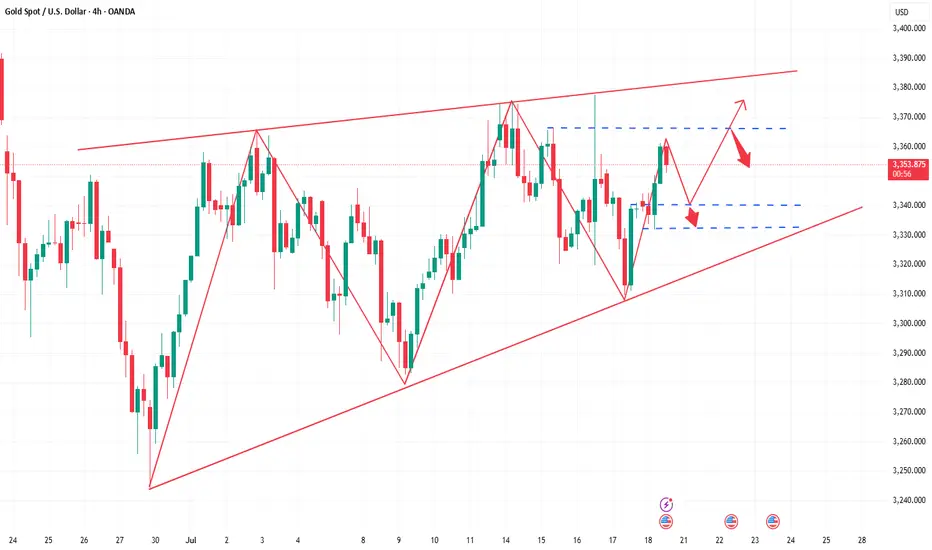
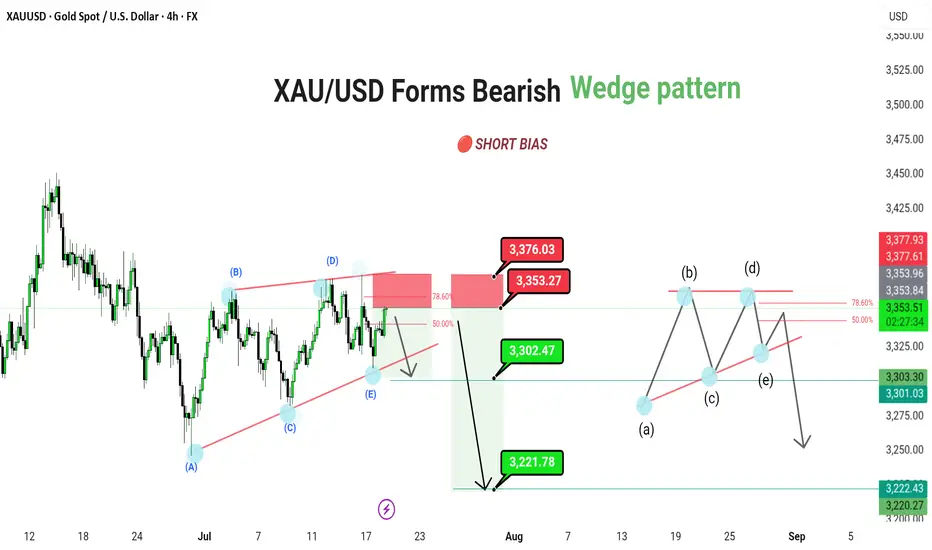
XAU/USD Forms Bearish Continuation Triangle – Future Downside
XAU/USD (4H) | FX | Gold Spot vs US Dollar
🔴 SHORT BIAS
📅 Updated: July 18
---
🔍 Description
Gold is trading within a bearish contracting triangle, suggesting a continuation move to the downside after the recent corrective bounce. Price is currently approaching the key 3,371–3,376 resistance zone, which aligns with the 78.6% Fibonacci retracement and upper triangle boundary.
This resistance confluence could mark the termination of the (E) wave of the triangle, paving the way for a larger downward thrust. A confirmed break below 3,302 would open the door toward 3,221 as the next major target.
The structure also leaves room for a minor internal triangle (a)-(b)-(c)-(d)-(e) pattern within the broader range, reinforcing the bearish setup.
---
📊 Technical Structure (4H)
✅ Bearish contracting triangle: (A)-(B)-(C)-(D)-(E)
✅ 78.6% Fibonacci + supply zone = ideal rejection point
✅ Internal triangle projection aligns with lower support test
📌 Downside Targets
Target 1: 3,302.47
Target 2: 3,221.78
🔻 Invalidation: Above 3,376.03
---
📈 Market Outlook
Macro View: Rising real yields and cooling inflation reduce gold’s appeal
Fed Watch: Hawkish tone supports USD, weighing on XAU
Technical View: Structure favors downside break from triangle formation
---
⚠️ Risks to Bias
Break and daily close above 3,376.03 invalidates triangle structure
Sudden risk-off sentiment or dovish Fed shift could boost gold demand
Sharp reversal in dollar strength
---
🧭 Summary: Bearish Breakout Setup Forming
XAU/USD is completing a bearish triangle structure, with price sitting just below resistance. A rejection from the 3,371–3,376 zone can trigger a breakout lower, first toward 3,302, then extending to 3,221. As always, confirmation and tight risk control are key.
---
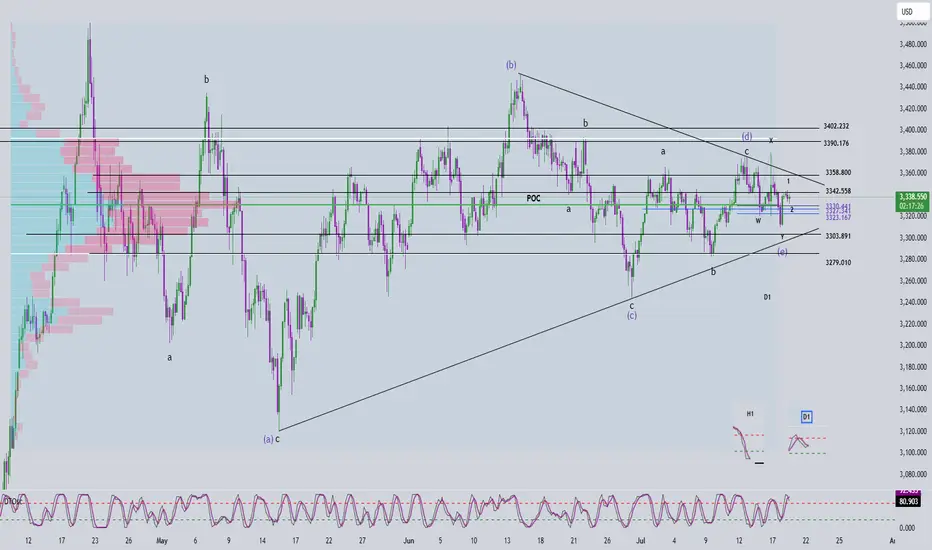
Elliott Wave Analysis – XAUUSD July 18, 2025📈 Elliott Wave Analysis – XAUUSD July 18, 2025
🔍 Momentum Analysis
D1 Timeframe: Momentum is showing signs of a bullish reversal. While we need to wait for today's D1 candle to close for confirmation, it's likely that yesterday’s upward move marks Wave 1, signaling the beginning of a new bullish trend.
H4 Timeframe: Momentum is preparing for a bearish reversal → suggesting a potential corrective pullback, likely forming Wave 2.
H1 Timeframe: Momentum is about to reverse upward → supporting the expectation of a short-term bullish move during the current session.
🌀 Elliott Wave Structure Update
On the H4 chart, the abcde triangle correction structure remains largely unchanged.
However, a strong H4 bullish candle appeared yesterday, indicating unusual market behavior that deserves attention.
There are two main scenarios:
- Wave 1 (black) has already completed, and the market is now entering Wave 2 correction.
- Alternatively, the current movement could be Wave 4 within Wave 1 (black).
🔎 Combining Momentum & Wave Structure
- With D1 momentum signaling a potential uptrend lasting the next 4–5 days, it suggests that Wave e (blue) may have completed.
- This opens the door for an impulsive 5-wave advance. Specifically:
+ If H1 continues its bullish reversal, the current move could be Wave 5 of Wave 1 (black), targeting the 3358 level.
+ Afterwards, a retracement toward the 3330–3323 zone would form Wave 2 (black).
+ Alternatively, price might drop directly to 3330–3323, implying Wave 1 has already finished and the current move is Wave 2.
🎯 => Both scenarios converge at the 3330–3323 price zone, making it a high-probability BUY ZONE.
🧭 Trade Plan
BUY ZONE: 3330 – 3327
Stop Loss: 3320
Take Profits:
TP1: 3342
TP2: 3358
TP3: 3402
📌 Note: Since this is a relatively wide entry zone, it's best to wait for price action confirmation at this level before entering.
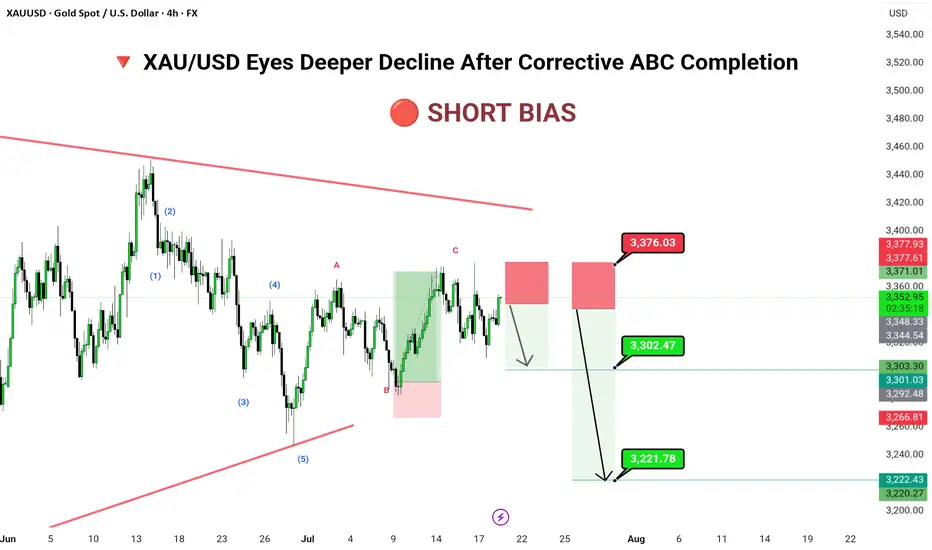
XAU/USD Eyes Deeper Decline After Corrective ABC Completion🔻 📊 Technical Structure (4H)
✅ 5-wave bearish impulse completed
✅ ABC correction likely completed
✅ Supply zone: 3,371–3,376
📌 Downside Targets
First: 3,302.47
Final: 3,221.78
🔻 Invalidation Zone
Above: 3,376.03 (Break above invalidates short scenario)
---
📈 Market Outlook
Macro Context: Gold faces pressure amid rising real yields and stronger dollar flows.
Technical Context: Price trapped within a long-term descending wedge; corrective rally meets resistance.
Risk Appetite: Risk-on tone limits safe-haven demand in short term.
---
⚠️ Risks to Watch
Breakout above 3,376 may trigger bullish breakout
Dovish Fed tone could reverse short-term USD strength
Geopolitical tension reviving gold demand
---
🧭 Summary: Bearish Structure in Play
XAU/USD has completed a textbook ABC retracement and now sits inside a key shorting zone. A rejection here opens space for significant downside toward 3,221. Traders should watch closely for bearish confirmation before committing to positions, with stops tightly placed above 3,376.
Gold Buying back every dip as expectedTechnical analysis: Interesting turn of events regarding the Short-term as Gold crossed the second Resistance (and is Trading #2 points above it currently) on the Hourly 4 chart and crossed aswell #6-session High’s, which may result as an traditional Buying back every dip (as I advice Traders to Buy every local Low’s recently / what I am doing personally), offering no Selling continuation patterns to Trade by. This is an additional Short-term Buying signal similar to cycle of February #2 - #5 #2020 parabolic rise, which ended as an correction. Hourly 4 chart is under much needed consolidation (current dip Buying) near #3,352.80 benchmark and is again leaning on Bullish side rather than Neutral, as Gold is still ignoring strong Overbought levels following mostly losses on DX (taking strong hits), turning as well Oversold in the process as global Geo-politics dust rises, and as long those guide the market sentiment, further uncertainty on Gold is inevitable and Buying underlying trend will persist.
My position: I repeat / keep in mind that Swing Trading is not possible currently on Gold as Scalp / in & out aggressive orders are key to make excellent Profits (I will advise when to continue with Swing orders). I have firstly Bought Gold on #3,324.80 throughout yesterday’s session and closed my set of Buying orders on #3,332.80 Resistance and since I knew news may push Gold down, had Buy limit on one of my possible reversal points of #3,307.80 / #3,310.80 / #3,313.80 which worked nicely. This was one of many brilliant weeks of Scalping the market. Keep in mind that #MA50 on Daily chart plays big role currently and whether Gold establishes it as an Support or Resistance, major trend will continue. I do believe it will be established as an Support and that’s why I maintain my #3,377.80 and #3,400.80 Medium-term Targets. Enjoy the Profits!

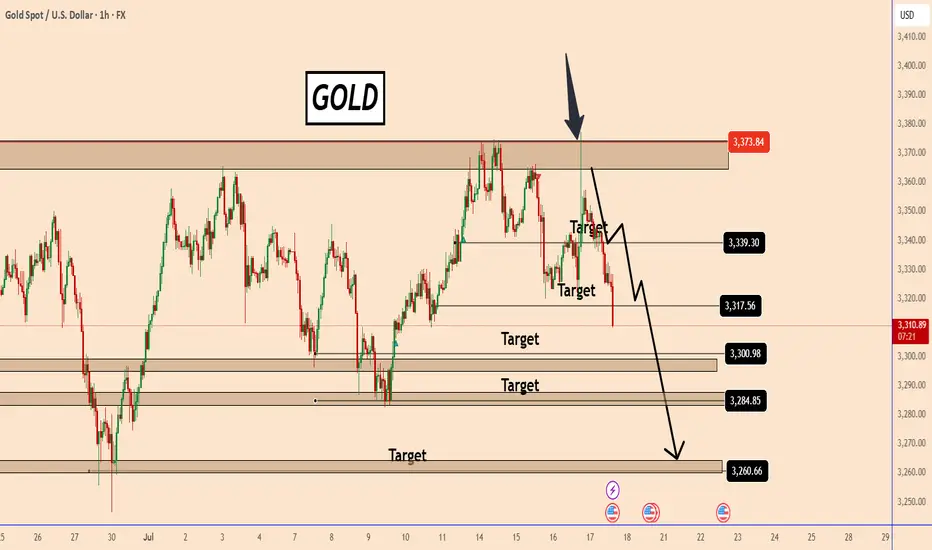
GOLD: Continues to respect our bearish scenarioGOLD: Continues to respect our bearish scenario
Yesterday we had a bad joke from Trump and the price tested again a very strong resistance area located near 3378.
As you can see from the chart, the sell-off happened quickly and was just a sell-off in a deep pullback.
Today, the price was struggling to find a clear direction, but after Trump said he had no plans to fire the Federal Reserve's Powell, the market calmed down easily.
The price fell from another strong support area earlier today after the US printed strong Retail Sales data for June of 0.6% versus an estimate of 0.1%.
The chances of further declines, as I explained earlier, are increasing further and it could even reach 3260, it seems.
You may find more details in the chart!
Thank you and Good Luck!
PS: Please support with a like or comment if you find this analysis useful for your trading day
GOLD at support Gold price has reached the support level from where price has pulled up several time and price will soon may go up. Liq grab. SL3300.
Gold (XAUUSD) at Decision Point – Watch $3,320 Closely! Technical Analysis – 4H Chart
Gold is trading within a rising channel, but momentum is weakening. The current price action is testing the lower channel support around $3,320 — a critical level for the next directional move.
🟥 Bearish Scenario:
Break & close below $3,320 could confirm channel breakdown
Target: $3,219 support zone
Bearish engulfing seen on higher timeframe adds pressure
🟩 Bullish Scenario:
If $3,320 holds as support and price bounces back:
Possible move toward upper channel resistance around $3,401
🌍 Fundamental Outlook
Recent CPI data was soft, but no strong bullish push yet
Focus on upcoming U.S. economic releases (employment, PMI, retail sales)
Strong data = Hawkish Fed = Bearish for Gold
Weak data = Dovish Fed = Bullish for Gold
