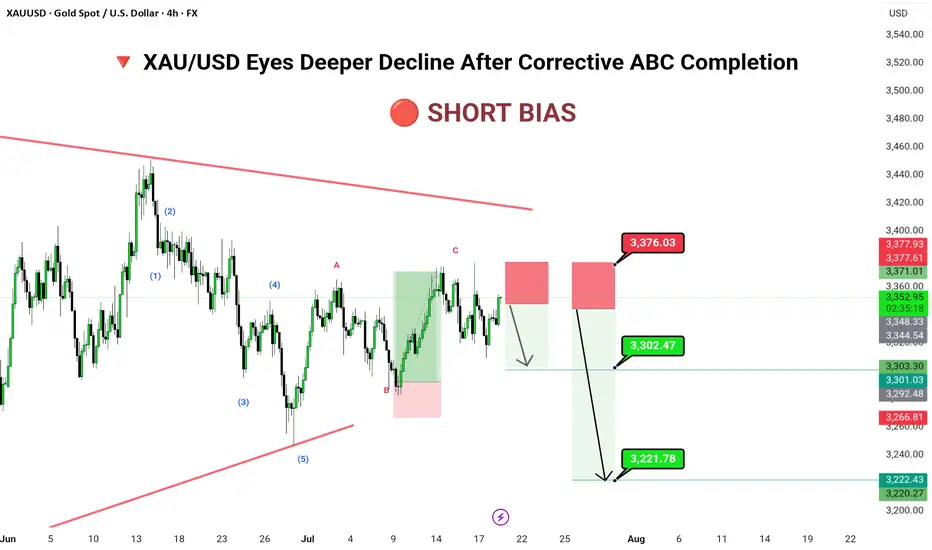
XAU/USD Eyes Deeper Decline After Corrective ABC Completion🔻 📊 Technical Structure (4H)
✅ 5-wave bearish impulse completed
✅ ABC correction likely completed
✅ Supply zone: 3,371–3,376
📌 Downside Targets
First: 3,302.47
Final: 3,221.78
🔻 Invalidation Zone
Above: 3,376.03 (Break above invalidates short scenario)
---
📈 Market Outlook
Macro Context: Gold faces pressure amid rising real yields and stronger dollar flows.
Technical Context: Price trapped within a long-term descending wedge; corrective rally meets resistance.
Risk Appetite: Risk-on tone limits safe-haven demand in short term.
---
⚠️ Risks to Watch
Breakout above 3,376 may trigger bullish breakout
Dovish Fed tone could reverse short-term USD strength
Geopolitical tension reviving gold demand
---
🧭 Summary: Bearish Structure in Play
XAU/USD has completed a textbook ABC retracement and now sits inside a key shorting zone. A rejection here opens space for significant downside toward 3,221. Traders should watch closely for bearish confirmation before committing to positions, with stops tightly placed above 3,376.
XAUUSDK trade ideas
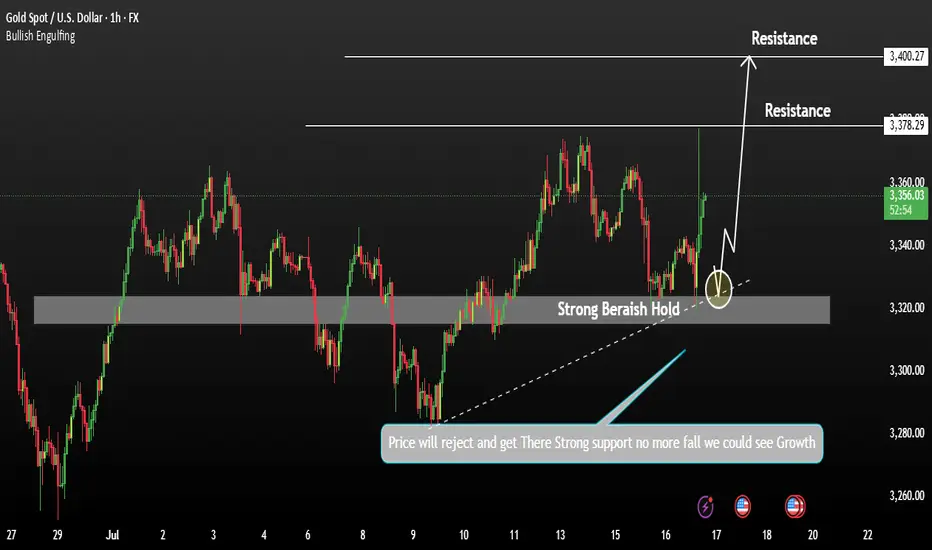
Gold Buying back every dip as expectedTechnical analysis: Interesting turn of events regarding the Short-term as Gold crossed the second Resistance (and is Trading #2 points above it currently) on the Hourly 4 chart and crossed aswell #6-session High’s, which may result as an traditional Buying back every dip (as I advice Traders to Buy every local Low’s recently / what I am doing personally), offering no Selling continuation patterns to Trade by. This is an additional Short-term Buying signal similar to cycle of February #2 - #5 #2020 parabolic rise, which ended as an correction. Hourly 4 chart is under much needed consolidation (current dip Buying) near #3,352.80 benchmark and is again leaning on Bullish side rather than Neutral, as Gold is still ignoring strong Overbought levels following mostly losses on DX (taking strong hits), turning as well Oversold in the process as global Geo-politics dust rises, and as long those guide the market sentiment, further uncertainty on Gold is inevitable and Buying underlying trend will persist.
My position: I repeat / keep in mind that Swing Trading is not possible currently on Gold as Scalp / in & out aggressive orders are key to make excellent Profits (I will advise when to continue with Swing orders). I have firstly Bought Gold on #3,324.80 throughout yesterday’s session and closed my set of Buying orders on #3,332.80 Resistance and since I knew news may push Gold down, had Buy limit on one of my possible reversal points of #3,307.80 / #3,310.80 / #3,313.80 which worked nicely. This was one of many brilliant weeks of Scalping the market. Keep in mind that #MA50 on Daily chart plays big role currently and whether Gold establishes it as an Support or Resistance, major trend will continue. I do believe it will be established as an Support and that’s why I maintain my #3,377.80 and #3,400.80 Medium-term Targets. Enjoy the Profits!

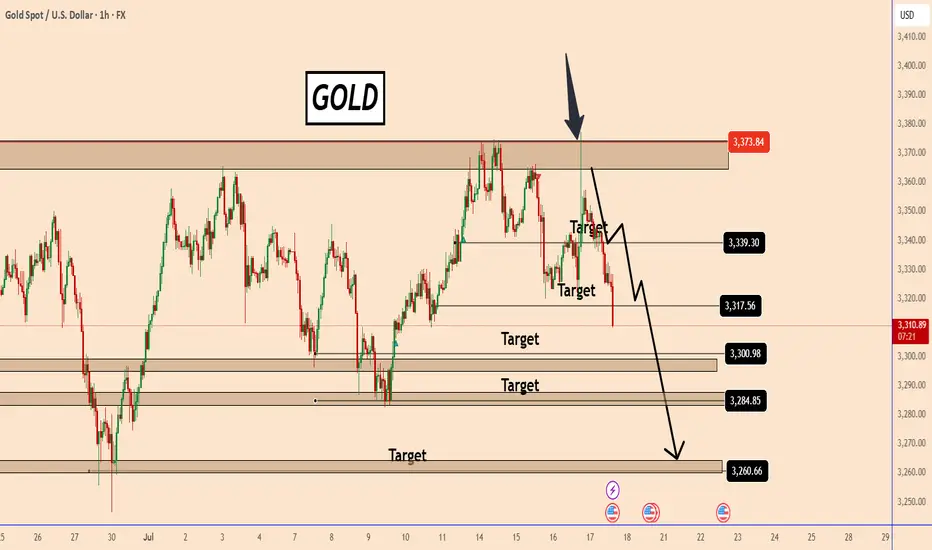
GOLD: Continues to respect our bearish scenarioGOLD: Continues to respect our bearish scenario
Yesterday we had a bad joke from Trump and the price tested again a very strong resistance area located near 3378.
As you can see from the chart, the sell-off happened quickly and was just a sell-off in a deep pullback.
Today, the price was struggling to find a clear direction, but after Trump said he had no plans to fire the Federal Reserve's Powell, the market calmed down easily.
The price fell from another strong support area earlier today after the US printed strong Retail Sales data for June of 0.6% versus an estimate of 0.1%.
The chances of further declines, as I explained earlier, are increasing further and it could even reach 3260, it seems.
You may find more details in the chart!
Thank you and Good Luck!
PS: Please support with a like or comment if you find this analysis useful for your trading day
GOLD at support Gold price has reached the support level from where price has pulled up several time and price will soon may go up. Liq grab. SL3300.
Gold (XAUUSD) at Decision Point – Watch $3,320 Closely! Technical Analysis – 4H Chart
Gold is trading within a rising channel, but momentum is weakening. The current price action is testing the lower channel support around $3,320 — a critical level for the next directional move.
🟥 Bearish Scenario:
Break & close below $3,320 could confirm channel breakdown
Target: $3,219 support zone
Bearish engulfing seen on higher timeframe adds pressure
🟩 Bullish Scenario:
If $3,320 holds as support and price bounces back:
Possible move toward upper channel resistance around $3,401
🌍 Fundamental Outlook
Recent CPI data was soft, but no strong bullish push yet
Focus on upcoming U.S. economic releases (employment, PMI, retail sales)
Strong data = Hawkish Fed = Bearish for Gold
Weak data = Dovish Fed = Bullish for Gold

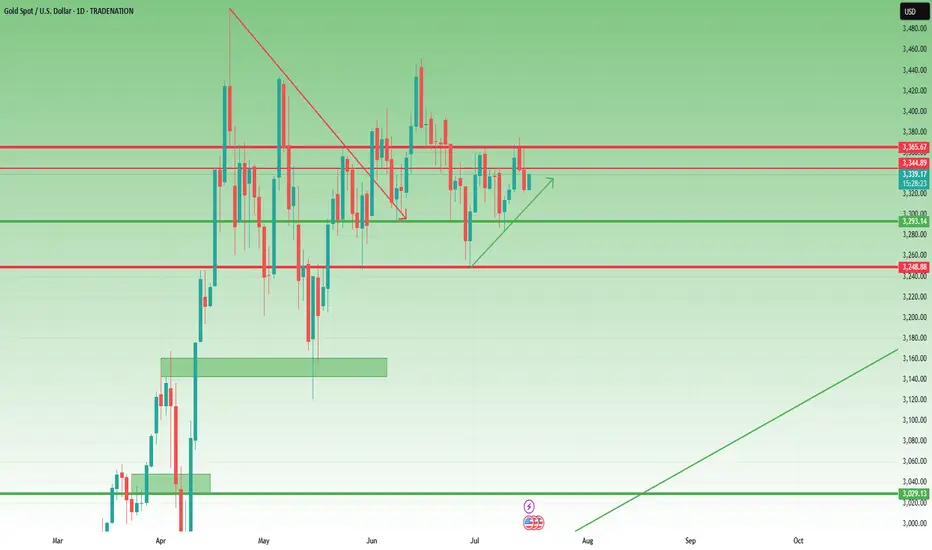
Waiting for the Break: 3375 or 3320 Will Decide the Next 1k Pips📉 Quick recap:
As you know, I've been bullish on Gold. However, as explained in yesterday’s analysis, I started to approach this view with more caution. Unfortunately, I closed my long position at break even… before the rally to the 3375 resistance. That’s trading.
📌 What now?
Despite missing that move, the market is beginning to offer more clarity. There are now two key levels that will likely define the next major swing:
________________________________________
🔹 1. Resistance at 3375 – Top of the Range / Triangle Breakout Zone
• This level marks the upper boundary of the recent range
• It’s also the resistance of a developing ascending triangle
• A clean breakout above 3375 would confirm the pattern and could trigger a strong upside acceleration
• Target: 3450 zone, with potential for more if momentum kicks in (approx. 1000 pips higher)
➡️ This is the obvious bullish scenario – in line with the broader trend and classical technical setup.
________________________________________
🔻 2. Support at 3320 – The Less Obvious, but Classic Gold
• 3320 is now a confluence support area
• Technically, a break below here is less probable – but Gold has a habit of doing the unexpected
• If 3320 breaks, bears could look for a first leg to 3280 (approx. 400 pips), and very probably 3250 (around 700 pips drop)
➡️ This bearish scenario is not the base case, but it must not be ignored. Sometimes the trap is in the obvious.
________________________________________
🧭 Trading Plan:
For now, I’m out of the market, patiently waiting for confirmation. I’ll trade the breakout – whichever side gives the signal first.
________________________________________
📌 Conclusion:
Gold is coiling for a larger move. The levels are clear: 3375 and 3320 are the doors. One of them will open. Until then, we wait and prepare. 🚀
Disclosure: I am part of TradeNation's Influencer program and receive a monthly fee for using their TradingView charts in my analyses and educational articles.

Gold – Bullish Structure Still Intact, but Bears are Knocking📉 What happened yesterday?
As expected, XAUUSD made another leg down, breaking even below my buy zone (3330–3335) and hitting a low at 3320. From there, we’re now seeing a modest rebound, with gold trading around 3333 at the time of writing.
📌 Current position:
I'm currently holding a long position. It hovers around break-even – fluctuating between small gains and small losses. Nothing solid yet.
❓ Key question:
Was this just a deep pullback within a bullish structure… or the beginning of a deeper trend reversal?
🔍 Why bulls still have a case:
• Price prints higher lows – bullish structure technically remains intact
• A clean break above 3350 would show short-term strength
• A confirmed break above 3375 would activate a bullish ascending triangle → targeting the 3450 zone
⚠️ But here's the concern:
• Yesterday’s dip to 3330 happened during the New York session (strong volume)
• The bounce from 3320 has been weak, with no follow-through
• Daily candle closed near the lows, showing a long upper wick → a classic bearish signal
• The confluence support now lies at 3310–3320. A red daily candle closing in this area could mean the medium-term trend is flipping
🎯 My trading plan:
Although I'm still holding my buy, if bulls don’t recover 3350 quickly, I will consider closing early. The break of 3310 would shift my bias bearish.
________________________________________
📌 Conclusion:
We’re in a critical zone. The bullish structure isn’t broken yet, but yesterday’s action was not encouraging. If buyers fail to reclaim control soon, the market may be preparing for a deeper correction. Stay sharp. 🚀
Disclosure: I am part of TradeNation's Influencer program and receive a monthly fee for using their TradingView charts in my analyses and educational articles.
GOLD | Testing Key Support at 3320 — Breakdown or Rebound Ahead?GOLD: Futures Dip as Dollar Strengthens, Eyes on 3320 Support
Gold futures declined as the U.S. dollar gained strength following President Trump’s denial of plans to fire Fed Chair Jerome Powell. While concerns over central bank independence persist, gold remains up over 26% YTD, supported by strong central bank demand and ongoing macro uncertainty.
Technical Outlook:
The price is now approaching the 3320–3312 zone.
A break below 3312 would trigger a bearish move from 3315 toward 3297 and 3281.
However, if the price stabilizes above 3320 on a 4H close, a bullish rebound may follow toward 3333 and 3342.
Key Levels:
Support: 3312, 3297, 3281
Resistance: 3333, 3342, 3363
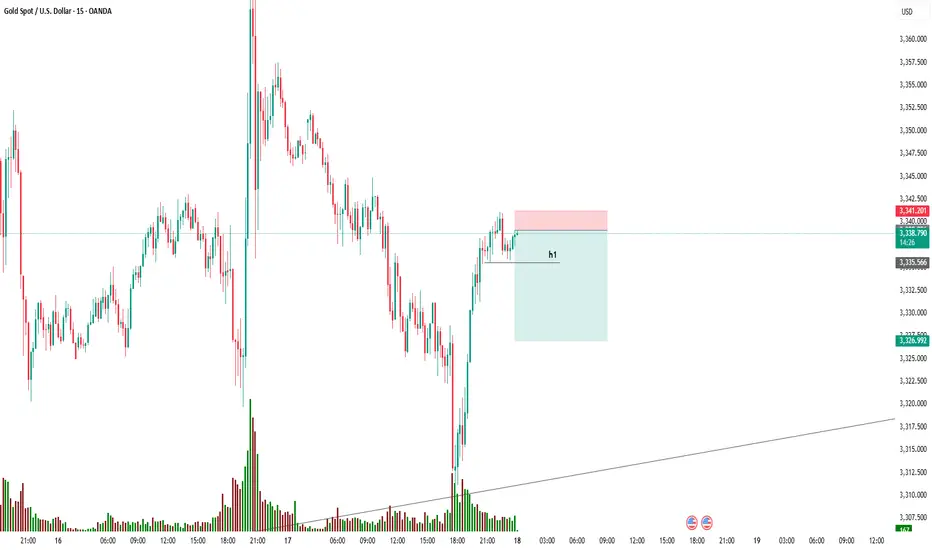
15-minute Gold Spot (XAU/USD) chart,📊 Trade Analysis:
Entry Price: Around $3,338.645
Stop Loss (Red Zone): Slightly above $3,341.201
Take Profit (Green Zone): Around $3,326.992
Risk-to-Reward Ratio: Approximately 1:2.5 (Good)
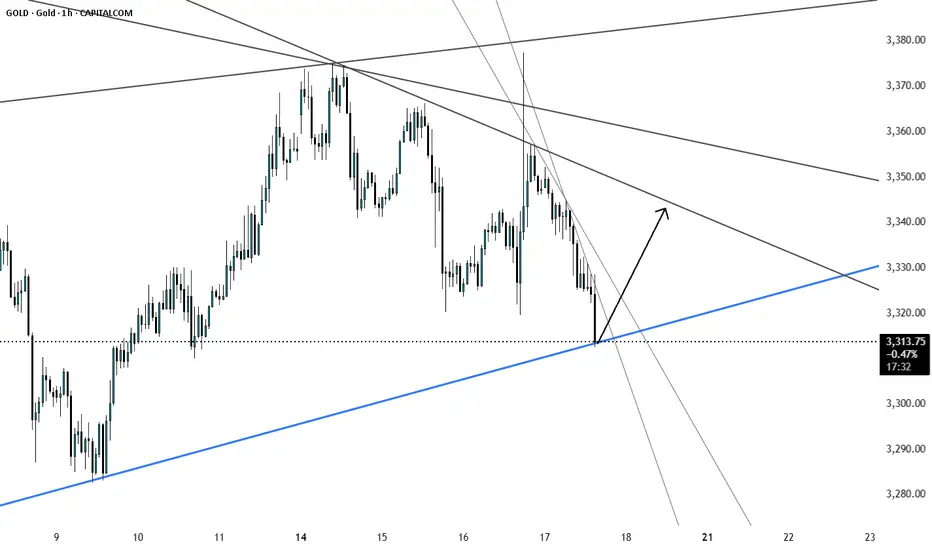
XAUUSDHello Traders! 👋
What are your thoughts on XAUUSD?
Gold has successfully broken above its descending trendline, signaling a potential shift in market structure and growing bullish momentum.
A pullback toward the broken trendline is now likely, as price may retest the breakout zone.
Once the pullback is completed, we anticipate a bullish continuation and a move toward higher levels.
As long as price holds above the identified support zone, the bullish outlook remains valid.
Will gold resume its rally after the pullback? Share your thoughts in the comments! 🤔👇
Don’t forget to like and share your thoughts in the comments! ❤️
GOLD 4H CHART ROUTE MAP UPDATEHey Everyone,
Great start to the week with our chart idea playing out as analysed.
We started the week with our Bullish target 3364 HIT, followed with no ema5 lock confirming the rejection. Bearish target remains open and may complete with the rejection.
We will continue with our plans to buy dips, utilising the support levels from the bearish targets and/or Goldturns. Also keeping in mind our 1h chart, although gave a nice push up , the full Bullish gap remains open.
We will keep the above in mind when taking buys from dips. Our updated levels and weighted levels will allow us to track the movement down and then catch bounces up.
We will continue to buy dips using our support levels taking 20 to 40 pips. As stated before each of our level structures give 20 to 40 pip bounces, which is enough for a nice entry and exit. If you back test the levels we shared every week for the past 24 months, you can see how effectively they were used to trade with or against short/mid term swings and trends.
The swing range give bigger bounces then our weighted levels that's the difference between weighted levels and swing ranges.
BULLISH TARGET
3364 - DONE
EMA5 CROSS AND LOCK ABOVE 3364 WILL OPEN THE FOLLOWING BULLISH TARGETS
3429
EMA5 CROSS AND LOCK ABOVE 3429 WILL OPEN THE FOLLOWING BULLISH TARGET
3499
EMA5 CROSS AND LOCK ABOVE 3499 WILL OPEN THE FOLLOWING BULLISH TARGET
3561
BEARISH TARGETS
3297
EMA5 CROSS AND LOCK BELOW 3297 WILL OPEN THE SWING RANGE
3242
3171
EMA5 CROSS AND LOCK BELOW 3171 WILL OPEN THE SECONDARY SWING RANGE
3089
3001
As always, we will keep you all updated with regular updates throughout the week and how we manage the active ideas and setups. Thank you all for your likes, comments and follows, we really appreciate it!
Mr Gold
GoldViewFX

Gold Pullback in play Aiming Growth for 3400Gold prices initially rejected from recent highs and found strong support, indicating limited downside. Despite the recovery, gold remains under pressure due to rising U.S. bond yields and a stronger U.S. dollar. The higher-than-expected inflation data from the U.S. has reduced the likelihood of an early Fed rate cut, which is weighing on the metal.
Technical Analysis:
If the 1H candle closes above 3350, the price is likely to push back into the bullish zone.
Potential upside targets: 3378 and 3400
You any see more details in the chart.
PS: Support with like and comments for more better insights Thanks for Supporting.
XAUUSD H1 I Bearish Reversal Based on the H1 chart, the price is approaching our sell entry level at 3346.44, a pullback resistance.
Our take profit is set at 3308.43, an overlap support that aligns closely with the 78.6% Fib retracement.
The stop loss is set at 3375.07, a swing high resistance.
High Risk Investment Warning
Trading Forex/CFDs on margin carries a high level of risk and may not be suitable for all investors. Leverage can work against you.
Stratos Markets Limited (tradu.com ):
CFDs are complex instruments and come with a high risk of losing money rapidly due to leverage. 66% of retail investor accounts lose money when trading CFDs with this provider. You should consider whether you understand how CFDs work and whether you can afford to take the high risk of losing your money.
Stratos Europe Ltd (tradu.com ):
CFDs are complex instruments and come with a high risk of losing money rapidly due to leverage. 66% of retail investor accounts lose money when trading CFDs with this provider. You should consider whether you understand how CFDs work and whether you can afford to take the high risk of losing your money.
Stratos Global LLC (tradu.com ):
Losses can exceed deposits.
Please be advised that the information presented on TradingView is provided to Tradu (‘Company’, ‘we’) by a third-party provider (‘TFA Global Pte Ltd’). Please be reminded that you are solely responsible for the trading decisions on your account. There is a very high degree of risk involved in trading. Any information and/or content is intended entirely for research, educational and informational purposes only and does not constitute investment or consultation advice or investment strategy. The information is not tailored to the investment needs of any specific person and therefore does not involve a consideration of any of the investment objectives, financial situation or needs of any viewer that may receive it. Kindly also note that past performance is not a reliable indicator of future results. Actual results may differ materially from those anticipated in forward-looking or past performance statements. We assume no liability as to the accuracy or completeness of any of the information and/or content provided herein and the Company cannot be held responsible for any omission, mistake nor for any loss or damage including without limitation to any loss of profit which may arise from reliance on any information supplied by TFA Global Pte Ltd.
The speaker(s) is neither an employee, agent nor representative of Tradu and is therefore acting independently. The opinions given are their own, constitute general market commentary, and do not constitute the opinion or advice of Tradu or any form of personal or investment advice. Tradu neither endorses nor guarantees offerings of third-party speakers, nor is Tradu responsible for the content, veracity or opinions of third-party speakers, presenters or participants.

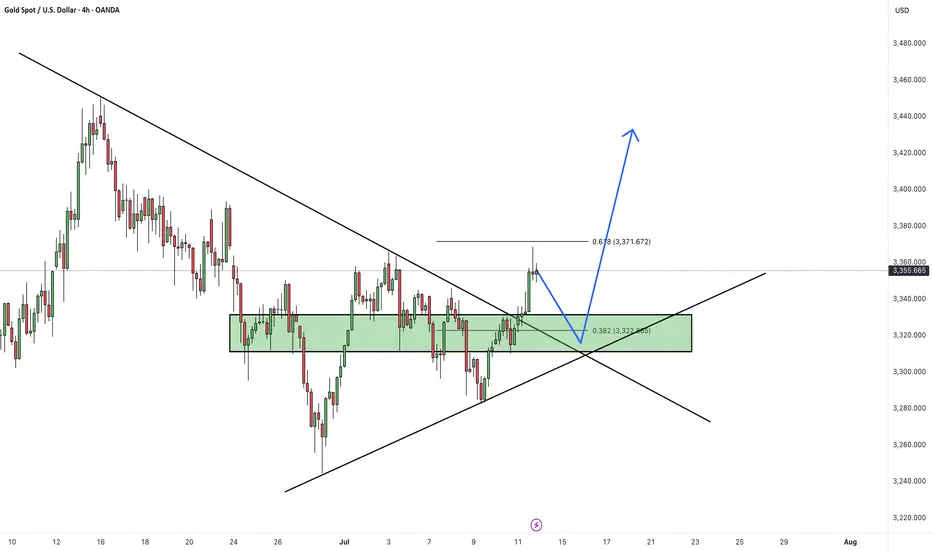
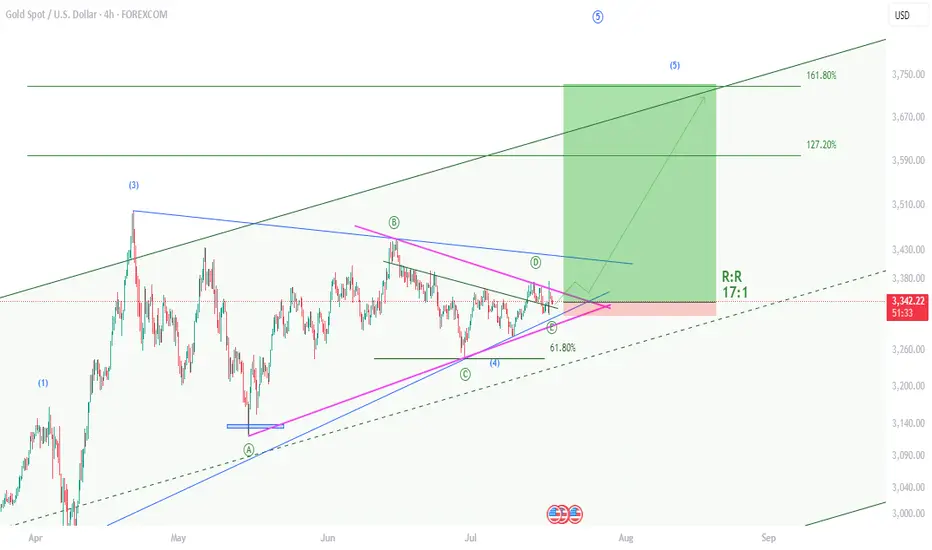
XAUUSD , Bullish Setup , R:R 17Hello friends
I am back after a long time and I want to share the results of my efforts of several years with you.
Gold is starting a 5th wave of bullishness and yesterday it gave us the necessary confirmations by rejecting the previous ceiling. I have identified the best buying position for you now. With a reward to risk 17
Take advantage of this opportunity.
If you are interested in Elliott waves or work in this field at a professional level, contact me and share your analysis with me.
I hope we will all be profitable together.
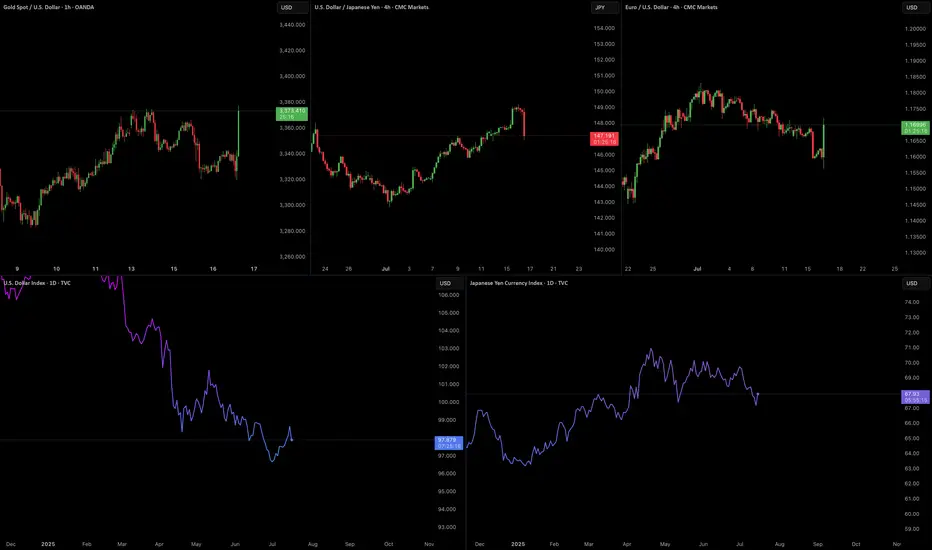
Market Outlook - Trump Questions Powell’s Job - Gold RalliesNordKern active market outlook, reacting to the latest news.
Market Alert | Trump Questions Powell’s Job - Gold Rallies, Dollar Slips
Jul 16 2025 16:56:19 CET: CBS CITING SOURCES:
TRUMP ASKED REPUBLICAN LAWMAKERS IF HE SHOULD FIRE FED'S POWELL
Market Reaction:
OANDA:XAUUSD +$45/oz intraday, currently trading near session highs.
Safe-haven demand and inflation hedge as Fed credibility is questioned.
TVC:DXY Weakens notably against both the TVC:EXY and the TVC:JXY
Markets pricing in higher political risk premium, potential dovish tilt under Trump.
Volatility: Spiking across FX and commodities. VIX and MOVE indexes also showing upward pressure.
Context Matters:
While the Fed Chair cannot be dismissed without cause, even the suggestion of removal injects significant uncertainty into the macro backdrop. Historically, markets react negatively to perceived threats to Fed autonomy (see: Nixon-Burns, Trump-Powell 2018). This development comes just months before the U.S. election, adding a new layer of complexity for macro traders.
What to Watch:
- Fed Speakers: Any defense of Powell or pushback could stabilize markets. Or not.
- Trump Campaign Statements: Will he double down or walk it back?
- Upcoming Data: A dovish-leaning CPI/Jobs print could supercharge gold and further weigh on the dollar.
- Volatility: Traders should adjust position sizing and risk accordingly.
Increased geopolitical and monetary risk are back on the table. Traders should remain nimble, reduce leverage where appropriate, and stay alert to headline risk. Gold and FX are likely to remain reactive into the US session.
NordKern
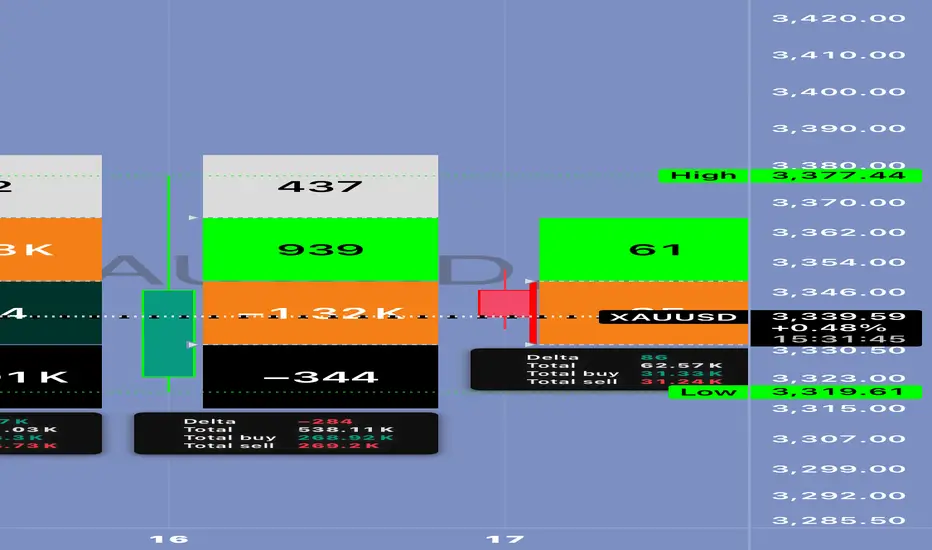
Is Gold Preparing for a Breakout — or a Trap? 🟡 Is Gold Preparing for a Breakout — or a Trap? Let’s break down the latest market data 👇
⸻
🟥 1. U.S. Inflation News (PPI & Core PPI)
Report Previous Forecast Actual
Monthly PPI 0.1% 0.2% 0.0%
Core PPI 0.1% 0.2% 0.0%
📉 Result: Very bearish for the U.S. dollar
→ Inflation is cooling
→ Fed may pause rate hikes
→ Interest rates could stabilize or drop
→ And gold loves that kind of setup 😍
⸻
🟫 2. U.S. Crude Oil Inventory Report
Report Previous Forecast Actual
Crude Oil Inventories +7.07M –1.80M –3.85M
🟢 Result: Very bullish for oil
→ Energy demand is higher than expected
→ Inflation could creep back up due to rising oil prices
→ That makes investors run to gold as a hedge against inflation 🔥
⸻
🧠 Technical & Market Outlook for XAU/USD:
📈 Gold pushed from $3,319 to $3,377
↩️ Now it’s in a pullback, testing Fibonacci levels:
• 38% retracement near $3,350
• 61% retracement near $3,339
📉 But… these pullbacks are happening with positive delta and absorption → which signals smart buying from below 👀
✅ Additional signs:
• VWAP is stable
• Volume is holding around the POC
• And macro data is clearly supporting upside momentum
⸻
🎯 Trading Plan:
• ✅ Entry Zones: $3,350 or $3,339
• 🛑 Stop Loss: Below $3,319 (recent low)
• 🎯 TP1: $3,377
• 🎯 TP2: $3,392 – $3,400
• ⚠️ Watch for a breakout above $3,377 with strong volume — that would confirm the real move.
⸻
🔄 Summary:
💥 Two major news events today are supporting gold:
1. Weak PPI = possible pause in rate hikes
2. Rising oil = renewed inflation risk
So gold is getting support from both angles.
But stay cautious — any surprise statement from the Fed or a sudden USD rally could change the game
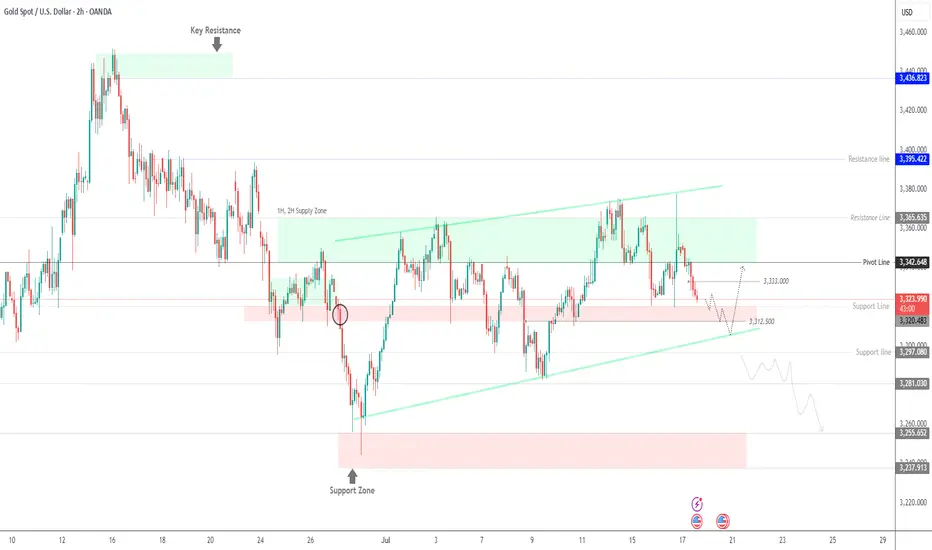
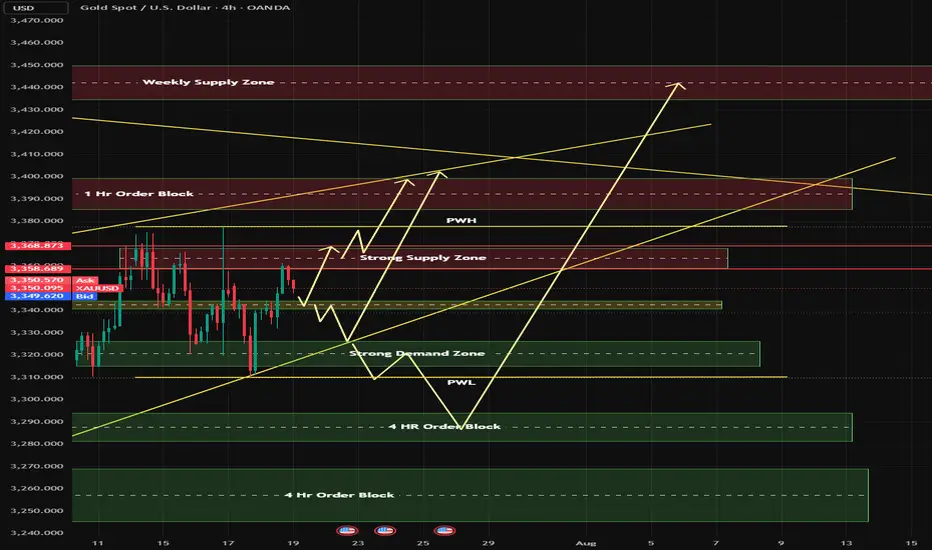
Gold - Week of 21st JulyWelcome to a new trading week. Price is compressing within a premium structure, boxed between clean supply and demand zones. While the overall trend remains bullish, momentum is clearly fading — so structure takes priority this week.
🟨 Weekly Bias: Neutral | Range-Bound Conditions
There’s no clear directional conviction on the weekly timeframe — we’re in a consolidation phase.
📊 Technical Overview & Strategy
We’re currently range-locked between:
Main Supply: 3380–3405
Main Demand: 3275–3250
Until either breaks decisively, we treat this as a two-sided market.
🔹 Weekly Key Zones
🔸 3365–3390 (Primary Supply)
Why it matters: Price was rejected cleanly from a previous weekly high (3377), aligning with a fresh Order Block (OB) and Fair Value Gap (FVG) from June.
Context: No bullish Break of Structure (BOS) above 3375. Repeated wick rejections indicate strong supply.
Game plan: If price returns, monitor M15–H1 for reaction. Consider shorts only if there's no BOS above 3390.
🔸 3430–3450 (Final Supply Barrier)
Why it matters: Unmitigated OB from a macro swing high — the final ceiling before bullish continuation.
Context: A clean BOS through this zone flips the larger structure bullish again.
🔸 3285–3260 (Key Demand Base)
Why it matters: Last untouched bullish OB + FVG combo from early July.
Context: No downside BOS yet. If price pulls back sharply, this zone offers a potential clean long from discount.
🔹 HTF Structure Summary
Trend: Still bullish (no BOS down), but compression under key resistance
Structure Range: 3390–3260
EMA Flow: Bullish, but extended — watch for pullbacks
RSI: Bearish divergence above 3350 — potential retracement brewing
🕯️ Daily Zones
🔸 Supply Zones
3380–3405 – Main Daily Supply / Liquidity Pool
Top of current range. Multiple upper wicks = rejection zone. Unless we get a daily close above 3405, this remains a trap for breakout buyers.
3355–3375 – Internal Supply / Inducement Block
Acted as a consistent ceiling post-CPI. Often triggers fake breakouts and quick reversals — ideal for fading strength.
🟢 Demand Zones
3312–3300 – Mid-Range Internal Demand
Reactive level post-CPI and NY session. Often used for stop hunts and intraday bounces.
3275–3250 – Main Daily Demand
Held firm as support all month. Every dip here has resulted in strong rallies. A daily break below flips the HTF bearish.
⏱ H1 Execution Map
🚩 SELL ZONES
3358–3370 – Primary Intraday Supply
Site of last week’s failed breakout. If price taps this and shows M15/M5 bearish momentum — it’s a sniper entry short.
3380–3395 – Upper Liquidity Trap
Classic fakeout zone. If breakout fails with a sharp reversal, it’s prime territory for “fade and dump” trades.
⚪ DECISION ZONE (Neutral / Pivot)
3335–3345:
A choppy, indecisive area. No clear OB or FVG. Avoid trading here — only observe and wait for clean setups on the edges.
🟢 BUY ZONES
3326–3332 – Primary Intraday Demand
Strong evidence of absorption + sharp reversals. Look for clean M15/M5 snapbacks — a reactive long setup.
3311–3320 – Deep Demand / Fear Zone
Sits below recent lows — ripe for liquidity sweeps. Only consider longs if a strong impulsive bounce follows. High risk, high reward.
Disclaimer: For educational context only.
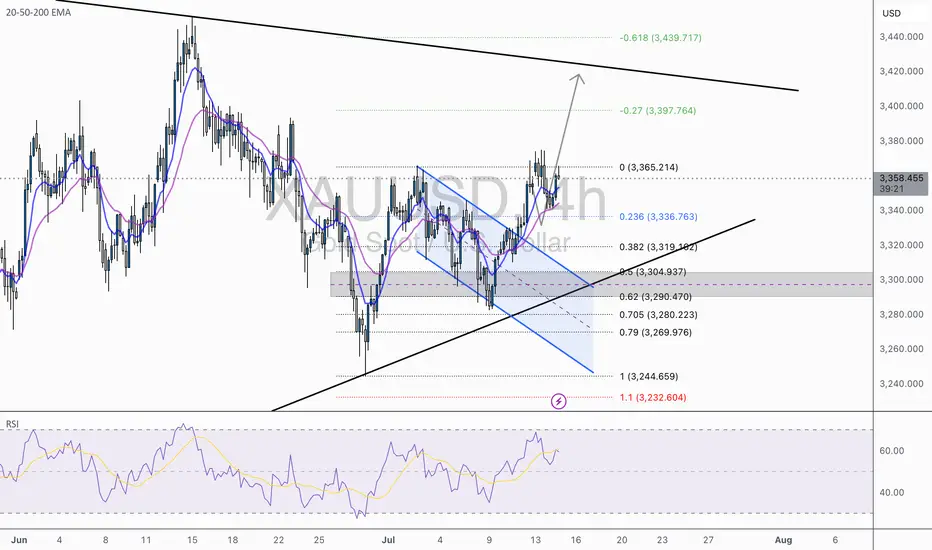
XAU/USD 1H – Bullish Breakout in Play | Eyes on 3,400+XAU/USD has officially broken out of a falling wedge pattern, triggering a classic bullish continuation setup. The rejection off the 0.618–0.705 fib retracement zone ($3,280–$3,290) acted as a powerful launchpad, pushing price above the mid-structure confluence and EMAs.
✅ Key Technical Highlights:
Structure Break: Clear bullish breakout from descending wedge + EMA crossover confirmation (20/50 over 200).
Fibonacci Anchors: Price respected the golden pocket (0.618–0.705), now aiming for full fib extension targets.
Targets:
🎯 TP1: 3,397 (-0.27 fib)
🎯 TP2: 3,440 (-0.618 fib / upper wedge trend-line resistance)
Support Zone: 3,304 – 3,319 (0.5–0.382 fib zone), now acting as fresh demand area.
RSI: Rebounding from 50 with momentum, no divergence, suggesting room for continuation.
🔔 Bullish Scenario:
As long as price holds above the breakout retest zone (≈3,336), momentum favors the bulls with high probability toward 3,400+. Clean higher highs and higher lows confirm trend alignment.
⚠️ Invalidation Level:
Break and close back below 3,304 would shift this from breakout to fakeout — watch for bearish pressure toward 3,280 if that occurs.
📌 Wright Way Outlook:
Momentum is on the side of the bulls. With fundamentals aligned and structure broken, this setup favors precision swing entries with clean RR.
Stay patient, stay tactical. Trade the Wright Way.
GOLD 18.7.2025 FRIDAYHow to see on chart. waiting for clearly breakout of 4h channel then buying gold with SL . I see potencial taking Liquidity of 3390-3400. Enjoy!

GOLD Last move down Next Target after this Breakout?Gold edged higher on Tuesday ahead of key U.S. inflation data, which is expected to provide clearer insight into the Federal Reserve’s future interest rate decisions. Market participants are watching closely for any signals that could influence the dollar and yields, thereby impacting gold prices.
Technical Outlook:
Gold has entered a potential buy zone, showing signs of bullish support Price recently retested the 3353 level, forming a long squeeze setup and now aiming to challenge the resistance at 3373. A successful breakout above 3373 could open the path toward the 3400 and 3432 long-term targets.
On the downside, a retest of the key 3345 level is also possible. This zone between 3345 – 3353 is seen as strong support, and as long as bulls defend it, upward momentum remains likely.
PS: Support with like and comments for more batter insights to share with you.

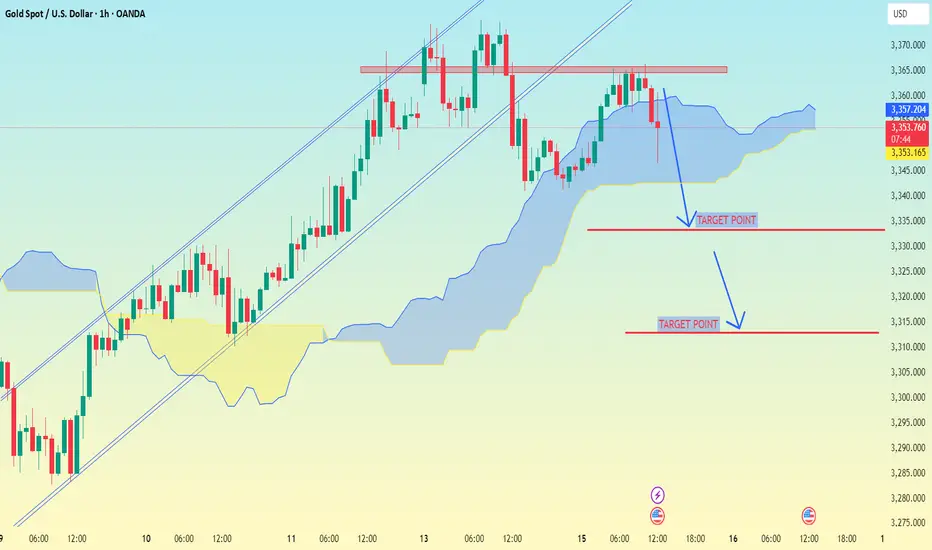
XAU/USD (Gold vs USD) on the 1-hour timeframe..XAU/USD (Gold vs USD) on the 1-hour timeframe, the setup clearly shows a bearish breakdown from an ascending channel, supported by Ichimoku Cloud analysis.
---
📉 Target Points (as marked on your chart):
1. First Target Point: Around $2,335
2. Second Target Point: Around $2,312
---
🔍 Analysis Breakdown:
Price has broken below the Ichimoku cloud – a bearish signal.
The ascending channel is broken to the downside.
Support zones and target levels are clearly marked:
The first target aligns with a previous support level.
The second target is a deeper support area, likely the base of the previous strong rally.
---
📌 Summary:
🥇 First Target: $2,335
🥈 Second Target: $2,312
📉 Bias: Bearish (continuation likely if momentum holds and no strong reversal signs appear)
Let me know if you want suggested stop-loss, entry confirmation ideas, or risk management tips.
GOLD(XAUUSD) 17.07.25A slight push beneath (3232), to be followed by a rally, breaking marked high(above 3499).
Less is More.
Best Regards,
Gideon Stephen (GS)
#xauusd #forex

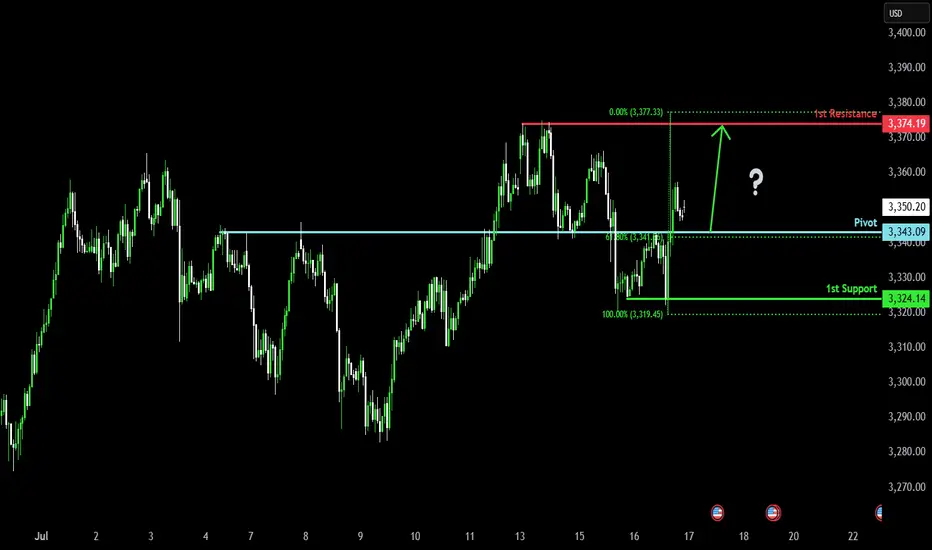
Bullish bounce off overlap support?The Gold (XAU/USD) is falling towards the pivot which has been identified as an overlap support and could bounce to the pullback resistance.
Pivot: 3,343.09
1st Support: 3,324.14
1st Resistance: 3,374.19
Risk Warning:
Trading Forex and CFDs carries a high level of risk to your capital and you should only trade with money you can afford to lose. Trading Forex and CFDs may not be suitable for all investors, so please ensure that you fully understand the risks involved and seek independent advice if necessary.
Disclaimer:
The above opinions given constitute general market commentary, and do not constitute the opinion or advice of IC Markets or any form of personal or investment advice.
Any opinions, news, research, analyses, prices, other information, or links to third-party sites contained on this website are provided on an "as-is" basis, are intended only to be informative, is not an advice nor a recommendation, nor research, or a record of our trading prices, or an offer of, or solicitation for a transaction in any financial instrument and thus should not be treated as such. The information provided does not involve any specific investment objectives, financial situation and needs of any specific person who may receive it. Please be aware, that past performance is not a reliable indicator of future performance and/or results. Past Performance or Forward-looking scenarios based upon the reasonable beliefs of the third-party provider are not a guarantee of future performance. Actual results may differ materially from those anticipated in forward-looking or past performance statements. IC Markets makes no representation or warranty and assumes no liability as to the accuracy or completeness of the information provided, nor any loss arising from any investment based on a recommendation, forecast or any information supplied by any third-party.