XAUUSD SELL 3428On the 4-hour chart, XAUUSD stabilized and rebounded, and short-term bulls took the lead. At present, we can pay attention to the area around 3428, which is a potential short position of the bearish bat pattern, and this position is in the previous supply area.
XAUUSDK trade ideas

Breaking News - Trump vs. PowellJul 16 2025 16:56:19 CET: CBS CITING SOURCES:
TRUMP ASKED REPUBLICAN LAWMAKERS IF HE SHOULD FIRE FED'S POWELL
OANDA:XAUUSD sees upside +35$/oz after Trump has asked the republican lawmakers if he should fire Powell.
TVC:DXY weakens against TVC:EXY and TVC:JXY after Trumps question.
Volatility is increased.

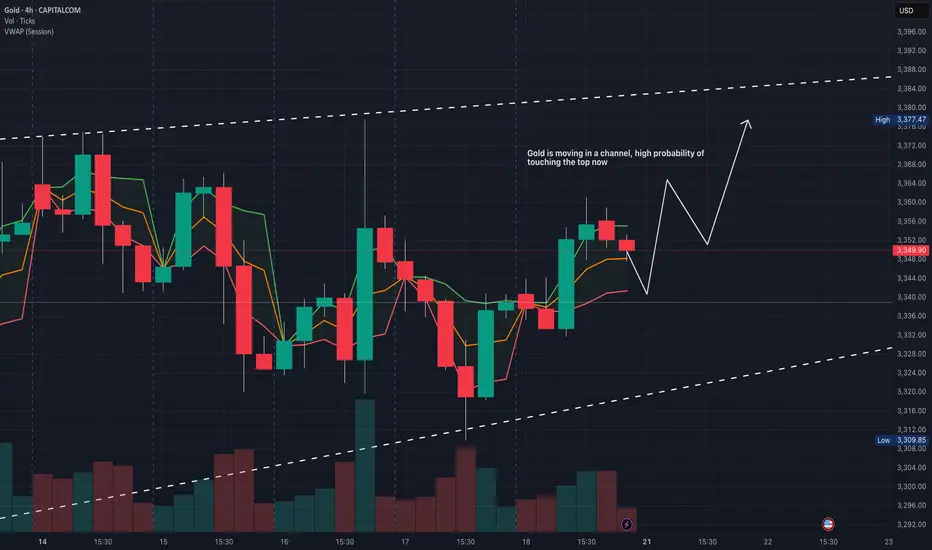
Gold-Bullish Leg to ContinueGold is Bullish. a minor pullback may happen before it continues its leg up. Looking at uncertainty at global level, Gold might push to 3400.
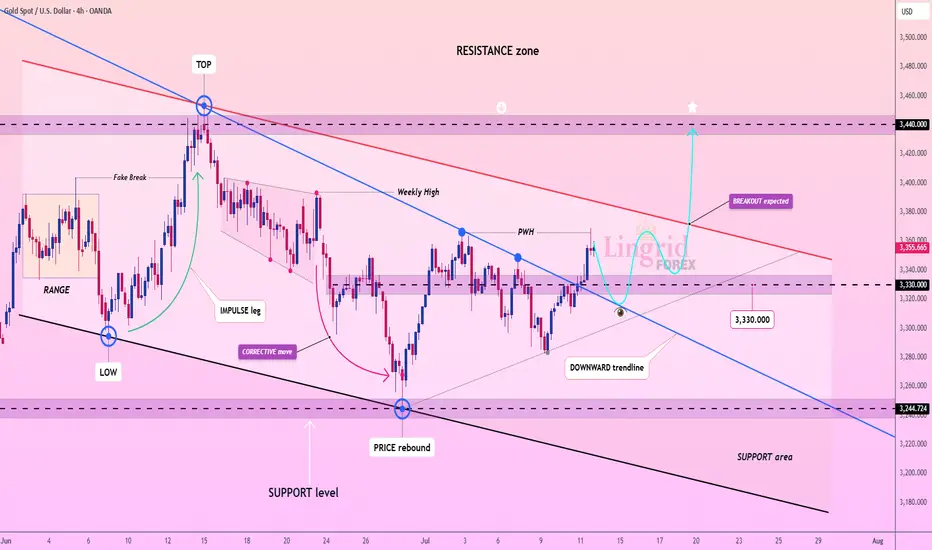
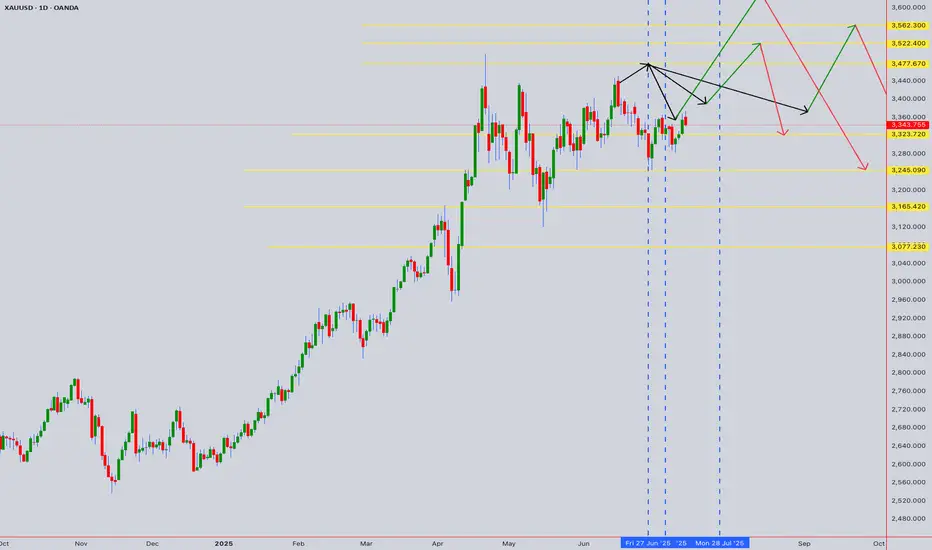
Lingrid | GOLD Weekly Market AnalysisOANDA:XAUUSD markets are navigating through a technical consolidation phase following the recent rally, maintaining underlying bullish momentum despite current volatility. The precious metal is trading between critical levels that will determine the next major directional move.
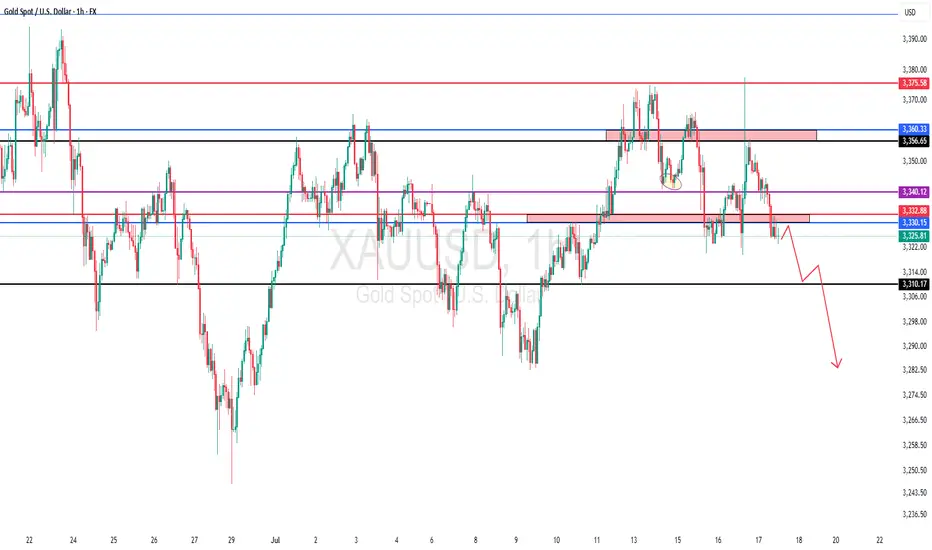
4H chart reveals a complex structure with a retest of the resistance zone around $3,440, gold has initiated a corrective move along the descending channel. The current setup suggests a healthy pullback toward the support zone near $3,330. Breaking above the downward trendline will constitute an important technical signal for bullish continuation.
The higher timeframe provides a broader perspective with an A-B pattern currently forming. Equal tests at resistance levels indicate significant institutional accumulation. The rising trendline (HL) continues to support prices, confirming the long-term bullish structure. The target zone above $3,600 remains viable if gold can successfully break through the current resistance cluster.
Key levels to monitor include the $3,330 support and $3,440 resistance. A decisive break above previous week high could trigger the next leg toward $3,400-$3,450, while failure to hold support might see a deeper correction toward $3,250. The overall technical picture suggests this consolidation represents a continuation pattern within the broader uptrend. If this idea resonates with you or you have your own opinion, traders, hit the comments. I’m excited to read your thoughts!
Expecting Gold bullish Movement Gold (XAU/USD) on the 15-minute chart is showing signs of a bullish reversal after forming a potential double bottom pattern around the 3332 support zoneThis area has been tested multiple times indicating strong buying interest and a solid demand zone
The price action suggests a possible continuation of the bullish momentum, supported by the higher lows and projected upside trajectory. A breakout above the minor consolidation and neckline zone near 3346 could push price toward the identified target zone around 3370 which also aligns with a previous resistance level
Key Levels
Support 3332
Resistance Target Zone 3370
Entry Zone Current pullback near 3345 3346
Bullish Structure: Double bottom with higher low confirmation
If bullish momentum holds this setup offers a favorable risk to reward scenario aiming for a breakout toward the upper resistance zone

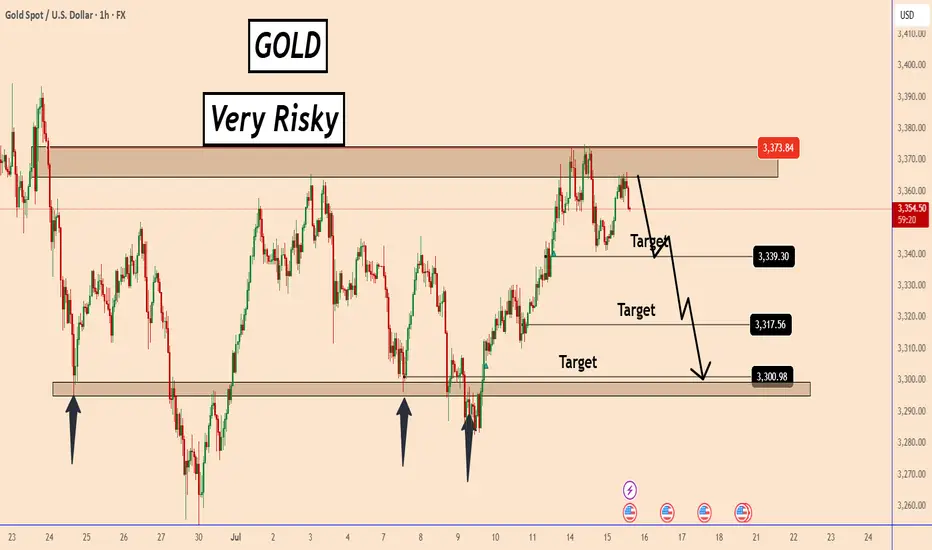
GOLD: A Short-Term Trading Setup - High RiskGOLD: A Short-Term Trading Setup - High Risk
Since July 9, GOLD has been in an uptrend, rising to 3375 as its current high.
The market focus is solely on the Fed’s interest rate cut and when it might happen. Today we have the US CPI data in about 30 minutes. The market expects the CPI to be 2.7% vs. 2.4%.
The market is expecting a bullish data, which increases the odds that the Fed will not cut rates anytime soon and should reduce the odds of an interest rate cut at the July meeting.
From a technical perspective, the price is already facing a strong zone and the chances of a decline are high. However, this trade carries a higher than normal risk, as we can never know how the market may interpret inflation data and its impact on future interest rate cuts.
You may find more details in the chart!
Thank you and Good Luck!
PS: Please support with a like or comment if you find this analysis useful for your trading day
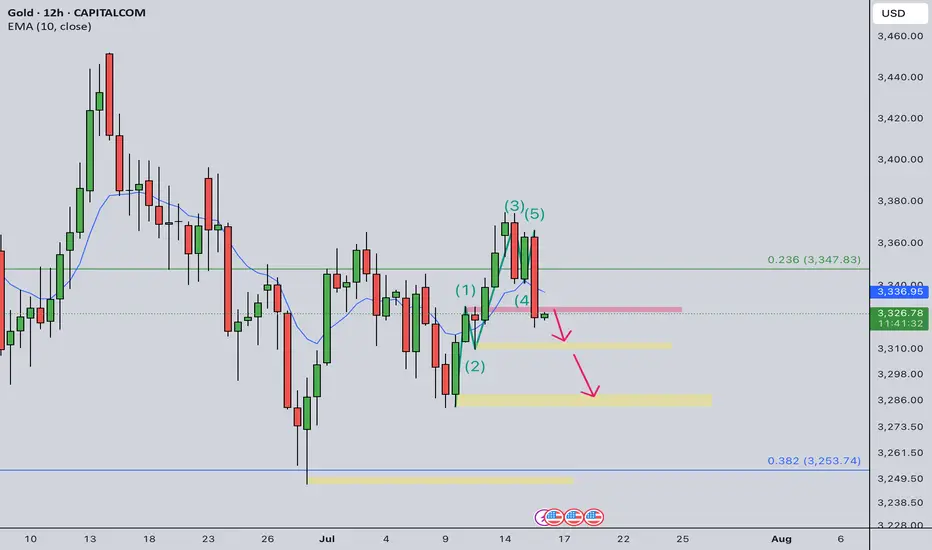
Gold Intraday Trading Plan 7/16/2025As expected yesterday, gold did dropped heavily although not from 3355 but 3365. It broke 3340 support and 3325 support. In 12hrly TF, its wave has just completed and started a new one.
I will sell from 3330 today and initial target is 3310, final target is 3380.
GOLD NEXT MOVE (expecting a bullish move)(15-07-2025)Go through the analysis carefully and do trade accordingly.
Anup 'BIAS for the day (15-07-2025)
Current price- 3358
"if Price stays above 3340, then next target is 3372, 3390 and 3410 and below that 3325 and 3315 ".
-POSSIBILITY-1
Wait (as geopolitical situation are worsening )
-POSSIBILITY-2
Wait (as geopolitical situation are worsening)
Best of luck
Never risk more than 1% of principal to follow any position.
Support us by liking and sharing the post.
GOLD (XAUUSD): Mid-Term Outlook
Analysing a price action on Gold since March,
I see a couple of reliable bullish signals to consider.
As you can see, for the last 4 month, the market is respecting
a rising trend line as a support.
The last 4 Higher Lows are based on that vertical support.
The last test of a trend line triggered a strong bullish reaction.
The price successfully violated a resistance line of a bullish flag pattern,
where the market was correcting for almost a month.
A strong reaction to a trend line and a breakout of a resistance of the flag
provide 2 strong bullish signals.
I think that the market may grow more soon and reach at least 3430 resistance.
An underlined blue area will be a demand zone where buying orders will most likely accumulate.
❤️Please, support my work with like, thank you!❤️

GOLD → Consolidation. Long squeeze before growth to 3400FX:XAUUSD has broken through resistance at 3353-3357 since the session opened, and bulls are currently trying to keep the market in the buying zone. Should we expect a long squeeze before growth?
Gold is in local consolidation after breaking through a key level. The price is still in the consolidation phase formed during a week-and-a-half correction. The price reached a three-week high of $3,374 on Monday but fell after the EU's conciliatory statements. Investors are awaiting US inflation data and Chinese GDP figures as they assess the prospects for a Fed rate cut. Heightened geopolitical and trade tensions are keeping demand for safe-haven assets high.
Technically, gold has entered a local buying zone, but there is a fairly complex resistance zone above it, and consolidation is needed to break through it. Such patterns could include a retest of support and a liquidity grab before growth.
Resistance levels: 3373, 3394
Support levels: 3357, 3353, 3345
There is a possibility of a retest of eql 3353 in a long squeeze format and a return to resistance at 3373 for a breakout. I also do not rule out a retest of the key level of 3345. The global trend is bullish, with the price locally in a fairly wide range, with an emphasis on the support zone of 3345-3355. If the bulls can hold this zone overall, the market will have a good chance of rising to 3400-3450
Best regards, R. Linda!

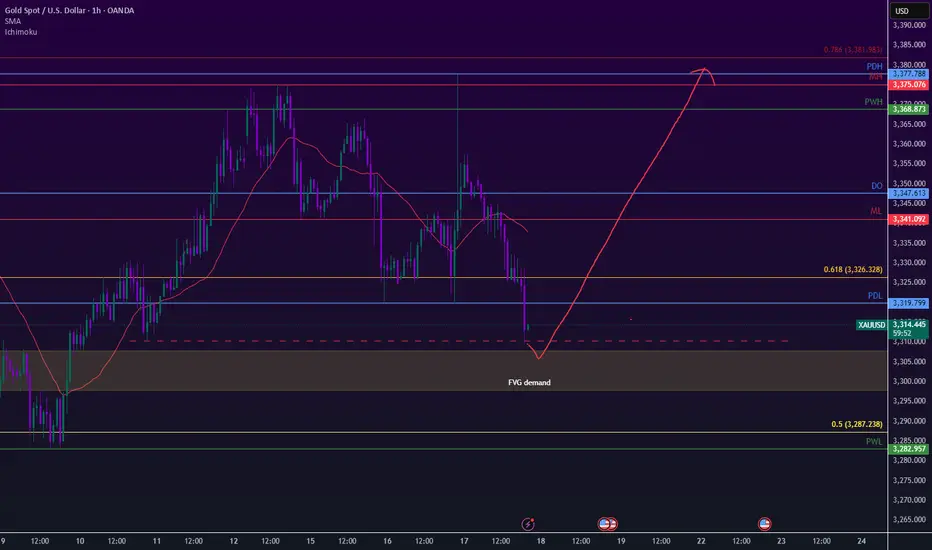
Gold to tap FVG and fly like a rocketGold has shifted long-term momentum recently, we have made a great stride to the upside and currently in a pullback. It should take liquidity here either on the FVG zone or 3310. Targeting all the way at 161% fibs on the previous push at 3440.
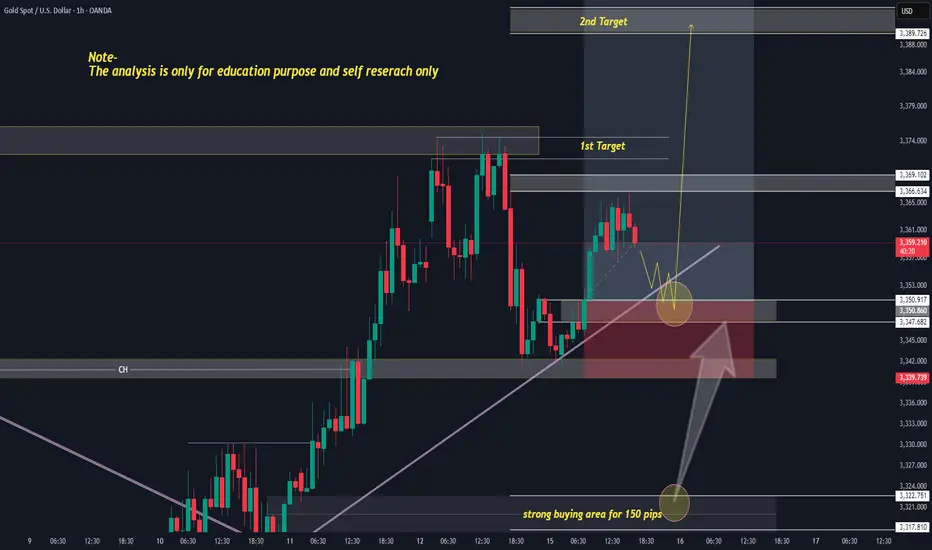
Expecting Gold bullish Movement The chart illustrates a potential bullish reversal setup for Gold XAU/USD on the 15-minute timeframe Price action has recently tested and respected a key demand zone marked as the Kee point around the 32853 level This area acted as strong support with multiple rejections suggesting buyer interest
Following this, the price has started forming higher lows and higher highs indicating the beginning of a bullish structure The large blue arrow suggests bullish momentum is expected to continue, aiming for upside targets
Key Levels
Kee Point Support Zone 3285 Crucial area where the reversal initiated
Target 1: 3316 First resistance level and a potential take-profit zone
Target 2: 3330 Final bullish target if momentum sustains
Outlook
As long as the price holds above the Kee Point, bullish continuation is favored
Breaking and closing above Target 1 could lead to further gains toward Target 2
A break below the Kee Point would invalidate this bullish scenario
This setup presents a potential buying opportunity with defined upside targets contingent on sustained bullish pressure

ELLIOTT WAVE XAUUSD H4 update
EW Trade Set Up H4
monitoring the end of subminuette wave ii
subminuette wave ii is going to end in a double zigzag.
Waiting for an accumulation in the price range 3250/3315 before subminuette iii starts.
daily key levels (area)
3315
3275 POC
3250

THE KOG REPORT THE KOG REPORT:
In last week’s KOG Report we said we would be looking for the price to spike down into potentially the extension level 3310 and then give us the tap and bounce we wanted to be able to capture the long trade in to the 3345-50 region initially. It was those higher resistance levels that we said we would stick with and the bias was bearish below. This move resulted in a decent long trade upside into the region we wanted, and then the decline we witnessed mid-week completing all of our bearish target levels which were shared with everyone.
On top of that, we got the bounce we wanted for the long trade but only back up into the 3335 level which was an Excalibur active target. The rest, we just sat and watched on Friday as unless we were already in the move, the only thing we could have done is get in with the volume, which isn’t a great idea with the limited pull backs.
All in all, a great week in Camelot not only on Gold, but also the other pairs we trade with the DAX swing trade being a point to point swing move executed with precision by the team.
So, what can we expect in the week ahead?
We’ll keep it simple again this week but will say this, there seems we may see a curveball on the way this week. With tariff news over the weekend we may see price open across the markets with gaps, one thing we will say is if you see these gaps, don’t gap chase until you see a clean reversal!
We have the higher level here of 3375-85 resistance and lower support here 3350-45. If support holds on open we may see that push upside into the red box which is the one that needs to be monitored. Failure to breach can result in a correction all the way back down into the 3335 level initially. Again, this lower support level is the key level for this week and needs to be monitored for a breach which should then result in a completed correction of the move.
Our volume indicators are suggesting a higher high can take place here and if we do get a clean reversal we should see this pull back deeply. As usual we will follow the strategy that has been taught and let Excalibur guide the way.
KOG’s bias for the week:
Bullish above 3350 with targets above 3360, 3373, 3375 and 3383 for now
Bearish below 3350 with targets below 3340, 3335, 3329, 3320 and 3310 for now
RED BOX TARGETS:
Break above 3365 for 3372, 3375, 3382, 3390 and 3406 in extension of the move
Break below 3350 for 3340, 3335, 3329, 3322 and 3310 in extension of the move
It’s a HUGE RANGE this week so play caution, wait for the right set ups, don’t treat it like it’s your every day market condition. News from Tuesday so expect Monday to be choppy!
Please do support us by hitting the like button, leaving a comment, and giving us a follow. We’ve been doing this for a long time now providing traders with in-depth free analysis on Gold, so your likes and comments are very much appreciated.
As always, trade safe.
KOG

Gold Price Update: Key Breakout Level in Sight – Watch $3,434! Technical Analysis – XAU/USD
Current Price: $3,371
Gold is trading inside a rising wedge pattern with strong resistance at $3,434.
A daily candle close above $3,434 could trigger a breakout toward:
🎯 Target 1: $3,540
🎯 Target 2: $3,756
If rejected at resistance, price may drop to:
⚠️ Support 1: $3,325
⚠️ Support 2: $3,001 (major weekly support)
🌍 Fundamental Outlook
CPI Data Impact:
Higher CPI → Gold bearish (rate hikes expected)
Lower CPI → Gold bullish (rate cuts or pause likely)
Federal Reserve Policy:
Hawkish = Negative for gold
Dovish = Positive for gold
Other Drivers:
USD Strength
Geopolitical risks
Central bank gold buying

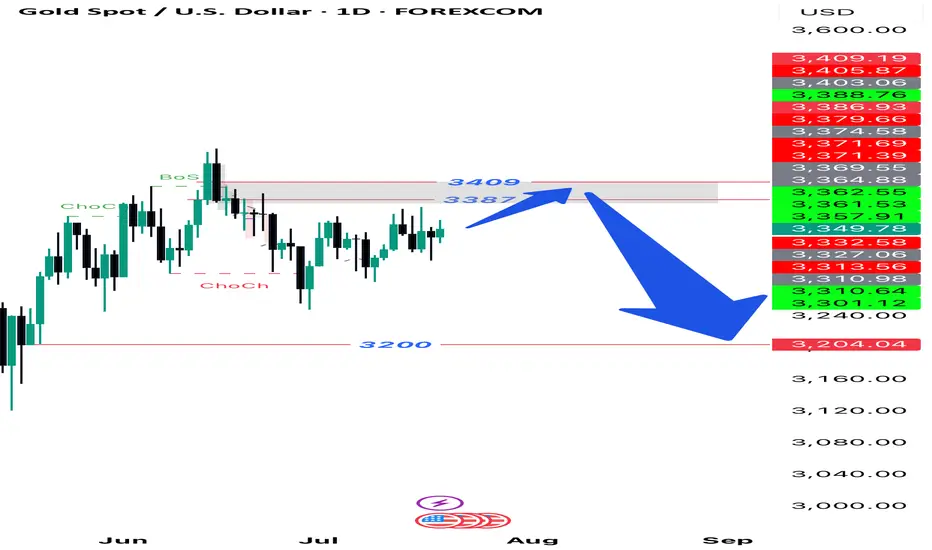
XAUUSD Daily Setup On the daily timeframe, a change in the internal structure has occurred, so the price moves upwards to the range of 3378 to 3409, then moves downwards to the indicated support area.
check the trendIt is expected that a trend change will form within the current support area and we will witness the beginning of the upward trend.
If the price breaks through the support zone, the continuation of the correction is likely.
If the price breaks through the support levels, the continuation of the downtrend is likely.

Gold Roadmap: Next Stop $3,325 After Ascending Channel Break?Gold ( OANDA:XAUUSD ) failed to touch the Potential Reversal Zone(PRZ) in the previous idea , and I took the position at $3,351 = Risk-free.
Gold is moving in the Resistance zone($3,366-$3,394) and has managed to break the lower line of the ascending channel .
In terms of Elliott Wave theory , with the break of the lower line of the ascending channel, it seems that gold has completed the Zigzag correction(ABC/5-3-5) .
I expect Gold to trend downward in the coming hours and succeed in breaking the Support zone($3,350-$3,325) and attacking the Support line again , and probably succeeding in breaking this line this time.
Note: Stop Loss (SL) = $3,396
Gold Analyze (XAUUSD), 1-hour time frame.
Be sure to follow the updated ideas.
Do not forget to put a Stop loss for your positions (For every position you want to open).
Please follow your strategy; this is just my idea, and I will gladly see your ideas in this post.
Please do not forget the ✅ ' like ' ✅ button 🙏😊 & Share it with your friends; thanks, and Trade safe.

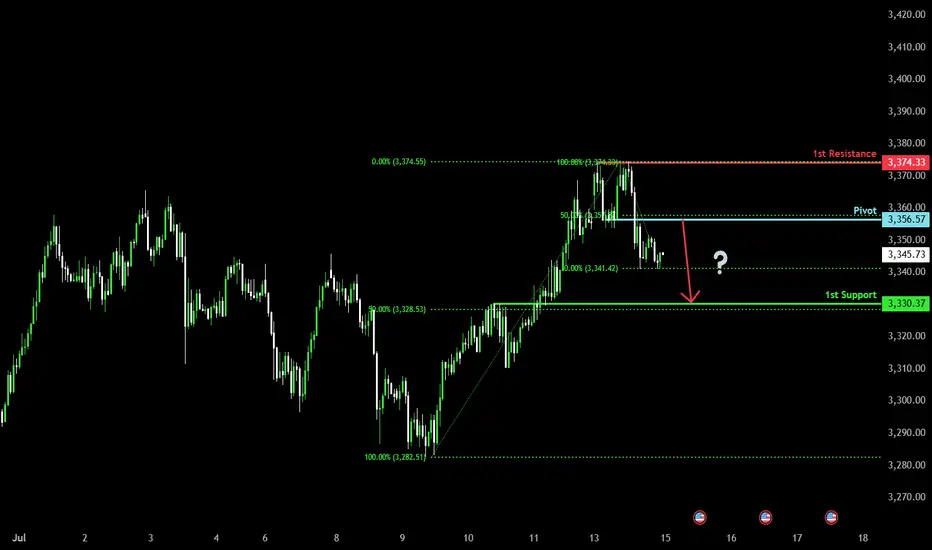
Beaish drop?The Gold (XAU/USD) is rising towards the pivot which aligns with the 50% Fibonacci retracement and could reverse to the 1st support.
Pivot: 3,356.57
1st Support: 3,330.37
1st Resistance: 3,374.33
Risk Warning:
Trading Forex and CFDs carries a high level of risk to your capital and you should only trade with money you can afford to lose. Trading Forex and CFDs may not be suitable for all investors, so please ensure that you fully understand the risks involved and seek independent advice if necessary.
Disclaimer:
The above opinions given constitute general market commentary, and do not constitute the opinion or advice of IC Markets or any form of personal or investment advice.
Any opinions, news, research, analyses, prices, other information, or links to third-party sites contained on this website are provided on an "as-is" basis, are intended only to be informative, is not an advice nor a recommendation, nor research, or a record of our trading prices, or an offer of, or solicitation for a transaction in any financial instrument and thus should not be treated as such. The information provided does not involve any specific investment objectives, financial situation and needs of any specific person who may receive it. Please be aware, that past performance is not a reliable indicator of future performance and/or results. Past Performance or Forward-looking scenarios based upon the reasonable beliefs of the third-party provider are not a guarantee of future performance. Actual results may differ materially from those anticipated in forward-looking or past performance statements. IC Markets makes no representation or warranty and assumes no liability as to the accuracy or completeness of the information provided, nor any loss arising from any investment based on a recommendation, forecast or any information supplied by any third-party.
XAUUSD 1440M forecast Based on the latest available information for July 15, 2025, the overall sentiment for XAUUSD (Gold) in the next 24 hours leans towards a bullish outlook, though with potential for short-term fluctuations and pullbacks.
Key Drivers for Bullish Outlook:
Escalating Trade Tensions: US President Donald Trump's ongoing tariff and trade policies are a significant factor. New tariffs and threats against various countries (EU, Mexico, Japan, South Korea, Brazil, Canada) are creating global economic uncertainty, which typically boosts gold's appeal as a safe-haven asset.
Geopolitical Uncertainty: Broader geopolitical risks, including those related to Russia and Ukraine, also contribute to safe-haven demand for gold.
Inflation Concerns: Tariffs are linked to inflation concerns. Gold performs strongly in a high-inflation environment, and market expectations are shifting towards a more gradual easing of interest rates by the Fed, allowing for inflation to be a potential driver.
Central Bank Demand: Central banks globally, particularly the US and China, continue to be strong buyers of gold, indicating a sustained structural trend of higher gold purchases.
Technical Support: Several analyses point to gold finding support at key levels (e.g., around $3340-3345, 200 EMA), suggesting potential for bounces and continuation of an upward trend.
"Buy on Dip" Strategy: Many analysts are recommending a "buy on dip" strategy, indicating an underlying bullish bias and viewing any short-term declines as buying opportunities.
Factors to Watch (Potential for Pullbacks/Volatility):
Short-Term Weakness/Consolidation: Some technical indicators suggest short-term weakness or consolidation, with gold testing resistance levels (e.g., $3375-3380, $3400).
US Dollar Strength: While trade tensions can weaken the dollar, there are mixed signals. A stronger US dollar can put downward pressure on gold prices as it makes gold more expensive for holders of other currencies.
Inflation Data and Fed Signals: Investors are closely watching US inflation data (CPI) and signals from Federal Reserve officials regarding interest rate cuts. While some expect cuts later in the year, any hawkish surprises could temper gold's rise.
Trade Deal Hopes: Any signs of de-escalation in trade tensions or progress towards agreements could temporarily reduce safe-haven demand for gold.
Specific Price Levels Mentioned:
Resistance: $3375-3380, $3400, $3432, $3450-3470, $3500 (all-time high).
Support: $3340-3345, $3325-3330, $3289-3303, $3240-3246.
In summary, the prevailing sentiment for XAUUSD over the next 24 hours appears to be bullish, driven by ongoing global trade tensions and safe-haven demand. However, be prepared for potential short-term pullbacks or consolidation as the market digests new information and tests key resistance levels.
For those interested in further developing their trading skills based on these types of analyses, consider exploring the mentoring program offered by Shunya Trade.
I welcome your feedback on this analysis, as it will inform and enhance my future work.
Regards,
Shunya Trade
⚠️ Disclaimer: This post is educational content and does not constitute investment advice, financial advice, or trading recommendations. The views expressed here are based on technical analysis and are shared solely for informational purposes. The stock market is subject to risks, including capital loss, and readers should exercise due diligence before investing. We do not take responsibility for decisions made based on this content. Consult a certified financial advisor for personalized guidance.
GOLD - Its Breakout? Short now??#GOLD.. perfect move as per our analysis, and now market just break hit current supporting area that was actually 3328
so keep close it and if market stay below that then we can expect a further drop towards our next supporting areas.
good luck
trade wisely
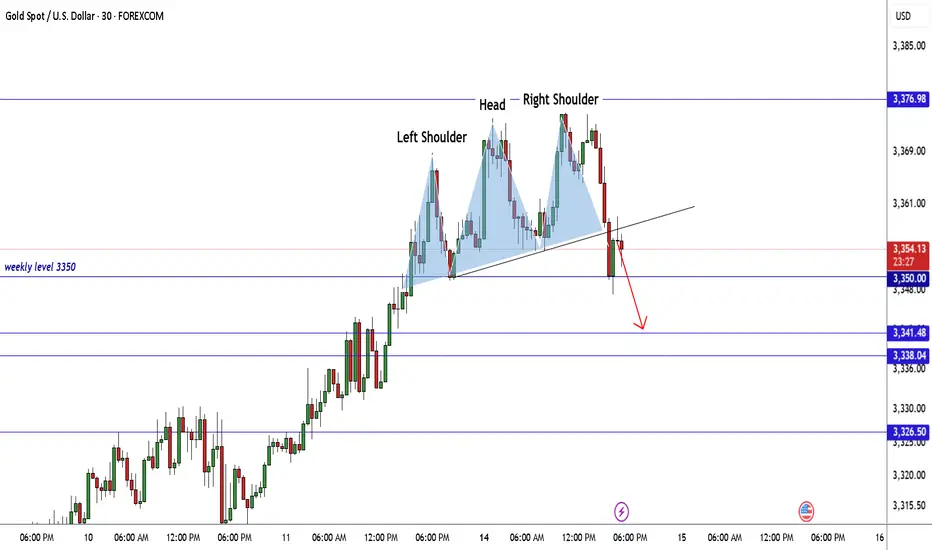
GOLD Made H&S Reversal Pattern , Scalping Short Setup Valid !Here is my GOLD 30 Mins Chart and if we checked the chart we will see that the price created a very good reversal pattern on 30 mins T.F , Head & shoulders reversal pattern and also it`s already confirmed by closure below neckline so the short is very clear now and we can targeting 100 to 150 pips , 3350.00 is a very good support also so we can see a price bounce from it to upside .
sideways in weekend downtrend⭐️GOLDEN INFORMATION:
Gold prices (XAU/USD) struggle to extend Thursday’s recovery from the $3,309 region—a one-week low—consolidating within a tight range during Friday’s Asian session. The US Dollar (USD) continues to retreat from its peak since June 23, pressured by dovish signals from Federal Reserve (Fed) Governor Christopher Waller.
Additionally, growing concerns over US President Donald Trump’s unpredictable trade policies and their potential consequences for global growth are keeping investors cautious, supporting demand for the safe-haven metal. These factors collectively help limit deeper losses in Gold, though the metal lacks clear bullish momentum for now.
⭐️Personal comments NOVA:
Gold price is moving sideways, accumulating in the downtrend line, not much fluctuation in weekend news
⭐️SET UP GOLD PRICE:
🔥SELL GOLD zone: 3381- 3379 SL 3386
TP1: $3370
TP2: $3360
TP3: $3350
🔥BUY GOLD zone: $3293-$3295 SL $3288
TP1: $3308
TP2: $3318
TP3: $3330
⭐️Technical analysis:
Based on technical indicators EMA 34, EMA89 and support resistance areas to set up a reasonable SELL order.
⭐️NOTE:
Note: Nova wishes traders to manage their capital well
- take the number of lots that match your capital
- Takeprofit equal to 4-6% of capital account
- Stoplose equal to 2-3% of capital account
