XAUUSDK trade ideas

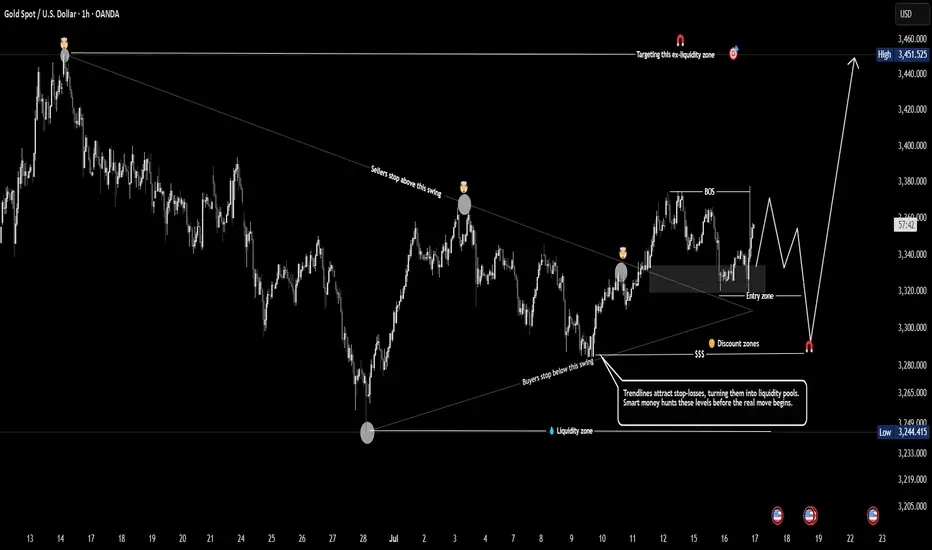
Liquidity Sweep & Discount Entry Zone - Gold Swing Play Gold is targeting an external liquidity zone around 3,450 after breaking structure and forming a bullish setup. Price is expected to dip into the discount zone near 3,300 to collect liquidity from trendline stops before a strong move upward. Smart money is likely hunting below prior lows before initiating the next bullish leg.
XAUUSD NEW OUTLOOKXauusd buy from 3352
tp1 3360
tp2 3370
tp3 3380
Stope lose 3342
TRADE AT YOUR OWN RISK

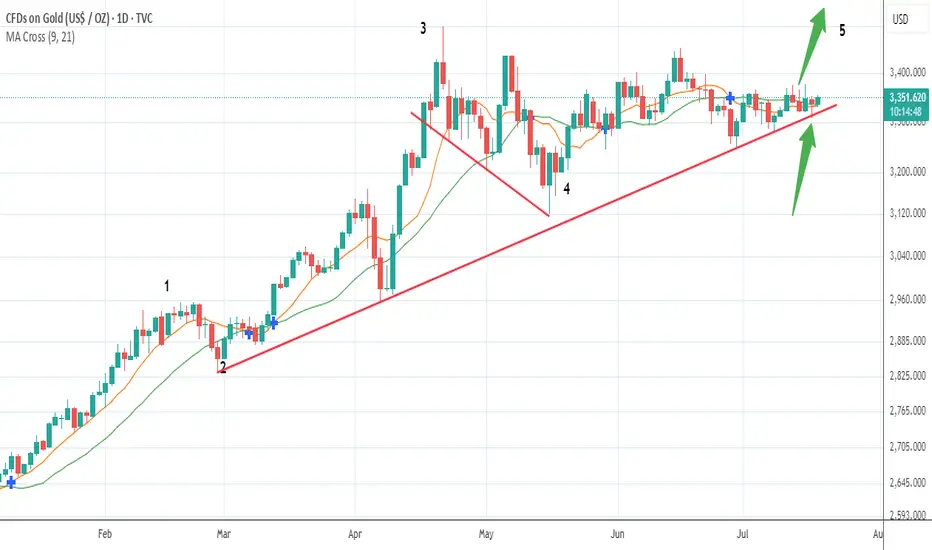
Bet The Farm!Gold's consolidation period in a wave 4 sideways pattern is about to conclude.
Anybody short this asset is about to get burned, a more than 90% probability of an upward surge is imminent.
There are multiple support touch points on this upward trend line...does it get any clearer?
Appreciate a thumbs up...God Bless you all!
Gold market directional biasGold currently in a balance sentiment. Now it continues buy rally. In cot report there is still chance of buy rally. but in the upper side there should be a strong sell zone. we have to prepare for this also.

best location for buy mid term goldthis my analysis combine price action SMC and Astrologi Financial...i see good moment for buy gold.


Gold: Bull-Bear Swings & Today's Trade Tips + AnalysisAnalysis of Gold News Drivers:
During the U.S. session on Wednesday (July 16th), spot gold surged sharply and is currently trading around 3,370 🚀. Trump stated that tariff letters will soon be sent to small countries, with rates likely slightly above 10%, providing safe-haven support for gold prices 🛡️.
Gold prices fell 0.5% on Tuesday, closing at 3,324.68, barely holding above the 55-day moving average of 3,222 📉. Earlier, the U.S. June CPI increase hit its highest level since January, pushing the U.S. dollar index to a nearly three-week high, while U.S. Treasury yields also climbed to a six-week peak, pressuring gold prices ⚖️. The dollar index has risen for four consecutive trading days, hitting a high of 98.70 on Tuesday, the highest since June 23rd 🆙. A stronger dollar makes dollar-denominated gold more expensive for investors holding other currencies, thereby weighing on gold prices 💸.
However, the market largely interprets the dollar's recent rally as a technical adjustment rather than a reversal of the long-term trend 🔄. Despite short-term pullbacks in gold prices, market sentiment has not fully turned pessimistic 😐. While gold is currently in a consolidation range since mid-May, uncertainties surrounding tariff policies may offer support 🔀. Overall, the long-term outlook for gold remains optimistic, with sustained market focus on tariff issues expected to drive a rebound in gold prices in the future 📈
Accurate signals are updated every day 📈 If you encounter any problems during trading, these signals can serve as your reliable guide 🧭 Feel free to refer to them! I sincerely hope they'll be of great help to you 🌟 👇
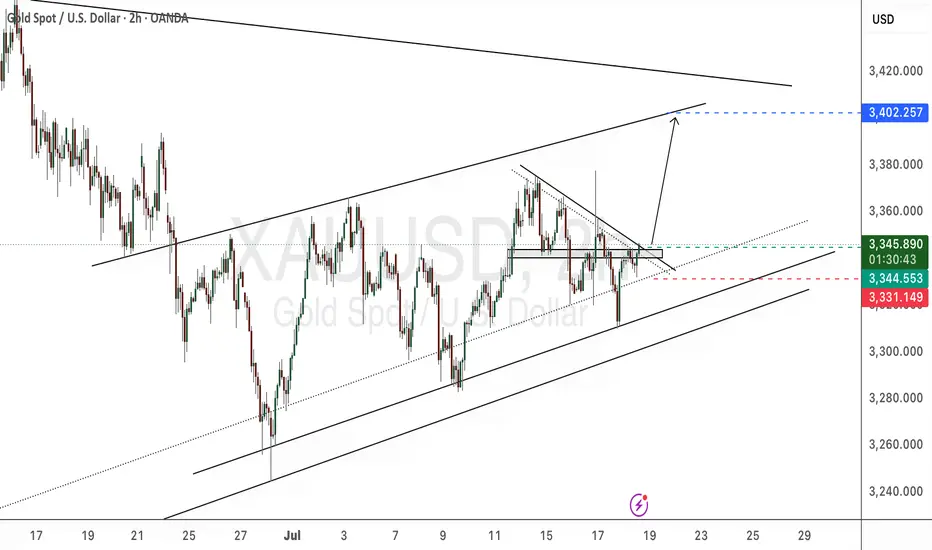
XAUUSD – Summer Triangle ConsolidationGold (XAUUSD) is unfolding a textbook contracting triangle on the 4H chart, currently developing leg D of the pattern. This structure has been forming over the past few months and reflects classic market behavior during the summer — slow, sideways consolidation as many participants are away for the season.
Given the current structure, I expect one more leg down to form wave E, completing the triangle. Once this leg is in place and the support trendline holds, we could see a significant breakout to the upside in line with the broader bullish outlook on higher timeframes.
This setup remains valid as long as price continues respecting the triangle boundaries. I’m watching for a clean rejection at the lower trendline near point E to validate the bullish breakout scenario.
📌 Seasonality, structure, and market tempo suggest patience as the consolidation plays out. The breakout opportunity may follow shortly after leg E concludes.

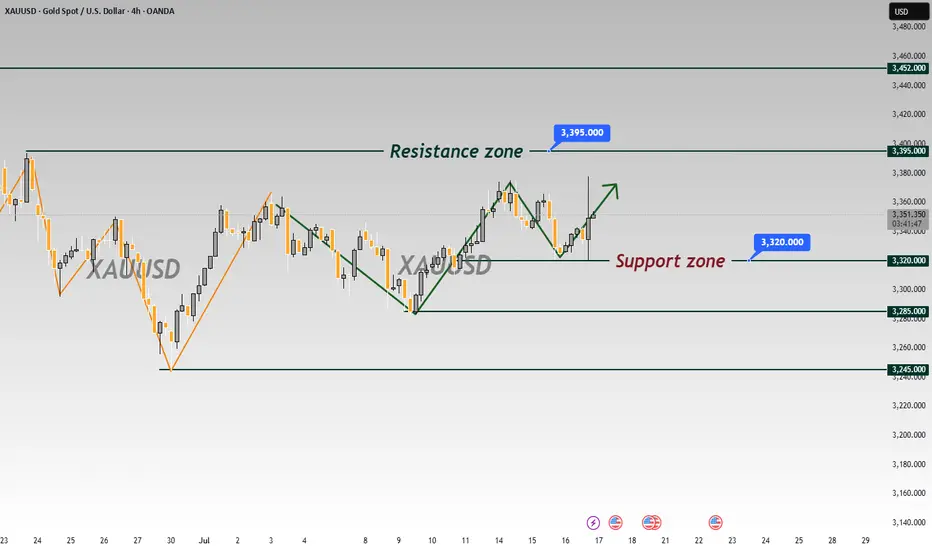
GOLD → The triangle is contracting. Retest of support...FX:XAUUSD tested a local high of 3375 but quickly returned to consolidation. The reason is manipulation by the US administration related to Powell, inflation, and interest rates...
Demand for gold has risen sharply amid global risks: Trump's aggressive tariff plans, strong inflation, and uncertainty about the Fed's actions have increased interest in defensive assets. Despite the temporary strengthening of the dollar, gold remains a popular hedging instrument. Technical analysis also points to a bullish outlook. However, growth potential is limited until the Fed clarifies its interest rate policy
Technically, on the D1 chart, it is clear that the price is consolidating, with the range continuing to narrow. Due to the bullish factors listed above, we can expect growth to continue. However, it is difficult to say where and when the growth will begin due to the uncertainty factor. All attention is on the support at 3320-3312, the triangle support, as well as the consolidation support at 3287.
Resistance levels: 3365, 3375
Support levels: 3320, 3312, 3287
Since the opening of the session, the price has spent part of its daily range, so there may not be enough potential for the decline to continue. A false breakdown of support and consolidation of the price above the key zone may attract buyers, which will trigger growth towards resistance.
Best regards, R. Linda!

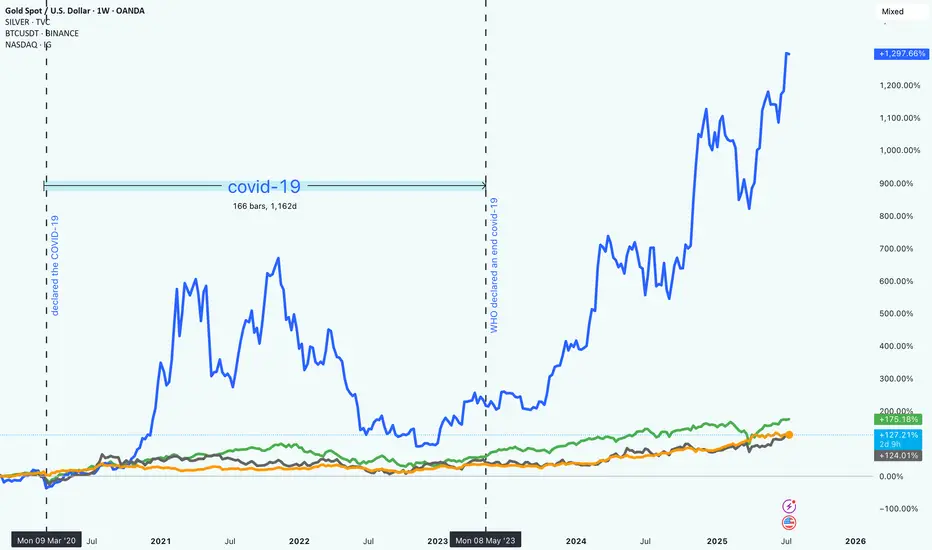
Market Trends from 2020 to 2025How Bitcoin, NASDAQ, Gold, and Silver Really Performed Since 2020
It’s been a wild few years in the markets. From early 2020 to mid-2025, investors have had to navigate uncertainty, changing interest rates, tech booms, and the rise of digital assets. Looking back, it’s clear that some assets took off while others just quietly held their ground.
So, what happened if you had invested in Bitcoin, the NASDAQ, gold, or silver five years ago?
Bitcoin (BTC): +1,297.87%
No surprise here. Bitcoin absolutely stole the show. Despite all the ups and downs (and there were plenty), BTC ended up with nearly 1,300% gains. It had a huge surge in late 2020 and 2021, crashed hard, and then climbed even higher starting in 2023.
This kind of return doesn’t come without risk. Bitcoin was by far the most volatile of the group. But for those who held on, the reward was massive. It also marked a big shift in how people think about money and investing.
"Crypto is no longer just a fringe idea."
NASDAQ: +175.26%
Tech stocks had a strong run, too. The NASDAQ gained around 175%, driven by innovation, digital expansion, and eventually, the AI boom. While there were some bumps along the way (especially when interest rates went up), the general trend was up and to the right.
Unlike Bitcoin, the NASDAQ was more predictable, less explosive.
Gold: +127.39%
Gold did what gold usually does. It held its value and slowly moved higher. Over five years, it returned about 127%, which is pretty solid for a “safe haven” asset. It didn’t grab headlines like crypto or tech stocks, but it stayed reliable through the chaos.
Silver: +124.50%
Silver had a similar story to gold, but with a bit more fluctuation. It benefited from both investor demand and industrial use, and it ended up with just over 124% in gains. Not bad for a metal that often gets overshadowed by its shinier cousin ;).
What It All Means
If you were in Bitcoin, you saw huge gains, but also had to stomach major volatility. Tech investors did well too, especially those who stayed in through the dips. Meanwhile, gold and silver offered steadier, more defensive returns.
One big takeaway: the investment landscape is changing. Traditional assets still matter, but new ones like crypto are reshaping what portfolios can look like.
In the end, it’s about balancing risk and reward!
and figuring out what kind of investor you are.
GOLD DISTRIBUTION TYPEHello folks. its been a while I am posting. Been dealing with this idea last week.
wait for a rally to 3344, if it breaks above 3351 then we still waiting below our main Entry 3280-3289 zone. less stoploss below the friday low.
Trade it swing if we see monday rally. then wait our entry.
Goodluck and have fun trading,
If trading is a lifestyle this is it.
this is your lifestyle.
waiting here is boring.
thats why we need to be more patience.
xiaaaaooo.

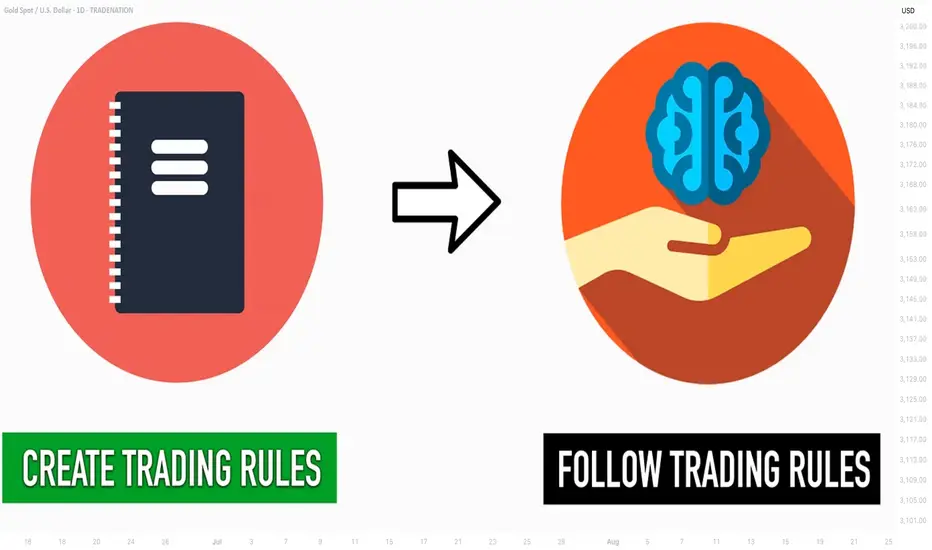
Learn 2 Essential Elements of Forex Gold Trading
In the today's post, we will discuss how Forex Gold trading is structured, and I will share with you its 2 key milestones.
Trading with its nuances and complexities can be explained as the interconnections of two processes: trading rules creation and trading rules following.
1️⃣ With the trading rules, you define what you will trade and how exactly, classifying your entry and exist conditions, risk and trade management rules. Such a set of consistent trading rules compose a trading strategy.
For example, you can have a following trading plan:
you trade only gold, you analyze the market with technical analysis,
you buy from a key support and sell from a key resistance on a daily, your entry confirmation is a formation of a reversal candlestick pattern.
You set stop loss above the high/low of the pattern, and your target is the closest support/resistance level.
Here is how the trading setup would look like.
In the charts above, all the conditions for the trade are met, and the market nicely reached the take profit.
2️⃣ Trading strategy development is a very simple process. You can find hundreds of different ones on the internet and start using one immediately.
The main obstacle comes, however, with Following Trading Rules.
Following the rules is our second key milestone. It defines your ability to stay disciplined and to stick to your trading plan.
It implies the control of emotions, patience and avoidance of rationalization.
Once you open a trade, following your rules, challenges are just beginning. Imagine how happy you would feel yourself, seeing how nicely gold is moving to your target after position opening.
And how your mood would change, once the price quickly returns to your entry.
Watching how your profits evaporate and how the initially winning position turns into a losing one, emotions will constantly intervene.
In such situations, many traders break their rules , they start adjusting tp or stop loss or just close the trading, not being able to keep holding.
The ability to follow your system is a very hard skill to acquire. It requires many years of practicing. So if you believe that a good trading strategy is what you need to make money, please, realize the fact that even the best trading strategy in the world will lose without consistency and discipline.
❤️Please, support my work with like, thank you!❤️
I am part of Trade Nation's Influencer program and receive a monthly fee for using their TradingView charts in my analysis.
XAUUSD - Falling Wedge Parallel ChannelGold Volatility being more. Banks increasing the gold inventories, may surge to new highs. Sharing Some idea it may go either way some big rally or big correction.
This chart is only for educational purpose, Do your own study before taking any trades
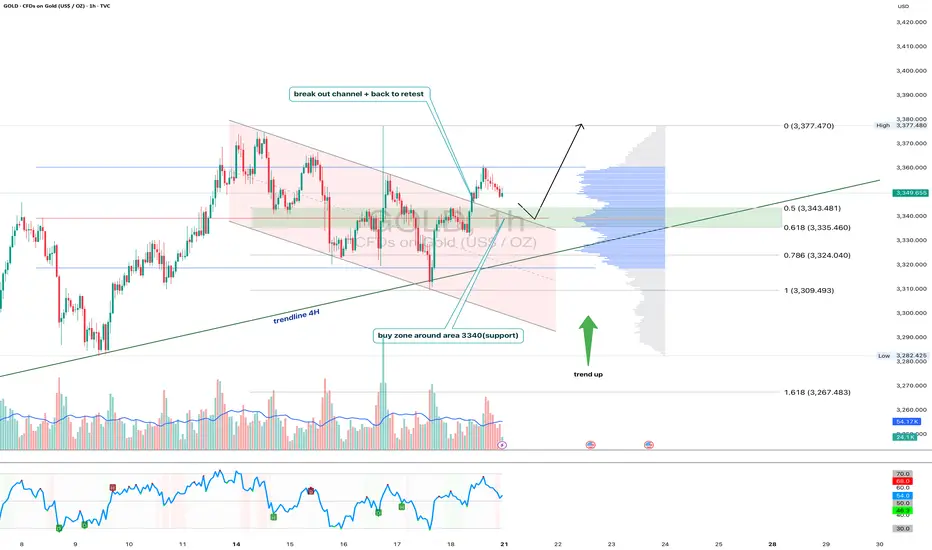
Gold 1H - Retest of channel & support zone at 3340After breaking out of the falling channel, gold is currently retesting its upper boundary — now acting as support. The 3340 zone is particularly important as it aligns with the 0.618 Fibonacci level and high volume node on the visible range volume profile. The price action suggests a potential bullish rejection from this area. With both the 50 and 200 EMA below price on the 1H, the short-term trend remains bullish. The 4H trendline further supports this setup. RSI is cooling off near the neutral zone, leaving room for another leg higher toward the 3377 resistance zone. If 3340 fails, 3324 (0.786 Fibo) becomes the next line of defense. Until then, the structure remains bullish following the successful breakout and retest of the channel.
GOLD/XAUUSD Long Trades Risking 1% to make 1.40%OANDA:XAUUSD / TVC:GOLD Long Trade, with my back testing of this strategy, it hits multiple possible take profits, manage your position accordingly.
Risking 1% to make 1.4%
Note: Manage your risk yourself, its risky trade, see how much your can risk yourself on this trade.
Use proper risk management
Looks like good trade.
Lets monitor.
Use proper risk management.
Disclaimer: only idea, not advice

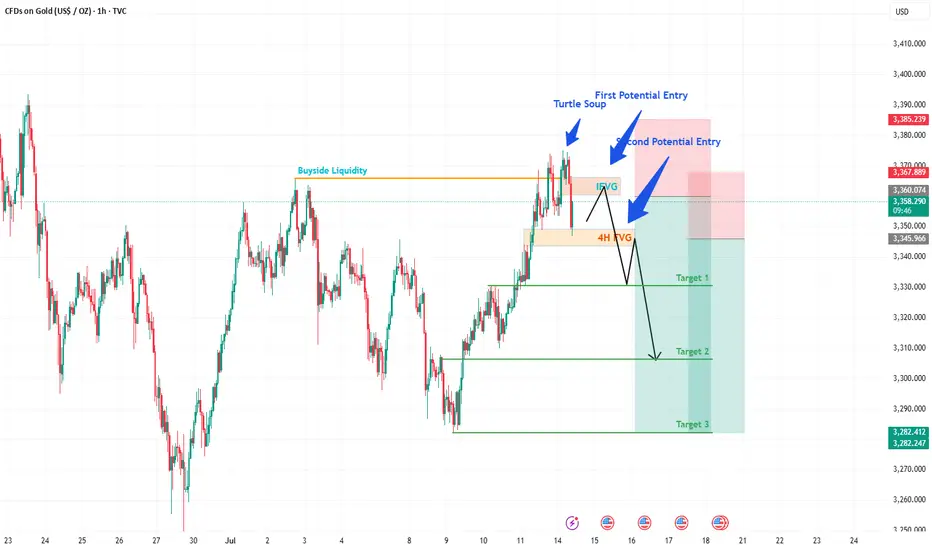
XAUUSD (GOLD) POTENTIAL SELL IDEAGold after hitting 3500 level, has kind of been ranging between 3200 and 3450 level. As we can say that Monday as start of the week has taken a Buyside Liquidity maybe making it high of the week which we will know as the market unfolds itself.
A FVG was formed on 1H before the Buyside was taken and after taking BSL, price sliced through FVG making it IFVG, we can expect Gold to give us a sell trade as it enters this IFVG which will be our first potential entry, placing SL slightly above Buyside Liquidity level.
If our first entry is successful, we can see a second entry when the price slices through the 4h FVG as marked, making it again an IFVG targeting the levels as highlighted on the chart.
FIRST POTENTIAL ENTRY:
Sell @ 3360-3365
Stop loss = 3385
Take Profit = 3335 (Target 1), 3310 (Target 2), 3390 (Target 3)
SECOND POTENTIAL ENTRY:
Sell @ 3340-3345
Stop loss = 3367
Take Profit = 3335 (Target 1), 3310 (Target 2), 3390 (Target 3)
XAUUSD Bullish Trend Fallowing the chart condition Gold continues its bullish trajectory, showing potential for an extension towards the 3400 level, driven by geopolitical concerns and dovish central bank sentiment. Recent tariff related comments from former President Trump have reignited global trade tensions. Fed Chair Powell's recent remarks suggest a cautious stance on future rate hikes, reinforcing bullish sentiment in precious metals.
Technical Overview:
Last Friday, XAUUSD reached the 3368 resistance zone, a critical level where price may consolidate. Momentum remains strong, and if the price breaks above this zone with volume confirmation, the next leg could target 3380–3400 However, caution is advised: if the price falls below 3342, but then regains ground quickly, it may still continue in the bullish trend.
You may find more details in the chart Ps Support with like and comments for more analysis.
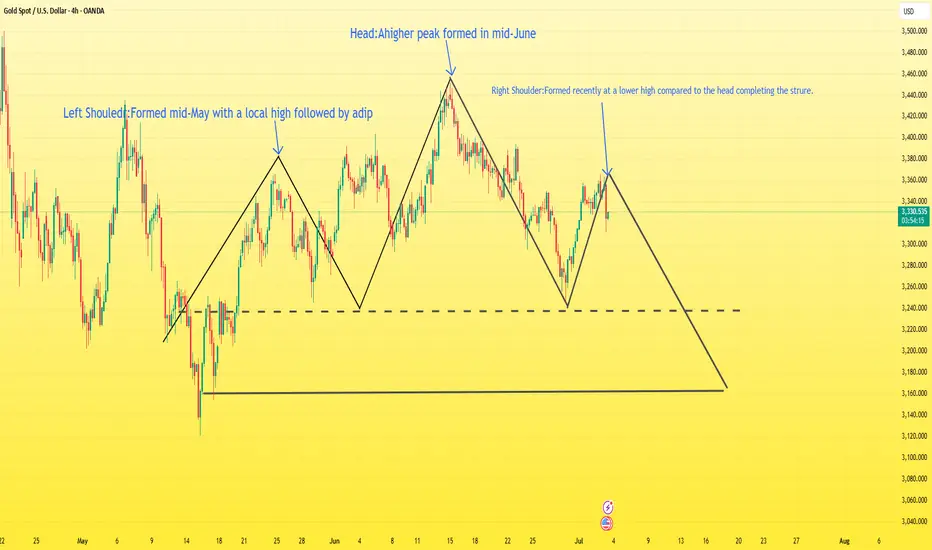
Will gold return to 3500?XAU/USD Head and Shoulders Breakdown Analysis
The chart shows a classic Head and Shoulders pattern forming on the 4H timeframe, indicating a potential bearish reversal setup.
Left Shoulder: Formed mid-May with a local high followed by a dip.
Head: A higher peak formed in mid-June.
Right Shoulder: Formed recently at a lower high compared to the head, completing the structure.
The neckline has been clearly defined, and price is currently hovering just above it. If the price breaks and closes below the neckline with strong bearish momentum, it would confirm the pattern.
Target: The projected target from the breakdown is around 3163, calculated by measuring the height from the head to the neckline and projecting it downward.
Outlook:
A confirmed break below the neckline would open the door for further downside toward the target zone.
Bears will be in control if price sustains below the neckline with increasing volume.
Wait for confirmation on the neckline break before considering short entries.
If you are a newbie or your account is burning, don't trust any advice easily. Contact me. I will give you free advice.
XAUUSD AND GOLD WAS GOES TO BEARISH
🔴 XAUUSD 15M Bearish Trading Idea – Smart Money Trap Unfolding 🩸
🕒 Timeframe: 15-Minute
📉 Bias: Bearish
📊 Strategy: Smart Money Concepts – CHoCH | FVG | LH | LL | BMS | Liquidity Trap
---
📌 Market Context & Structure:
1. Price Action Breakdown:
Market ne Lower High (LH) aur Lower Low (LL) ka consistent bearish structure maintain kiya hai.
A recent CHoCH upward hua, lekin yeh likely a liquidity trap hai — price ne key supply zone ko tap kar ke rejection diya hai.
2. Key FVG Zones:
Multiple bearish FVGs upar exist karti hain (visible in red), jahan price ne react kiya.
Price ne bullish FVG fill karke ab lower timeframe supply zone mein stall karna start kiya hai.
3. EMA Confirmation:
Despite temporary crossover, EMAs still flat or indecisive — suggesting reversal or fakeout.
Price EMA ke around struggle kar raha hai, jo weak bullish attempt ka sign hai.
4. Order Block & Rejection Area:
Current resistance zone (3342–3348) pe strong selling pressure hua hai — potential mitigation + sell-off zone.
---
🔻 Trade Plan – Bearish Continuation Setup:
🔸 Entry Zone:
3342 – 3346 (After rejection confirmation in this zone)
🔻 Stop Loss:
Above 3349 (Above recent LH / supply trap)
🎯 Take Profits:
TP1: 3333 (Recent support)
TP2: 3322 (Demand imbalance)
TP3: 3315 (Major liquidity pool)
📏 Risk:Reward: Targeting 1:2.5 to 1:3+ depending on entry accuracy
---
🧠 Why This Setup is Bearish?
✅ CHoCH bullish was likely a trap; no strong follow-through
✅ Price rejected from key FVG supply zone
✅ Bearish structure still intact — LHs and LLs dominate
✅ EMAs flattening near resistance shows weakness
✅ Liquidity above recent highs has likely been swept — sellers may now dominate

1507 a bull trend back to Gold Hello traders,
Gold has returned back above EMAs on daily chart.
On 4h chart, there is a chance for it to break through last top level to make a new high up to 3438 .
Take a good use liquidity of CPI of US today.
You could get a great result of that.
GOOD LUCK!
LESS IS MORE!
XAUUSD LONG 7/7/25Looking to target 3,450 price level. This is based on:
1. Price has been on a range since April 22 when the high was formed, the low of the move
that formed the high was taken out. Looking to aim to taking out the high.
2. On the weekly timeframe, last week took out the low of the week before and closed bullish
within the candle of the prior week. This provides a signal for a potential sweep of the high
of that week. Minimum 3,365 price level.
