GOLD WEEKLY CHART MID/LONG TERM ROUTE MAPHey Everyone,
Weekly Chart Update – 3387 Tested, Channel Top Rejected
Quick follow up on our Weekly Chart roadmap – price continues to respect the structure with precision.
As anticipated, we got the test of 3387, completing the short term magnet move we've been tracking. That level aligned perfectly with the channel top, and true to form, we saw a clean rejection right on cue just short of the full channel top leaving that open.
Importantly, there was no close or lock above that zone, reaffirming it as valid resistance for now. As a result, the range remains active, with price still oscillating between 3281 support and 3387 resistance.
Key structural notes:
🔹 Structure remains intact
No weekly close above 3387, no breakdown below 3281. The rising channel is still fully respected, and EMA5 has yet to turn bearish.
🔹 3281 Holding Strong
This level continues to act as a key weekly pivot. As long as it holds, we maintain a constructive outlook within the current range.
🔹 3387 Tested + Rejected
First test gave us the expected reaction. Until we see a confirmed close above, it remains the top of the current range.
Updated Levels to Watch:
📉 Support – 3281
Weekly pivot and current range low. Still our key area for dip buys within this structure.
📈 Resistance – 3387
Now tested and confirmed. No break or lock above = valid rejection level.
📈 Resistance 2 – 3482
Unfilled weekly gap. Still the broader target, but we need a proper breakout above 3387 first.
Plan: We continue to treat 3281–3387 as the active weekly range. If 3281 fails, we reassess at the midline of the channel. If 3387 breaks and holds, we shift focus toward 3482.
Thanks again for all the incredible engagement and support, it means a lot to us here at GoldViewFX. Stay focused, stay disciplined.
Mr Gold
GoldViewFX
XAUUSDK trade ideas

GOLD 4H CHART ROUTE MAP UPDATE & TRADING PLAN FOR THE WEEKHey Everyone,
Please see our updated 4h chart levels and targets for the coming week.
We are seeing price play between two weighted levels with a gap above at 3354 and a gap below at 3297. We will need to see ema5 cross and lock on either weighted level to determine the next range.
We will see levels tested side by side until one of the weighted levels break and lock to confirm direction for the next range.
We will keep the above in mind when taking buys from dips. Our updated levels and weighted levels will allow us to track the movement down and then catch bounces up.
We will continue to buy dips using our support levels taking 20 to 40 pips. As stated before each of our level structures give 20 to 40 pip bounces, which is enough for a nice entry and exit. If you back test the levels we shared every week for the past 24 months, you can see how effectively they were used to trade with or against short/mid term swings and trends.
The swing range give bigger bounces then our weighted levels that's the difference between weighted levels and swing ranges.
BULLISH TARGET
3354
EMA5 CROSS AND LOCK ABOVE 3354 WILL OPEN THE FOLLOWING BULLISH TARGETS
3424
EMA5 CROSS AND LOCK ABOVE 3424 WILL OPEN THE FOLLOWING BULLISH TARGET
3499
EMA5 CROSS AND LOCK ABOVE 3499 WILL OPEN THE FOLLOWING BULLISH TARGET
3561
BEARISH TARGETS
3297
EMA5 CROSS AND LOCK BELOW 3297 WILL OPEN THE SWING RANGE
3236
3171
EMA5 CROSS AND LOCK BELOW 3171 WILL OPEN THE SECONDARY SWING RANGE
3089
3001
As always, we will keep you all updated with regular updates throughout the week and how we manage the active ideas and setups. Thank you all for your likes, comments and follows, we really appreciate it!
Mr Gold
GoldViewFX

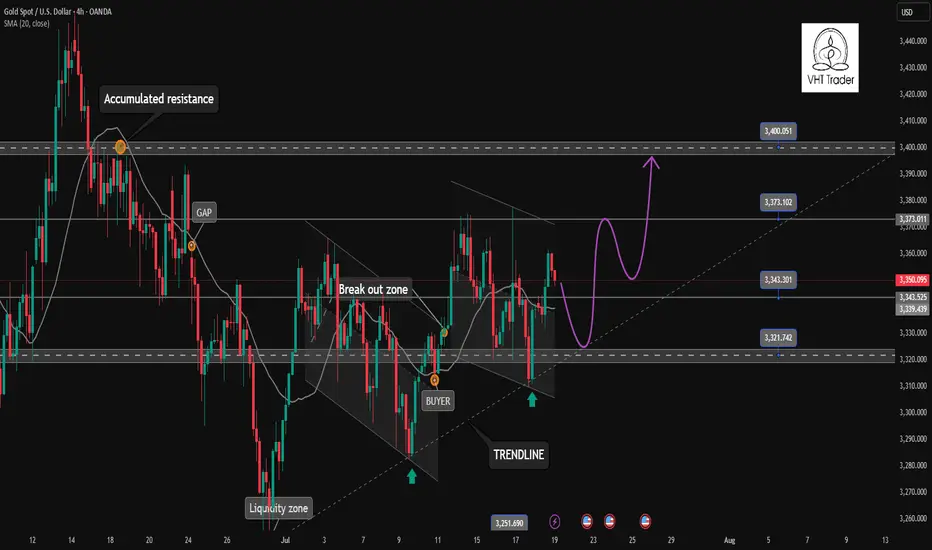
Gold returns to its original nature. Price increase towards 3400✏️ OANDA:XAUUSD is back to its inherent uptrend. Currently trading in a wide range. Shaped by CPI news last week. Trendline is still supporting Gold price towards 3400 next week. Pay attention to the important zone 3373 to DCA BUY and do not SELL when breaking this important zone 3373. Effective trading strategy is to wait for Gold to correct and buy.
📉 Key Levels
Support: 3343 - 3322
Resistance: 3373-3400
Buy Trigger: Rejects the support zone 3343 and reacts to the upside
Buy Trigger: Rebound from 3322
Target 3400
Leave your comments on the idea. I am happy to read your views.
Simple Swing Trading Strategy with Smart Money Concept Explained
I will share with you the essential basics of swing trading forex gold with Smart Money Concepts.
You will learn how to do swing trading with the best SMC strategy.
I will teach you to c ombine order blocks, liquidity zones and imbalances to spot accurate entries and confirmation signals.
If you just started learning swing trading Forex with Smart Money Concepts, I strictly recommend trading with the trend only.
The cases and examples that we will discuss will be strictly trend-following ones.
Swing Trading with SMC in Uptrend
For swing buying any forex pair, we will look for the market that is trading in a bullish trend.
To confirm that the market is rising, you will need to execute structure mapping and find a forex pair that updates Higher Highs HH and Higher Lows HL.
Above is the example how I confirmed that GBPUSD is bullish with structure mapping. You can see that the pair consistently updates the highs.
Once you identified a bullish pair, your next step will be to find the zone from where the next swing move will follow.
According to the rules, the market remains in uptrend till the price is staying above or on the level of the last Higher Low HL.
Here is such a zone on GBPUSD.
It is based on the last Higher Low and current price levels.
We will assume that buying orders will concentrate within that area and from that a bullish rally will follow.
The problem is that this area is extremely wide, and we can not just buy randomly within.
Our next step will be to find liquidity zones within.
To buy, we need demand areas.
I found 4 price action based historic demand zones on GBPUSD.
We will need to wait for the test of one of these zones and then wait for an order block - a place where smart money are placing their buy orders.
The problem is that we don't know in which of these areas the order block is, so we will need to wait for tests of these zones and a consequent imbalance to confirm it.
To confirm a bullish imbalance for swing trading Forex, I recommend analyzing a 4H time frame after a test of a demand zone.
According to Smart Money Concepts, a bullish imbalance can be any sign of strength of the buyers : bullish breakout of a vertical/horizontal resistance, change of character, high momentum bullish candle, bullish price action pattern, etc.
An order block on GBPUSD was confirmed with a breakout of a resistance line of a falling channel on a 4H time frame.
That was the signal that Smart Money are buying, and that is your signal to open a swing long trade.
You place a buy position then with a stop loss below the order block and a target - at least a current high.
Swing Trading with SMC in Downtrend
For swing selling any forex pair, you will need to find a market that is trading in a bearish trend.
I suggest applying structure mapping to identify such a pair.
It simply should update Lower Lows LL and Lower Highs consistently.
USDCAD is trading in a bearish trend.
Structure mapping helps to easily confirm that.
Then, we will need to identify the zone from where the next bearish wave will start.
According to Smart Money Concepts structure mapping rules, the market remains bearish till the price is staying below or on the level of the last Lower High LH.
That's such a zone on USDCAD.
It is based on current prices and the last Lower High.
We will assume that selling orders will be distributed along the entire lenth of our zone.
Of course, we can not sell randomly within that zone because it is relatively extended.
Our next task will be to find liquidity supply zones within.
I found 2 price action based supply zones within our underlined area.
Before we sell, we will need to find an order block.
A place from where smart money are selling big.
To spot that, I suggest waiting for a test of one of our supply zones and wait for a bearish imbalance on a 4H time frame.
According to SMC, a bearish imbalance can be a bearish high momentum candle, a bearish CHoCH, a bearish price action pattern, a bearish breakout of a horizontal/vertical support , etc.
You can see that a lower supply zone was tested on USDCAD.
Our bearish order block confirmation is a bearish Change of Character, a formation of a high momentum bearish candle and a breakout of a rising trend line.
After that we can open a swing sell position and expect a bearish movement at least to a current low.
Stop loss should lie strictly above the order block.
TP should be at least a c urrent low.
That is how a trade should be executed on USDCAD pair.
Remember that there is no guarantee that the order block will be within a liquidity zone. You should learn to track the signs of smart money and their operations.
A proper combination of a trend analysis, liquidity zones and order block is the essential basis of a profitable swing trading Forex.
Mastering that, practice recognizing the imbalances and confirmations for spotting the best swing trading entries.
❤️Please, support my work with like, thank you!❤️
I am part of Trade Nation's Influencer program and receive a monthly fee for using their TradingView charts in my analysis.
Gold on Bullish values as expectedTechnical analysis: Gold was close to the important #3,377.80 Hourly 1 chart’s Resistance test (Xau-Usd Spot numbers), as the Price-action was rejected on #3,332.80 - #3,338.80 configuration, which shows how slow to reveal major move Gold has become (not taking Technical Sell trend into account) as market sentiment didn’t even made a kick-start of full scale downtrend extension / even though that DX is still without recovery candles, counterbalancing the sequence, Trading near local Low’s. If there wasn’t DX Resistance rejection developments (which is stalling the uptrend on Gold), Price-action would be significantly Higher. Gold should eventually honor the Support break on DX and deliver an Short-term Buying impulse which should be seen early on regarding U.S. session, reversing again despite Friday’s late session rise, Bond Yields are Trading near their Weekly (#1W) Weekly chart’s Support - reveals an Bullish Short-term sentiment Gold is Trading under and constant Bullish spikes are the product of it.
My position: I will continue Buying every dip on Gold as stated many times throughout my recent remarks maintaining #3,377.80 and #3,400.80 benchmark as an Medium-term Targets.

Gold - Above 3370 Is Bullish Territory – But 3360 Must Hold📆 What happened yesterday?
After more than a week of frustrating, sideways price action, Gold finally broke out above the key 3370 resistance zone.
The breakout was clean and impulsive, with TRADENATION:XAUUSD pushing to an intraday high around 3400.
Following that move, price printed a small double top near the high and began a modest correction — perfectly normal after such a breakout. At the time of writing, Gold trades at 3385, still holding above former resistance.
📈 Why this breakout matters:
The daily close at 3396 came in strong and near the top, leaving behind a clear Marubozu candle
This kind of price action signals conviction and momentum
The breakout confirms what I’ve been anticipating for days — the range is resolved, and the market is choosing the bullish path
🎯 What to expect next:
If price stabilizes above 3400, the road to 3450 opens — which is the target mentioned in my previous analyses
That area represents the next major resistance and likely magnet for price if bulls stay in control
🧭 Trading Plan:
For me, the plan is now simple:
✅ Buy the dips — especially on a potential retest of the 3370–3375 broken resistance, which now turns into support
❌ Negation comes only with a daily close below 3360, which would invalidate this breakout and raise questions
📌 Conclusion:
The breakout has finally come. After days of coiling, Gold chose the upside.
Momentum is building, structure is clean, and bulls are back in control — unless 3360 fails.
Until then, I remain bullish, looking to buy dips into strength. 🚀
Disclosure: I am part of TradeNation's Influencer program and receive a monthly fee for using their TradingView charts in my analyses and educational articles.
Gold Correction Went Deeper, but the Bullish Structure Intact📌 Quick recap from yesterday:
In my previous analysis, I mentioned that I was looking to buy dips around 3400, expecting a continuation move toward the ATH near 3500.
That was the plan.
But as the day unfolded, I removed my pending buy order — and explained exactly why in an educational post on how context can override entry levels.
If you read that, you already understand:
It’s not where price goes. It’s how it gets there.
________________________________________
📉 So… where are we now?
The big question is:
Was this just a deeper correction, or is Gold preparing to shift direction entirely?
In my opinion, we’re still in a healthy correction, not a reversal.
Why?
• Price remains above the horizontal support — the same level that acted as resistance last week
• The market is still above the trendline from mid-May
• No breakdown, no major structure violation — just deeper retracement after a sharp impulsive move
________________________________________
📈 What’s the plan going forward?
As long as these two supports hold, I believe the buy-the-dip narrative remains valid — even at better prices.
In fact, I already entered a new long position about an hour ago, which is currently up around 90 pips at the time of writing.
My bias stays bullish unless proven otherwise.
________________________________________
📌 Conclusion:
Yes, the correction went deeper than expected.
Yes, I removed a pending order — because the reaction was not what I wanted to see.
But structure still supports continuation, and I remain in the buy-the-dip camp as long as key support holds. 🚀
Disclosure: I am part of TradeNation's Influencer program and receive a monthly fee for using their TradingView charts in my analyses and educational articles.
Latest Gold Price Update TodayHello everyone, what do you think about the price of gold today?
As the new week begins, gold continues the upward trend started at the end of Friday’s session. As of now, the precious metal is trading around 3356 USD, with the uptrend still being supported.
From a carefully analyzed technical perspective, gold successfully broke out of the downward channel, taking advantage of the weakening USD. The price increase is convincing in the short term, especially after testing and confirming the previous breakout as a new support zone (around 3345 USD).
The upward target is expected to continue, with key levels to watch being 3372 USD and the H4 resistance at 3390 USD.
What do you think about the price of gold today? Feel free to share your thoughts in the comments!
Good luck!

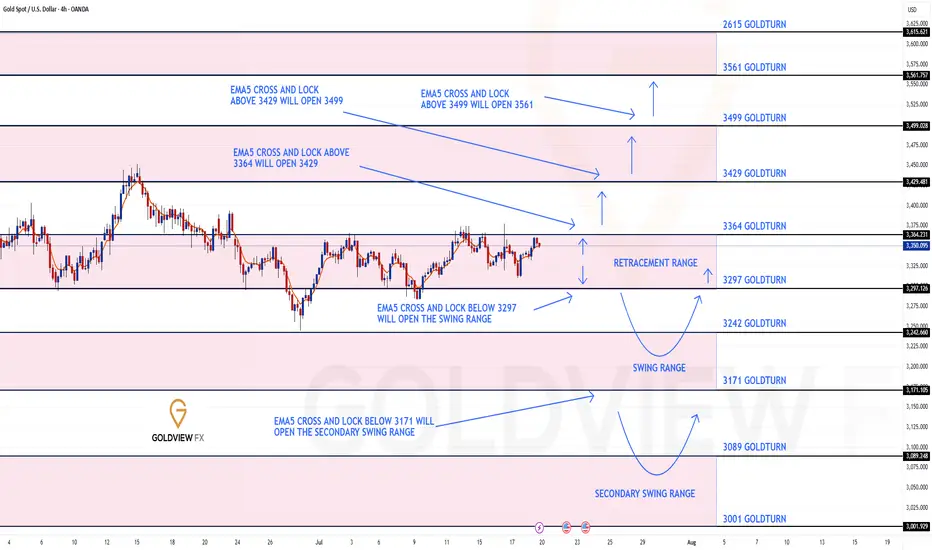
GOLD 4H CHART ROUTE MAP UPDATE & TRADING PLAN FOR THE WEEKHey Everyone,
Please see our updated 4h chart levels and targets for the coming week.
We are seeing price play between two weighted levels with a gap above at 3364 and a gap below at 3297. We will need to see ema5 cross and lock on either weighted level to determine the next range.
We will see levels tested side by side until one of the weighted levels break and lock to confirm direction for the next range.
We will keep the above in mind when taking buys from dips. Our updated levels and weighted levels will allow us to track the movement down and then catch bounces up.
We will continue to buy dips using our support levels taking 20 to 40 pips. As stated before each of our level structures give 20 to 40 pip bounces, which is enough for a nice entry and exit. If you back test the levels we shared every week for the past 24 months, you can see how effectively they were used to trade with or against short/mid term swings and trends.
The swing range give bigger bounces then our weighted levels that's the difference between weighted levels and swing ranges.
BULLISH TARGET
3364
EMA5 CROSS AND LOCK ABOVE 3364 WILL OPEN THE FOLLOWING BULLISH TARGETS
3429
EMA5 CROSS AND LOCK ABOVE 3429 WILL OPEN THE FOLLOWING BULLISH TARGET
3499
EMA5 CROSS AND LOCK ABOVE 3499 WILL OPEN THE FOLLOWING BULLISH TARGET
3561
BEARISH TARGETS
3297
EMA5 CROSS AND LOCK BELOW 3297 WILL OPEN THE SWING RANGE
3242
3171
EMA5 CROSS AND LOCK BELOW 3171 WILL OPEN THE SECONDARY SWING RANGE
3089
3001
As always, we will keep you all updated with regular updates throughout the week and how we manage the active ideas and setups. Thank you all for your likes, comments and follows, we really appreciate it!
Mr Gold
GoldViewFX
Gold momentum is about to explode, is 3400 still far away?
💡Message Strategy
Gold prices rose as expected on Friday as a weaker dollar and continued geopolitical and economic uncertainty boosted demand for safe-haven gold. Spot gold rose 0.4% to $3,353.25 an ounce, down 1.1% in the previous session. U.S. gold futures also rose 0.4% to $3,359.70. Gold prices remained largely stable around $3,350 an ounce this week.
The trend of gold prices is currently mainly affected by the following three factors:
1. US economic data supports the US dollar
The latest US real estate data is generally positive, and building permits and new housing starts data are both above expectations. The recovery of the real estate market has reduced market concerns about economic recession, which has provided some support to the US dollar, thereby constituting a certain suppression on gold.
2. Fed policy differences trigger market games
Fed officials have obvious differences in their statements on monetary policy. Christopher Waller, a Fed governor, prefers to directly cut interest rates by 25 basis points in July, worried about economic slowdown and weak job market. San Francisco Fed President Daly believes that two interest rate cuts in 2025 are "reasonable", but is wary of the impact of excessive tightening policies on the job market.
On the contrary, Fed Governor Kugler is more hawkish, believing that recent tariffs have been transmitted to consumer prices, and high interest rates should continue to be maintained, and it is not appropriate to cut interest rates for the time being. The existence of differences has caused market expectations to waver, and gold has fallen into consolidation.
3. Inflation expectations determine the medium-term direction of gold prices
The June CPI data from the United States showed signs of rising inflation, which may cause the Federal Reserve to postpone the pace of interest rate cuts.
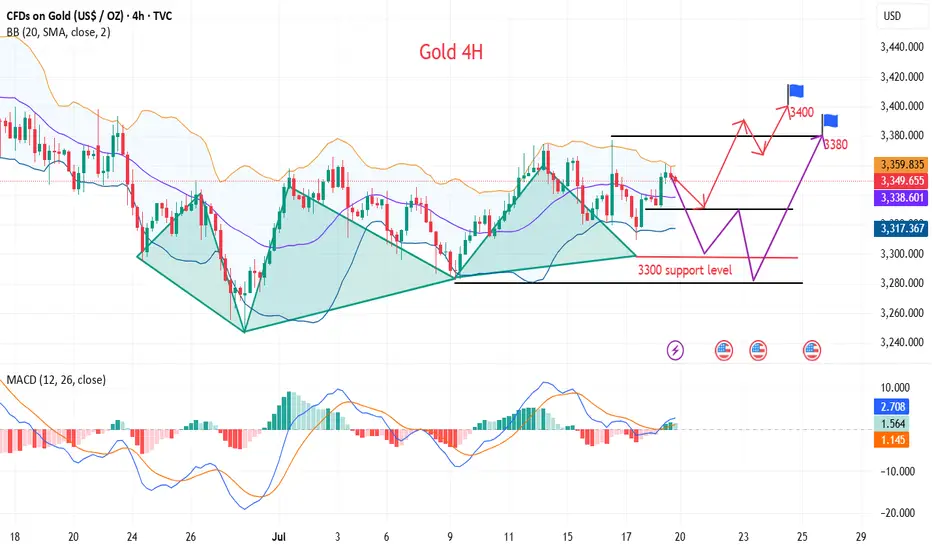
📊Technical aspects
From the 4H chart, gold is currently oscillating in an obvious symmetrical triangle, forming a consolidation pattern in the short term.
Bollinger Band indicator: The middle track of the Bollinger Band is at $3345, the upper track is at $3405, and the lower track is at $3280. The current price is running near the middle track, indicating that volatility is converging and there is an expectation that a direction will be chosen soon.
Support and resistance: The current key support level is $3,280; short-term support is 3,300, and the upper resistance is $3,380. After breaking through, it is expected to test the previous highs of $3,451 and $3,499.
MACD indicator: The MACD histogram is gradually converging, and the DIFF line (3.19) and the DEA line (1.91) are in a sticky state, indicating that the momentum is exhausted and the probability of short-term shocks is high, but once the volume breaks through, the trend may form quickly.
RSI indicator: The RSI indicator is currently at 53.64, which is in the neutral area and has not entered the overbought or oversold area, indicating that the market is still waiting for new direction signals.
Overall, the analysis believes that gold is at the end of a symmetrical triangle, and the technical side shows that it is about to face a breakthrough. The direction choice may appear tonight or early next week, and the idea is still mainly low-level bulls.
💰Strategy Package
Long Position:3320-3330,SL:3300,Target: 3370-80,3400
XAUUSD bullish breakout from major supply zone retracement done📊XAUUSD Forecast – 1H Timeframe
Gold has broken out above the major supply zone at 3375, showing strong bullish intent
Price is now pulling back — retracement in progress back to the breakout level for a potential bullish continuation
📍 Key Zone to Watch:
3375 now acting as strong support — waiting for a bullish confirmation candle from this zone
🎯 Next Resistance / Target Levels:
🔹 3399 – minor resistance
🔹 3435 – key supply zone on watch
🧠Waiting patiently for confirmation before re-entering — structure still bullish on the 1H timeframe
What’s your next move on Gold? Drop your thoughts below
👍 Like | 🔔 Follow | 💭 Comment for real-time trade ideas
#xauusd #gold

DeGRAM | GOLD will retest the channel boundary📊 Technical Analysis
● Fresh rejection at the blue resistance line (~3 435) pushed XAU back to the 3 355 mid-band, yet successive higher-lows (green arrows) keep price inside the May-origin rising channel.
● The pullback is probing 3 328-3 355 — confluence of the former flag roof and triangle top; holding this zone should launch another test of 3 400/3 435, with the channel crest targeting 3 500.
💡 Fundamental Analysis
● U-S S&P-Global PMIs softened, nudging 2-yr real yields to three-week lows, while cautious ECB rhetoric limits dollar gains — both supportive for gold.
✨ Summary
Long 3 328-3 355; above that aims 3 400 ➜ 3 435, stretch 3 500. Invalidate on an H4 close below 3 293.
-------------------
Share your opinion in the comments and support the idea with a like. Thanks for your support!

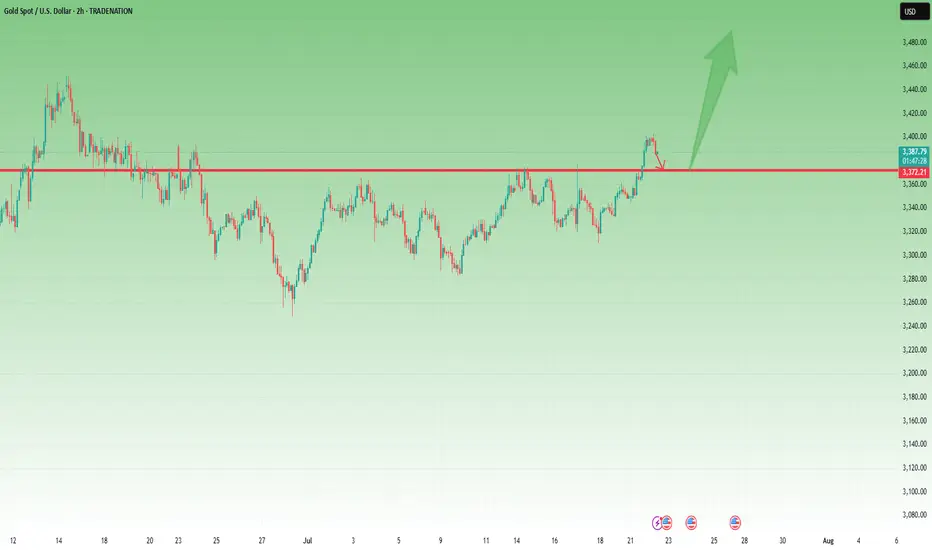
GOLD - Important Breakout !Hello Traders !
The Gold price formed an ascending triangle pattern.
Currently, The resistance level is broken!
So, I expect a bullish move🚀
_______________
TARGET: 3414🎯

XAU/USD – Likely Wave ⑤ Top In – ABC Correction in Progress!OANDA:XAUUSD
✅ We’ve most likely completed our (Circle) Wave ⑤, and are now entering the first corrective wave of an ABC pattern (marked in 🟡 yellow brackets).
🔹 The (A) wave unfolded as a clean white ABC correction – textbook structure, worked out perfectly.
🔹 From (A) to (B) we saw an impulsive move (likely a 1-2-3-4-5, though not labeled).
🔻 From (B), a strong bearish move broke right through our 🔴 ascending trendline, signaling a potential trend reversal.
👉 We’ve likely completed wave 1 of the new downtrend and are now in a corrective move upward, forming yellow wave 2:
🟡 (A) – (B) – (C), with the (B) once again forming an internal ABC structure.
🎯 We’re now watching for the completion of wave C – this will complete yellow wave 2.
📐 The target zone (TP) lies in the yellow Fibonacci retracement area, with a key level at the 78.6% retracement (marked in white).
🛑 Stop Loss should be placed above the 4-month zone, or just above wave (B).
📊 The Take Profit will be more precise once the top of wave C is confirmed – but expect it to align closely with the 🔵 Fibonacci extension zone.

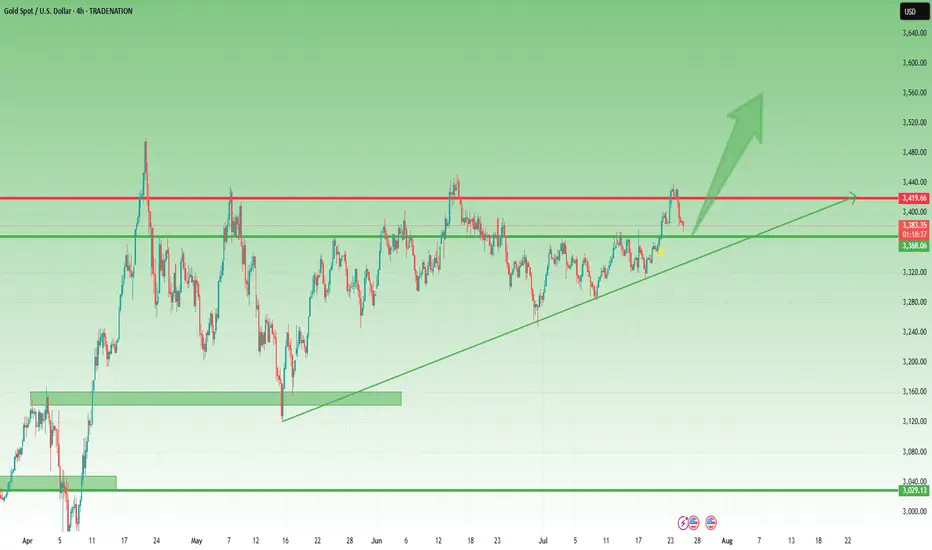
XAU/USD BULLISH SETUPThe XAUUSD chart displays a strong bullish setup, with price action moving consistently above the ascending trendline. Recent price movements show a breakout from a consolidation phase, which is confirmed by the Ichimoku cloud providing additional support for upward momentum. The chart highlights a blue demand zone where buyers have stepped in multiple times, indicating strong support and buying interest. The projected move suggests a continuation toward the next resistance zone around the 3400 level, marked as target-1. Previous resistance levels have been successfully retested as support, further strengthening the bullish scenario. The overall market sentiment favours buyers, aiming for higher highs as long as the price stays above the key support levels.
Entry Buy: 3335
Target point: 3397
Stop loss: 3317
If you found this analysis helpful, don’t forget to drop a like and comment . Your support keeps quality ideas flowing—let’s grow and win together! 💪📈

Bullish continuation?The Gold (XAU/USD) is falling towards the pivot and could bounce to the 1st resistance.
Pivot: 3,390.13
1st Support: 3,356.66
1st Resistance: 3,491.05
Risk Warning:
Trading Forex and CFDs carries a high level of risk to your capital and you should only trade with money you can afford to lose. Trading Forex and CFDs may not be suitable for all investors, so please ensure that you fully understand the risks involved and seek independent advice if necessary.
Disclaimer:
The above opinions given constitute general market commentary, and do not constitute the opinion or advice of IC Markets or any form of personal or investment advice.
Any opinions, news, research, analyses, prices, other information, or links to third-party sites contained on this website are provided on an "as-is" basis, are intended only to be informative, is not an advice nor a recommendation, nor research, or a record of our trading prices, or an offer of, or solicitation for a transaction in any financial instrument and thus should not be treated as such. The information provided does not involve any specific investment objectives, financial situation and needs of any specific person who may receive it. Please be aware, that past performance is not a reliable indicator of future performance and/or results. Past Performance or Forward-looking scenarios based upon the reasonable beliefs of the third-party provider are not a guarantee of future performance. Actual results may differ materially from those anticipated in forward-looking or past performance statements. IC Markets makes no representation or warranty and assumes no liability as to the accuracy or completeness of the information provided, nor any loss arising from any investment based on a recommendation, forecast or any information supplied by any third-party.

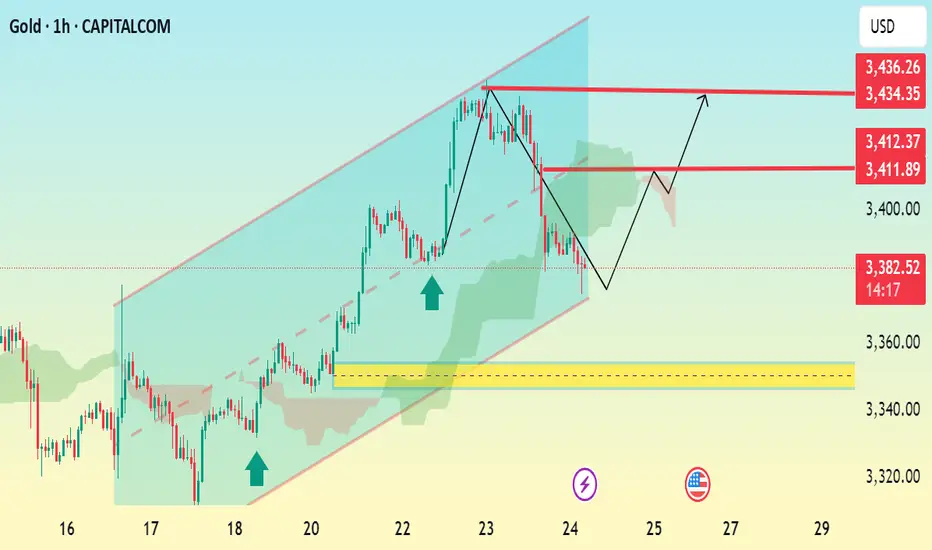
GOLD 1H Bullish Reversal AnalysisAnalysis Summary: Gold (XAU/USD) is currently trading at 3,383.75 and has shown a corrective move after reaching a recent high near 3,436.26. The chart indicates a bullish channel with support holding near the lower boundary of the channel.
Key Observations:
Price has pulled back sharply but respected the channel's lower trendline, suggesting a potential bullish reversal.
A bullish rebound is anticipated from the 3,360–3,370 zone, marked by the yellow support area.
Two key resistance levels are highlighted at 3,411.89 and 3,434.35.
The Ichimoku Cloud is thin ahead, suggesting less resistance for upward momentum.
Potential Trading Setup:
Entry Zone: Near 3,370–3,383 (support zone or on bullish confirmation).
TP1: 3,411
TP2: 3,434
SL: Below 3,360 (outside the channel and below yellow zone).
GOLD DAILY CHART ROUTE MAPHey Everyone,
Daily Chart Update – Bounce + Rejection: Structure Still Dominates
Just a quick follow up on our range structure, we got exactly what we were anticipating.
Price gave us the perfect bounce off 3272, launching into 3433 for THE test of resistance. That move delivered another clean 160+ pip rotation, once again showing how laser accurate the structure has been.
As expected, 3433 held as resistance, and the lack of a break and hold above confirms another clean rejection. The range between 3272 support and 3433 resistance remains firmly in play, and structure continues to govern price action to the pip.
Here’s where we are now:
🔹 Range Still Active
Price continues to rotate inside our 3272–3433 box. Until we see a clean break and close beyond either boundary, we’ll keep playing the range.
🔹 No Breakout = No Change
The failure to break and lock above 3433 confirms rejection. We’re still looking for EMA5 lock for potential breakout confirmation, until then, range trades rule.
🔹 Precision Holds
Both 3272 and 3433 have now been tested and held perfectly. The respect these levels continue to show reaffirms their importance in our roadmap.
Updated Key Levels
📉 Support – 3272
Continues to act as a major pivot. Valid long entries remain on dips into this zone, unless a breakdown occurs.
📈 Resistance – 3433
Now officially tested and confirmed. Watching closely for any future breakout attempts or another rotation lower.
Thanks again for all the amazing support. Sticking to the plan, trading the structure, and staying disciplined.
Mr Gold
GoldViewFX

XAUUSD Breakout Structure | Smart Money Bullish Roadmap 🚨 XAUUSD 2H | Smart Money Concept Setup
Price perfectly tapped into demand zone and showed a strong bullish reaction — now forming a clear BOS (Break of Structure).
📍 Key Liquidity Zones:
• Price swept previous lows and is now targeting major liquidity levels marked as “Target Points.”
• Bullish momentum is expected to push price towards 3410 – 3425 range 📈
🔁 Expect possible consolidation before a continuation to upper targets.
💡 Strategy:
Wait for a minor pullback near the 3380–3390 level for confirmation, then ride the momentum to higher targets.
🎯 Target Levels:
1. 3398 ✅
2. 3410 🚀
3. 3425+ (Final Target)
📌 Like, Follow & Save if you caught this early 📊
#XAUUSD #SMC #LiquidityGrab #GoldSetup #TradingViewIdea #SmartMoney #Breakout

Gold in Demand Zone | Target $3,380🚨 GOLD/USD – BIG MOVE LOADING! 🚨
🔍 Price is currently reacting from a major demand zone ($3,340–$3,345) with signs of accumulation and a possible double bottom pattern forming.
📉 After a strong downtrend, this looks like a liquidity sweep and smart money trap — prepping for a reversal back to the $3,380 resistance zone where liquidity resides.
📈 Scenarios to Watch:
1️⃣ Price sweeps support again and reverses hard
2️⃣ Clean structure break above $3,365, followed by a retest
🎯 Target: $3,380–$3,385
🛡️ Invalidation: Strong close below $3,335
⚠️ Confirmation Required! Best entry would be after structural break + retest. Keep your risk tight, and let the market show its hand.
⸻
📌 Key Levels:
• Support Zone: $3,340–$3,345
• Target Zone: $3,380–$3,385
• Invalidation: Below $3,335
⸻
📣 If this setup helps you, like 👍, comment 💬, and follow 🔔 for more high-probability ideas every week!
#Gold #XAUUSD #SmartMoney #LiquidityGrab #ForexSetup #PriceAction #BreakoutTrade #DoubleBottom #TradingView #GoldAnalysis #ForYou #FXStrategy #SupplyAndDemand

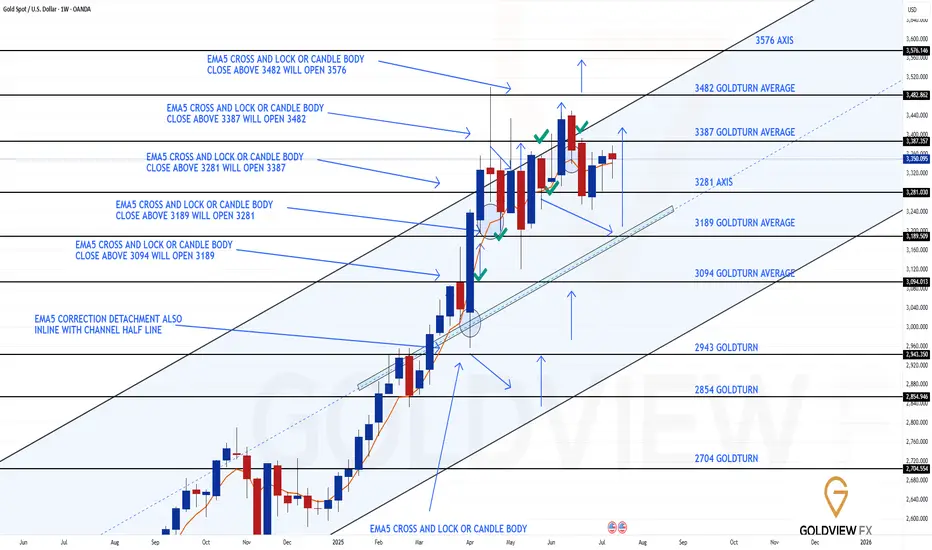
GOLD WEEKLY CHART MID/LONG TERM ROUTE MAPHey Everyone,
Please see update on our Weekly Chart idea.
As of now, nothing has changed structurally, the framework remains fully intact, and price continues to trade cleanly within the defined range.
After delivering a rejection at the channel top, price pulled back into 3281 support, where buyers once again stepped in decisively. That level held firm on a weekly closing basis, validating it as a reliable pivot and launching price back into bounce mode.
Despite the progress, we’ve yet to test the 3387 gap, which continues to act as a short term magnet. The longer range gap at 3482 also remains open and in focus as the larger objective.
Key takeaways from the current structure:
🔹 Structure unchanged:
The rising channel remains orderly. EMA5 still hasn’t locked bearishly, and the mid-line continues to climb beneath price, maintaining a constructive bias.
🔹 Support confirmed – 3281:
Held for a second time, reaffirming its significance in the broader structure.
🔹 3387 gap still in play:
While price is gravitating toward this zone, it has not yet been tested. Expect a reaction on first contact.
Updated Levels to Watch:
📉 Immediate Support – 3281
Held again, reinforcing its status as the key structural axis.
📈 Resistance 1 – 3387
Still untested. Remains the active near term target.
📈 Resistance 2 – 3482
Unfilled weekly gap and broader objective.
Plan:
As long as 3281 continues to hold, the bias remains for a measured grind higher toward 3387 and, eventually, 3482. If 3281 fails, we’ll reassess at the rising mid line for the next structured long opportunity.
As always, we will keep you all updated with regular updates throughout the week and how we manage the active ideas and setups. Thank you all for your likes, comments and follows, we really appreciate it!
Mr Gold
GoldViewFX
GOLD - SHORT TO $2,800 (UPDATE)Price has pushed up as expected back into the $3,400 zone, where we had a lot of pending liquidity that needed to be wiped out. Now that liquidity is collected I am patiently waiting for some form of 'distribution price action' to play out, before I consider selling. Until then I'm sitting on the sideline.
If Gold takes out Wave 2 high ($3,451) then bearish structure is invalidated & we can start looking at buy trades.

Sell Reversal We have QML and price broke structure to the downside on a daily TF and price retraced back to premium price ... Possible Strong sell
